Research Collection
Journal Article
A high-resolution view of the recent drought trends over the Iberian Peninsula
Author(s):
Páscoa, Patrícia; Russo, Ana; Gouveia, Célia M.; Soares, Pedro M.M.; Cardoso, Rita M.; Careto, João A.M.;
Ribeiro, Andreia F.S.
Publication Date:
2021-06
Permanent Link:
https://doi.org/10.3929/ethz-b-000478379
Originally published in:
Weather and Climate Extremes 32, http://doi.org/10.1016/j.wace.2021.100320
Rights / License:
Creative Commons Attribution-NonCommercial-NoDerivatives 4.0 International
This page was generated automatically upon download from the ETH Zurich Research Collection. For more information please consult the Terms of use.
ETH Library
Weather and Climate Extremes 32 (2021) 100320
Available online 24 March 2021
2212-0947/© 2021 The Author(s). Published by Elsevier B.V. This is an open access article under the CC BY-NC-ND license
(http://creativecommons.org/licenses/by-nc-nd/4.0/).
A high-resolution view of the recent drought trends over the Iberian Peninsula
Patrícia P ´ ascoa
a,b,c,*, Ana Russo
c,**, C ´ elia M. Gouveia
a,c, Pedro M.M. Soares
c, Rita M. Cardoso
c, Jo ˜ ao A.M. Careto
c, Andreia F.S. Ribeiro
c,daInstituto Portuguˆes do Mar e da Atmosfera, Lisboa, Portugal
bEnvironmental Physics Laboratory (EPhysLab), CIM-UVigo, Universidade de Vigo, Ourense, Spain
cInstituto Dom Luiz (IDL), Faculdade de Ciˆencias, Universidade de Lisboa, 1749-016, Lisboa, Portugal
dInstitute for Atmospheric and Climate Science, ETH Zurich, Universit¨atstrasse 16, Zurich, 8092, Switzerland
A R T I C L E I N F O Keywords:
Standardized precipitation and evapotranspiration index (SPEI) Standardized precipitation index (SPI) Meteorological extremes
Precipitation Temperature Evapotranspiration
A B S T R A C T
Droughts are a long-term weather-driven extreme event which occurs worldwide with great socio-economic impacts, namely in the Mediterranean and the Iberian regions. In a changing climate with rising tempera- tures, extreme events, such as droughts, are expected to increase in frequency and intensity, particularly in Mediterranean climates. In this context, the assessment of the evolution of drought in terms of its duration and intensity in the Iberian Peninsula (IP) is paramount, as it affects several socio-economic activities. The use of new high-resolution gridded datasets allows for the identification of patterns with finer temporal and spatial scales. In the current study, drought assessment in the IP was accomplished with both the Standardized Precipitation Evaporation Index (SPEI) and the Standardized Precipitation Index (SPI) for short-, medium- and long-timescales.
A recently developed high-resolution dataset, Iberia01, was used, for the period 1971–2015, with 0.1◦horizontal resolution. The lower-resolution CRU dataset was also used. A clear drying trend in most of the IP is identified with both indices and both datasets. The trends of drought duration are also positive in most of the territory, whereas the mean drought intensity decreases slightly. The drivers of this drying trend are both the decreased precipitation and the increased reference evapotranspiration. The Iberia01 dataset allowed to identify more complex patterns of drought trends, mainly due to the improved representation of precipitation.
1. Introduction
During the last decades, a substantial emphasis has been devoted worldwide to extreme weather events, namely to droughts (e.g. Dai, 2011; Vicente-Serrano et al., 2014; Schubert et al., 2016). Still, drought assessment continues to be challenging as there is no unique definition of drought, and drought occurrence has impacts on a diversity of tem- poral and spatial scales (Wilhite et al., 2007). The phenomenon consti- tutes a balance between water supply, demand, and management (Lloyd-Hughes, 2014; Vicente-Serrano et al., 2019). This challenge is even more emphasized by the reported uncertainties on how the different feedback mechanisms involved in drought occurrence interlace (Dai, 2011; Schubert et al., 2016). As a result, the most recent reports of the Intergovernmental Panel on Climate Change (IPCC) suggested only low-to-medium confidence in recent drought trends worldwide (IPCC,
2014). Additionally, drought does not affect different regions of the world in the same way. Some areas of the world are considered to have higher probability of drought occurrence (Spinoni et al., 2014), partic- ularly under climate change conditions (Dai, 2011; Vicente-Serrano et al., 2019).
Nonetheless, drought assessment and monitoring has improved significantly in recent decades, mainly due to growing computational modelling capacity, new proxy indices (e.g. Standardized Precipitation Index (SPI, McKee et al., 1993), Standardized Precipitation Evapo- transpiration Index (SPEI, Vicente-Serrano et al., 2010) and new data availability (e.g. high-resolution gridded or modelled data and satellite information). The contribution of proxy indices, like SPI and SPEI, allow for an indirect assessment of drought, which is a great advantage in the case of sparsity of available historical records (Russo et al., 2019). These two indices can be calculated at different time scales to monitor
* Corresponding author. Instituto Portuguˆes Do Mar e da Atmosfera, Lisboa, Portugal.
** Corresponding author.
E-mail addresses: patricia.ramos@ipma.pt (P. P´ascoa), acrusso@fc.ul.pt (A. Russo).
Contents lists available at ScienceDirect
Weather and Climate Extremes
journal homepage: http://www.elsevier.com/locate/wace
https://doi.org/10.1016/j.wace.2021.100320
Received 24 October 2020; Received in revised form 2 March 2021; Accepted 12 March 2021
Weather and Climate Extremes 32 (2021) 100320
2 droughts with respect to different useable water resources as shown by several authors (e.g. McKee et al., 1993; Vicente-Serrano et al., 2010).
This multi-scalar character is not accounted for by another widely used index, the Palmer Drought Severity Index (PDSI, (Palmer, 1965)), which also has the disadvantage of needing to be calibrated for different re- gions. Additionally, SPEI has been reported to be more suitable under increasing temperatures (Vicente-Serrano et al., 2010, 2014, 2019), and to better reproduce hydrological drought in the Iberian Peninsula (IP), when compared to SPI or PDSI (Vicente-Serrano et al., 2014, 2019).
During the last decades, the IP has experienced multiple severe droughts (Vicente-Serrano et al., 2014; Coll et al., 2016; García-Herrera et al., 2007; P´ascoa et al., 2017), which had significant impacts on the environment and on diverse economic sectors (Vicente-Serrano et al., 2011; Gouveia et al., 2012; Bifulco et al., 2014; Blauhut et al., 2015;
Kurz-Besson et al., 2016; Ribeiro et al., 2019). In the same period, the IP’s climatic conditions followed a clear trend toward dryer and warmer conditions on a great part of its territory (Martins et al., 2012; Moreira et al., 2012; P´ascoa et al., 2017; Sousa et al., 2011; Vicente-Serrano et al., 2014). The spring and winter precipitation in both countries, Portugal and Spain, has been decreasing (De Luis et al., 2010; Santo et al., 2014a) which has been accompanied by a significant and wide- spread warming, from 1976 onward (Gonzalez-Hidalgo et al., 2015;
Santo et al., 2014b). The coupled decrease of precipitation and increase of temperature, which in the last decades enhanced evapotranspiration, has been associated to the increase in drought severity in the IP (Vice- nte-Serrano et al., 2014).
The studies of the occurrence of drought in the IP have been based on the analysis of results from gridded datasets covering long periods (e.g.
Spinoni et al., 2015; P´ascoa et al., 2017; Russo et al., 2019), outputs of Regional Climate Models (RCM) (e.g. Russo et al., 2017) or data from monitoring stations (e.g. Coll et al., 2016; Vicente-Serrano et al., 2014).
While gridded coarse-resolution datasets have the problem of relying on data from a small number of stations, which is later interpolated for a regular grid (e.g. CRU and E-OBS datasets), data from sparse monitoring stations have to be homogenized and missing values have to be esti- mated. Therefore, the use of high-resolution datasets (e.g. Jerez et al., 2013; Cardoso et al., 2013), based on several times more data than most gridded datasets, has the advantage of having enough information to look into finer details of precipitation and temperature features down to the daily scale (Belo-Pereira et al., 2011; Cardoso et al., 2013; Zolina et al., 2014; Berg et al., 2016). Moreover, it can contribute highly for drought management at the local scale, as precipitation is much better represented than when using coarse resolution datasets like CRU (as in P´ascoa et al., 2017). Prior studies using high resolution precipitation for Portugal (Ribeiro and Pires, 2015) emphasized that high resolution precipitation data is essential to further improve climate simulations and e.g. hydrological applications, given the strong dependency of precipi- tation on orography and a variety of precipitation regimes in the IP (Belo-Pereira et al., 2011). Nevertheless, they used high resolution data to estimates hybrid (statistical–dynamical) long-range forecasts of the regional drought index SPI (3-months) over homogeneous regions from mainland Portugal determined by principal component analysis, which has the caveat of not considering the importance of temperature and produces an output based on the principal PC (losing the strength of using complete high resolution data). The unavoidable limitations of using gridded data, like limitations regarding complex terrain charac- terization or subscale heterogeneities, are still present in high-resolution datasets. Nevertheless, they are considerably lower compared to coarse-resolution datasets (Herrera et al., 2019b, 2020).
Recent works covering the entire IP have used gridded datasets with different spatial resolutions: P´ascoa et al. (2017) used the CRU dataset with a 0.5◦resolution; Merino et al. (2015) used precipitation data from GPCC, with a 0.25◦ resolution; and Andrade and Belo-Pereira (2015) used the datasets PT02 (Belo-Pereira et al., 2011) and Spain02 (Herrera et al., 2012), with a 0.2◦spatial resolution. Vicente-Serrano et al. (2017) developed a gridded dataset with a 1.1 km (approximately 0.01◦)
resolution and covering Spain, which was used to study drought con- ditions in Spain (Gonz´alez-Hidalgo et al., 2018). Recently, a new dataset for precipitation and temperature, Iberia01, was built for the entire IP using station data from both countries, with a spatial resolution of 0.1◦ (Herrera et al., 2019a). This new dataset encompasses all the available station data for the period 1971 to 2015 (with 3 486 and 275 stations with precipitation and temperature records, respectively). In complex topography domains, such as the IP, the station density underlying any gridded product is the main source of observational uncertainty (Kot- larski et al., 2017; Herrera et al., 2019a). Furthermore, Hofstra et al.
(2009), found that the density and quality of the underlying station data had more impact on the quality of the gridded datasets than the used interpolation technique. In this dataset, all the stations were interpo- lated together and the previous border problems in PT02 and Spain 02 were eliminated. Thus, this new dataset represents the best available gridded product to date.
It is crucial to assess the spatial and temporal variability of drought using the most up-to-date methodologies and detailed datasets. There- fore, this work aims i) to characterize the recent evolution of drought in the IP by means of two multi-scalar drought indices, SPI and SPEI, as obtained from a very high-resolution dataset; ii) to identify the long- term trends of drought duration and mean drought intensity at grid point scale for a very high-resolution dataset and iii) to assess the added- value of the Iberia01 dataset for drought monitoring in the IP, when compared to lower-resolution datasets. The following section describes the data and methods, followed by the results and discussion with the main conclusions presented in the last section.
2. Data and methods
Drought is quantified for the 1971–2015 period using two recog- nized multi-scalar drought indices, SPI and SPEI (e.g. McKee et al., 1993;
Vicente-Serrano et al., 2010; Beguería et al., 2014; Coll et al., 2016;
Spinoni et al., 2017). Both SPI and SPEI allow for the quantification of several drought properties (e.g. intensity, magnitude, duration and affected area) based on the objective identification of the beginning and end of drought episodes (McKee et al., 1993; Vicente-Serrano et al., 2010, 2014). The main difference between these two indices is related to the fact that SPEI encompasses both precipitation and evaporative de- mand (Beguería et al., 2014; Vicente-Serrano et al., 2010), whereas SPI is computed using only precipitation (McKee et al., 1993).
SPI and SPEI were computed based on the new and high-resolution regular gridded dataset proposed by Herrera et al. (2019a). This daily dataset, Iberia01, includes maximum and minimum temperatures, and precipitation values at 0.1◦spatial resolution. It covers uniformly the IP, and includes the largest amount of station observations comparatively to other studies: 276 for temperature and 3 481 for precipitation. The daily time series were converted to monthly values of precipitation and temperature. In addition, the same meteorological variables were retrieved from the CRU TS4.03 database (Harris et al., 2020) and used to compute SPI and SPEI in the same period. This dataset has a spatial resolution of 0.5◦ and covers the period 1901–2018. The use of this lower-resolution dataset allowed to assess the added-value of the Ibe- ria01 dataset.
The first step to the computation of SPEI is the estimation of the reference evapotranspiration (ET0). There is a panoply of available methods to estimate ET0, namely the Hargreaves (Hargreaves and Samani, 1985), the Thornthwaite (1948) or the Penman-Monteith (Allen et al., 1998) methods. The advantage of using the Hargreaves or the Thornthwaite methods, comparatively to the Penman-Monteith approach, is that those have limited data requirements, as only tem- perature and latitude data are necessary. Nonetheless, the Hargreaves and Penman-Monteith methods are known to similarly estimate ET0 on a monthly and annual scale in the IP (Droogers and Allen, 2002), and SPEI computed with these two methods present a high correlation (Beguería et al., 2014). Therefore, the ET0 used in the present work for the P. P´ascoa et al.
calculation of SPEI was computed with the Hargreaves method.
The distributions functions to be used on the computation of SPI and SPEI were previously tested by several authors (Vicente-Serrano et al., 2010; Angelidis et al., 2012; Vicente-Serrano and Beguería, 2015).
Following their suggestions, SPI was computed using a Gamma distri- bution to model precipitation, whereas SPEI was computed using a Log-logistic distribution to model the water deficit (Vicente-Serrano et al., 2010; Beguería et al., 2014; P´ascoa et al., 2017; Russo et al., 2019). SPI and SPEI were calculated for several timescales (1-, 3-, 6-, and 12- months).
The existence of significant trends in both SPI and SPEI was assessed based on the application of the modified Mann-Kendall test (Hamed and Ramachandra Rao, 1998), which takes into account the presence of outliers and/or autocorrelation in the analysed time series. The level of significance considered was 5%, and the slope of the trend was
computed using the Theil-Sen method (Theil, 1950; Sen, 1968).
Time series of drought duration and mean intensity of the drought events were computed for each grid point of the IP based on SPI and SPEI, excluding drought events that lasted only one month (Spinoni et al., 2015; P´ascoa et al., 2017). These parameters are defined as pro- posed by McKee et al. (1993). The trends of these time series were also assessed, using the Spearman-Rho test, provided that the time series had a minimum of 20 points (Lanzante, 1996; P´ascoa et al., 2017). Following Agnew (2000), drought conditions were identified when SPI or SPEI was lower than − 0.84, which corresponds to a probability of occurrence of 20%. Finally, the area affected by drought (%) was also determined for each month, regardless of the intensity, and the results obtained with each index were compared.
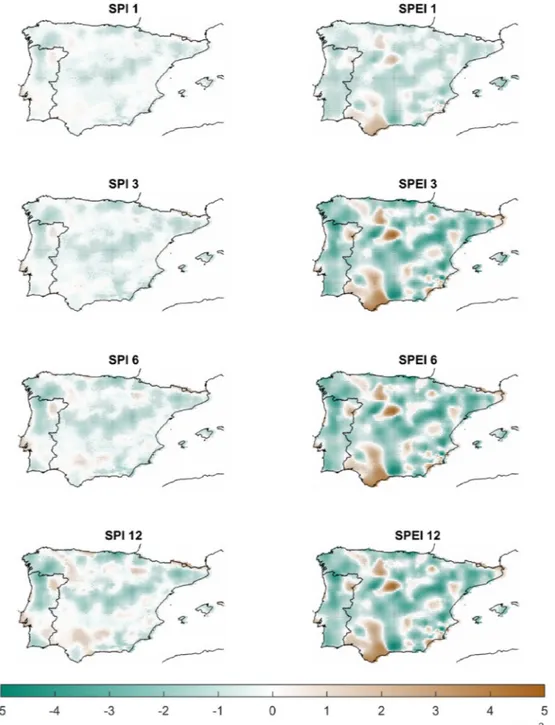
Fig. 1. Spatial patterns of trends in the period 1971–2015 for SPIIB01 (left) and SPEIIB01 (right) for the 1-, 3-, 6-, and 12-months timescales. The slope of the trend shown was computed for the entire period. Statistically significant trends (at the 5% level) are indicated with a dot.
Weather and Climate Extremes 32 (2021) 100320
4 3. Results and discussion
The trends of the drought indices computed with the Iberia01 dataset (SPIIB01 and SPEIIB01) in the period 1971–2015 are shown on Fig. 1, and the results for the indices computed with the CRU TS4.03 dataset (SPI-
CRU and SPEICRU) are shown on Fig. 2 for time scales of 1–12 months.
Both SPIIB01 and SPEIIB01 (Fig. 1) present significant trends on all time scales, and the trends are mostly negative, indicative of increased drying conditions in the period 1975–2015. The area of SPEI trends is generally larger due to the regional warming effect. Nonetheless, large areas of positive trends are present in the South of Spain, and some smaller areas are scattered across the territory. The spatial patterns show that significant trends are more frequent on the case of SPEIIB01 (Fig. 1, right panel), but the spatial occurrence of positive/negative trends ob- tained with both indices is similar, especially for longer time scales. Two areas showing opposite signs are present: in the South of Spain, where SPIIB01 shows negative trends, and in the Southeast of Portugal, where
SPIIB01 presents a positive trend (Fig. 1, left panel). The area of signifi- cant trends also increases with the time scale, probably due to the lower variability at longer time scales, which reflects the time needed for water deficits to accumulate, but the patterns of negative and positive trends are not affected.
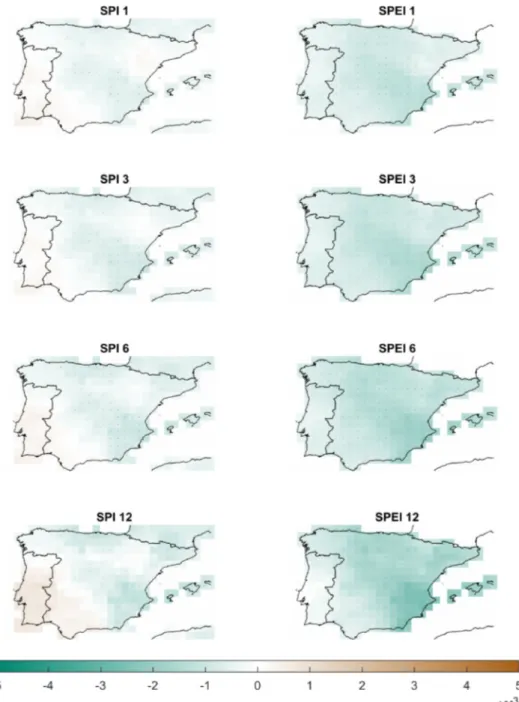
The trends obtained for SPICRU and SPEICRU (Fig. 2) also point to increased drying conditions, particularly SPEICRU, which does not pre- sent positive trends. On the other hand, SPICRU points to wetting con- ditions in the West, with trends significant at the longest time scale.
Although negative, the trends obtained by SPEICRU in this region are actually not significant, reflecting the increase in precipitation observed with SPICRU.
The drying conditions here identified are in agreement with previous works made for the IP (Ruiz-Sinoga et al., 2011; Vicente-Serrano et al., 2014; P´ascoa et al., 2017). In this territory, both precipitation and temperature are known to be drivers of drought (Vicente-Serrano et al., 2014, 2015; Spinoni et al., 2019), and for this reason, SPEIIB01 presents a
Fig. 2. Spatial patterns of trends in the period 1971–2015 for SPICRU (left) and SPEICRU (right) for the 1-, 3-, 6-, and 12-months timescales. The slope of the trend shown was computed for the entire period. Statistically significant trends (at the 5% level) are indicated with a dot.
P. P´ascoa et al.
larger area of significant negative trends. The drought conditions assessed with SPI in the IP generally present both negative and positive trends (Vicente-Serrano et al., 2014; P´ascoa et al., 2017), reflecting the complex patterns of precipitation trends (Becker et al., 2013; Coll et al., 2016; P´ascoa et al., 2017; Lausier and Jain, 2018). This is shown by SPIIB01, due to the high number of stations used to obtain the Iberia01 dataset (Herrera et al., 2019a). Nonetheless, the results obtained here with SPIIB01 and SPICRU point to a larger area of negative trends than in previous works, likely due to the dry conditions observed in the years 2011, 2012, and 2015 (Trigo et al., 2013a; Blunden and Arndt, 2016), which were not all included in the shorter periods analysed by these authors.
Both SPIIB01 and SPEIIB01 present a large area of significant positive trends in the South of the IP. Positive annual and seasonal precipitation trends have already been identified in this area (Coll et al., 2016; P´ascoa et al., 2017), but when including the temperature effect, the results have so far suggested a drying trend (Vicente-Serrano et al., 2014; Coll et al., 2016; P´ascoa et al., 2017). Considering that positive trends are identi- fied with SPEIIB01 even in areas where SPIIB01 points to negative trends, the drivers of these wetting trends are undoubtedly negative tempera- ture trends. In fact, the trends in annual precipitation and ET0, as ob- tained from the Iberia01 dataset (Fig. S1), show very similar patterns to those obtained by SPIIB01 and SPEIIB01, respectively. The wetting trends are in disagreement not only with the trends obtained with SPEICRU, but also with previous works that show that monthly temperature is either increasing or does not show a significant trend (Del Río et al., 2011;
Gonzalez-Hidalgo et al., 2015). Atmospheric evaporative demand has also been shown to be increasing (Vicente-Serrano et al., 2014; P´ascoa et al., 2017), driven by the increase in temperature trends (Vice- nte-Serrano et al., 2014). The wetting trends obtained are driven by a decrease in maximum temperature, observed on some months (Fig. S4).
The stations used to compute the temperature dataset used in the present
work had a much lower density when compared to the precipitation dataset, and in this region (south of Spain), the number of stations with temperature data is very low. It is likely that some stations are showing decreased temperature trends, but the area actually showing the same behaviour is probably smaller than the area obtained here. On the other hand, the positive trends identified in North Spain and Northeast Portugal may be driven by both an increase in precipitation, as shown by increase in SPI, as well as a decrease in temperature (Fig. S4). Unlike the South of Spain, these areas have a high number of temperature stations, which are located at different elevations. Moreover, Moratiel et al.
(2017) found negative trends in annual and seasonal temperature ob- tained from weather stations near these areas, for the period 1981–2010.
Although most of the negative trends are not significant, they are sta- tistically significant in Autumn (Moratiel et al., 2017). The results ob- tained here may be reflecting the influence of elevation on the climate variables, which is possible to achieve with due to its high spatial resolution.
Figs. 3 and 4 present the trends obtained for the time series of drought duration, and the mean intensity of the drought events, as ob- tained with SPIIB01 and SPEIIB01 (Fig. 3), and with SPICRU and SPEICRU
(Fig. 4). The area of positive and negative significant trends obtained for each time series and drought index is presented on Table 1.
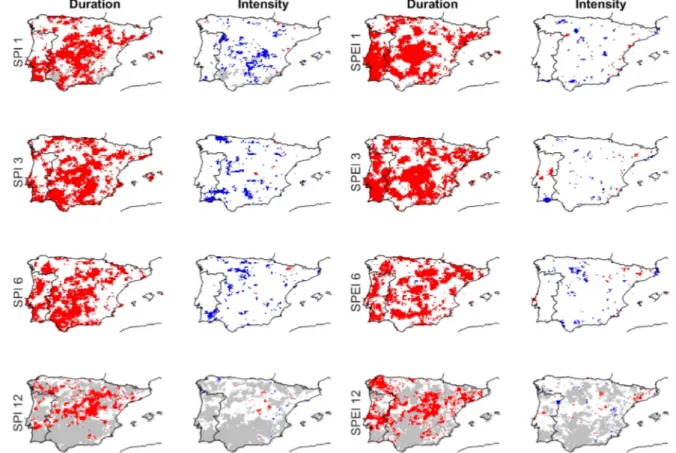
The trends of drought duration are clearly positive in most of the territory, as obtained with both indices and the two datasets. The trends in drought duration are not significant in the areas where positive drought trends were identified with the Iberia01 dataset (Fig. 1).
Nonetheless, when computed with the CRU dataset, the area is larger for SPEI and smaller for SPI, compared to the Iberia01 dataset, as shown on Table 1. As with the trends in the drought indices (Figs. 1 and 2), the higher number of stations used in the Iberia01 dataset may explain these differences. Despite already showing similar results, on previous works these positive trends occurred on much smaller areas (Spinoni et al.,
Fig. 3. Significant trends in duration and mean intensity of droughts based on SPIIB01 (left) and SPEIIB01 (right). Positive (negative) trends are shown in red (blue) and non-significant trends are shown in white. Grid points where the time series has less than 20 points are shown in grey. (For interpretation of the references to colour in this figure legend, the reader is referred to the Web version of this article.)
Weather and Climate Extremes 32 (2021) 100320
6 2014; Pascoa et al., 2017), although different periods and thresholds ´ were used to identify drought. On the other hand, the sign of the trends of the mean intensity of the drought events is almost always negative.
The area is smaller when SPEI is used, reflecting the effect of the increased ET0.
Taking into account that Iberia01 better represents the spatial pattern of drought in the IP than low resolution datasets, the area under drought conditions was calculated with SPIIB01 and SPEIIB01 (Fig. 5).
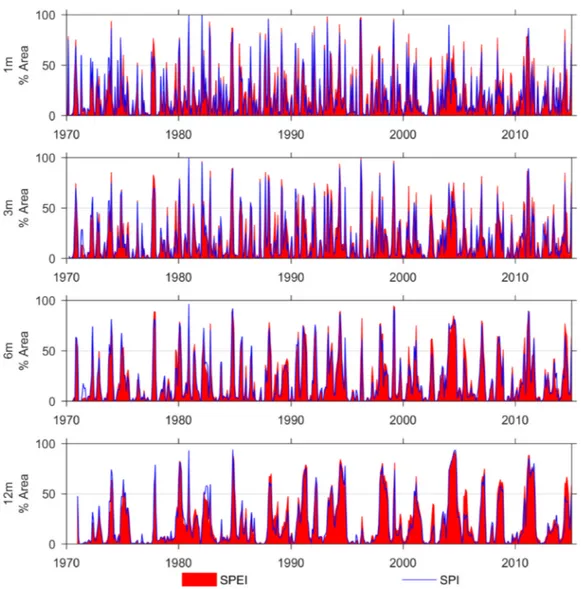
According to these results, drought events affecting more than half of the territory are frequent. Considering the mean area of the entire period, SPEI identifies a slightly larger area under drought conditions (Fig. 5).
Nonetheless, the mean areas presented by SPEI and SPI (22% and 19%, respectively), are very close to the theoretical probability of occurrence (20%, Agnew, 2000). The extreme drought event of 2004/05 stands out for its extent and duration, but other large events are also apparent, such
as the drought of 2012. This hydrological year presented the second lowest accumulated precipitation in the period 1950–2012, only outdone by the extreme drought of 2004/5 (Trigo et al., 2013b). There are also long periods of low values of area under drought conditions obtained for the late 1970’s and the mid 1990’s pointing to the absence of drought conditions. The results obtained for the area affected by drought are in agreement with previous works made for the IP (Vice- nte-Serrano et al., 2014; Coll et al., 2016; P´ascoa et al., 2017), although time scales shorter than 12 months were not used in these previous studies. The correct identification of the extent of the drought events is a strong indicator of the quality of the dataset, suggesting that the issue already identified was constrained to some regions only.
Previous works identified the fragility of the development of high- resolution grids with few or none stations per grid point (Herrera et al., 2019b). This was accounted for when developing the Iberia01 Fig. 4. As Fig. 3 but for SPICRU and SPEICRU.
Table 1
Area (%) of positive and negative significant trends, and not-accounted (NA) points obtained for drought duration and drought intensity.
Duration Intensity
Time Scale Positive Negative NA Positive Negative NA
SPIIB01 1 36.4 – 5.2 0.4 7.4 5.2
3 43.9 – 0.3 0.3 7.8 0.3
6 37.9 – 0.2 0.4 6.1 0.2
12 16.9 – 54.2 0.7 0.6 54.2
SPEIIB01 1 45.0 0.0 0.3 0.8 2.7 0.3
3 50.3 0.0 0.2 1.2 2.0 0.2
6 36.4 0.1 0.7 1.2 3.0 0.8
12 23.9 0.1 42.6 1.4 0.8 42.6
SPICRU 1 29.5 0.3 0.3 – 16.1 0.3
3 25.3 – 0.3 – 20.2 0.3
6 28.4 – – – 19.5 –
12 21.9 – 53.4 – 2.1 53.4
SPEICRU 1 52.7 – – – 1.4 –
3 57.9 – – – 1.7 –
6 47.6 – – – 2.4 –
12 43.2 – 21.58 – 1.0 21.6
P. P´ascoa et al.
dataset through the limitation of the horizontal resolution, and the au- thors did not provide higher-resolution intermediate products (Herrera et al., 2019a). Nevertheless, for an illustrative example of a convective high-resolution extreme precipitation event that occurred on 4–5 November 1997, characterized by heavy precipitation over most of the IP, Iberia01 was able to correctly represent the spatial patterns, with the main differences appearing in the Guadalquivir and Guadiana basins and the Pyrenean range (Herrera et al., 2019a).
Iberia01 has also much improved precipitation rendering compared to other datasets (Herrera et al., 2019a), which propagates to the calculation of SPEI and SPI. Nevertheless, it should be accounted that in the case of temperature, the number of used stations is not substantially different from other datasets. Therefore, the major differences between SPEI and SPI identified in the south region might be associated to the fact that the number of stations which monitor temperature are low. On the northern region, like in the Pyrenean range, deficient representation of orographic precipitation might be the cause.
4. Conclusions
In this work, recent drought trends in the IP were analysed, using two known drought indices, SPI and SPEI. A recently developed high- resolution dataset, Iberia01, and a lower-resolution dataset, CRU, were used to compute these indices, and the results obtained were compared, in order to assess the added value of the new dataset, Iberia01.
A drying trend was observed when using both datasets. This trend was driven by both precipitation and temperature, as evident by the negative trends of both indices, as well as the positive trends of drought duration. The Iberia01 dataset made evident complex spatial patterns of drought trends, which were mostly related to precipitation trends. In some areas, positive trends were identified due to a decrease in tem- perature, although the number of stations used in these areas is rather small.
Although in agreement with previous studies performed for the IP, the results presented here also constitute the first evaluation of a high- resolution gridded dataset, showing a regional focus over the IP, which is a climate change hot spot in the Mediterranean region. Iberia01 has the advantage of having been built based on several times more data than most gridded datasets and also of having a much better orographic representation, which allows for a more detailed analysis of precipita- tion and temperature and resultant products (e.g. SPEI and SPI). This is of high importance in the case of the analysis of regional phenomena such as droughts. The introduction of these type of high-resolution datasets contributes deeply to a more detailed understanding of drought and its impacts.
The results concerning the identification of regions over the IP that showed a clear pattern of increased dryness will surely be useful, sup- plying managers with robust tools aiming for the development of miti- gation plans that will be crucial in the case of the occurrence of more frequent drought events over the IP within a context of climate change.
Fig. 5. Percentage of area under drought conditions (SPEI or SPI <−0.84), as obtained with the Iberia01 dataset.
Weather and Climate Extremes 32 (2021) 100320
8 Authors’ contribution
PP, AR, CMG, PMMS, and AFSR participated in the conceptual design of the study, the interpretation, and the redaction of the manuscript.
RMC and PMMS defined the meteorological datasets to be used for the study. PP, AR, CMG, and PMMS defined the approach used for the meteorological analysis. AR calculated the meteorological indices, and PP, AR, and JAMC calculated the remaining drought parameters and trends. Each of the co-authors performed a thorough revision of the manuscript, provided useful advices on the intellectual content and improved the English language.
Declaration of competing interest
The authors declare that they have no known competing financial interests or personal relationships that could have appeared to influence the work reported in this paper.
Acknowledgements
This work was partially supported by national funds through FCT (Fundaç˜ao para a Ciˆencia e a Tecnologia, Portugal) through project IMPECAF (PTDC/CTA − CLI/28902/2017), and project SOLAR (PTDC/
GEOMET/7078/2014). All authors are grateful for the FCT funding UIDB/50019/2020 - Instituto Dom Luiz. Supporting information that may be useful in reproducing the authors’ work is available from the authors upon request (acrusso@fc.ul.pt).
Appendix A. Supplementary data
Supplementary data to this article can be found online at https://doi.
org/10.1016/j.wace.2021.100320.
References
Agnew, C.T., 2000. Using the SPI to identify drought. Drought Network News 12, 6–12.
Allen, R., Pereira, L., Raes, D., Smith, M., 1998. Crop Evapotranspiration: Guidelines for Computing Crop Requirements. FAO Irrigation and Drainage paper 56.
Andrade, C., Belo-Pereira, M., 2015. Assessment of droughts in the Iberian Peninsula using the wasp-index. Atmos. Sci. Lett. 16 (3), 208–218. https://doi.org/10.1002/
asl2.542.
Angelidis, P., Maris, F., Kotsovinos, N., Hrissanthou, V., 2012. Computation of drought index SPI with alternative distribution functions. Water Resour. Manag. 26, 2453–2473. https://doi.org/10.1007/s11269-012-0026-0.
Becker, Q., Finger, P., Meyer-Christoffer, A., Rudolf, B., Schamm, K., et al., 2013.
A description of the global land-surface precipitation data products of the global precipitation climatology centre with sample applications including centennial (trend) analysis from 1901–present. Earth Syst. Sci. Data 5 (1), 71–99. https://doi.
org/10.5194/essd-5-71-2013.
Beguería, S., Vicente-Serrano, S.M., Reig, F., Latorre, B., 2014. Standardized precipitation evapotranspiration index (SPEI) revisited: parameter fitting, evapotranspiration models, tools, datasets and drought monitoring. Int. J. Climatol.
34 (10), 3001–3023. https://doi.org/10.1002/joc.3887.
Belo-Pereira, M., Dutra, E., Viterbo, P., 2011. Evaluation of global precipitation data sets over the Iberian Peninsula. J. Geophys. Res. Atmos. https://doi.org/10.1029/
2010JD015481.
Berg, P., Norin, L., Olsson, J., 2016. Creation of a high resolution precipitation data set by merging gridded gauge data and radar observations for Sweden. J. Hydrol. 541, 6–13. https://doi.org/10.1016/j.jhydrol.2015.11.031.
Bifulco, C., Rego, F., Dias, S., Stagge, J.H., 2014. Assessing the association of drought indicators to impacts: the results for areas burned by wildfires in Portugal. Advances in forest fire research 1054–1060. https://doi.org/10.14195/978-989-26-0884-6_
115.
Blauhut, V., Gudmundsson, L., Stahl, K., 2015. Towards pan-European drought risk maps: quantifying the link between drought indices and reported drought impacts.
Environ. Res. Lett. 10, 014008 https://doi.org/10.1088/1748-9326/10/1/014008.
Blunden, J., Arndt, D., 2016. State of the climate in 2015. Bull. Am. Meteorol. Soc. 97, S1–S275. https://doi.org/10.1175/2016BAMSStateoftheClimate.1.
Cardoso, R.M., Soares, P.M.M., Miranda, P.M.A., Belo-Pereira, M., 2013. WRF high resolution simulation of Iberian mean and extreme precipitation climate. Int. J.
Climatol. 33 (11), 2591–2608. https://doi.org/10.1002/joc.3616.
Coll, J.R., Aguilar, E., Ashcroft, L., 2016. Drought variability and change across the iberian peninsula. Theor. Appl. Climatol. 1–16. https://doi.org/10.1007/s00704- 016-1926-3.
Dai, A., 2011. Drought under Global Warming: A Review. ISSN 17577799.
De Luis, M., Brunetti, M., Gonzalez-Hidalgo, J., Longares, L., Martin-Vide, J., 2010.
J. Changes in seasonal precipitation in the Iberian Peninsula during 1946–2005.
Global Planet. Change 74, 27–33. https://doi.org/10.1016/j.gloplacha.2010.06.006.
Del Río, S., Herrero, L., Pinto-Gomes, C., Penas, A., 2011. Spatial analysis of mean temperature trends in Spain over the period 1961–2006. Global Planet. Change 78 (1), 65–75. https://doi.org/10.1016/j.gloplacha.2011.05.012.
Droogers, P., Allen, R., 2002. Estimating reference evapotranspiration under inaccurate data conditions. Irrigat. Drain. Syst. 16, 33–45. https://doi.org/10.1023/A:
1015508322413.
García-Herrera, R., Hern´andez, E., Barriopedro, D., Paredes, D., Trigo, R.M., et al., 2007.
The outstanding 2004/05 drought in the iberian peninsula: associated atmospheric circulation. J. Hydrometeorol. 8 (3), 483–498. https://doi.org/10.1175/JHM578.1.
Gonzalez-Hidalgo, J.C., Pe˜na-Angulo, D., Brunetti, M., Motedas, Cortesi N., 2015. A new monthly temperature database for mainland Spain and the trend in temperature (1951-2010). Int. J. Climatol. https://doi.org/10.1002/joc.4298.
Gonz´alez-Hidalgo, J.C., Vicente-Serrano, S.M., Pe˜na-Angulo, D., Salinas, C., Tomas- Burguera, M., Beguería, S., 2018. High-resolution spatio-temporal analyses of drought episodes in the western Mediterranean basin (Spanish mainland, Iberian peninsula). Acta Geophys. 66 (3), 381–392. https://doi.org/10.1007/s11600-018- 0138-x.
Gouveia, C.M., Bastos, A., Trigo, R.M., Dacamara, C.C., 2012. Drought impacts on vegetation in the pre- and post-fire events over Iberian Peninsula. Nat. Hazards Earth Syst. Sci. 12 (10), 3123–3137. https://doi.org/10.5194/nhess-12-3123-2012.
Hamed, K., Ramachandra Rao, A., 1998. A modified Mann-Kendall trend test for autocorrelated data. J. Hydrol. 204, 182–196. https://doi.org/10.1016/S0022-1694 (97)00125-X.
Hargreaves, G., Samani, Z., 1985. Reference crop evapotranspiration from temperature.
Appl. Eng. Agric. 1, 96–99.
Harris, I., Osborn, T.J., Jones, P., Lister, D., 2020. Version 4 of the CRU TS monthly high- resolution gridded multivariate climate dataset. Scientific Data 7 (109). https://doi.
org/10.6084/m9.figshare.11980500.
Herrera, S., Guti´errez, J.M., Ancell, R., Pons, M.R., Frías, M.D., Fern´andez, J., 2012.
Development and analysis of a 50-year high-resolution daily gridded precipitation dataset over Spain (Spain02). Int. J. Climatol. 32 (1), 74–85. https://doi.org/
10.1002/joc.2256.
Herrera, S., Cardoso, R.M., Soares, P.M.M., Espírito-Santo, F., Viterbo, P., Guti´errez, J.M., 2019a. Iberia01: a new gridded dataset of daily precipitation and temperatures over Iberia. Earth Syst. Sci. Data 11, 1947–1956. https://doi.org/10.5194/essd-2019-95.
Herrera, S., Kotlarski, S., Soares, P.M.M., Cardoso Jaczewski, A., et al., 2019b.
Uncertainty in gridded precipitation products: influence of station density, interpolation method and grid resolution. Int. J. Climatol. 39, 3717–3729. https://
doi.org/10.1002/joc.5878.
Herrera, S., Soares, P.M.M., Cardoso, R.M., Guti´errez, J.M., 2020. Evaluation of the EURO-CORDEX regional climate models over the Iberian Peninsula: observational uncertainty analysis. J. Geophys. Res. Atmos. 125 (12) https://doi.org/10.1029/
2020JD032880 e2020JD032880.
Hofstra, N., Haylock, M., New, M., Jones, P.D., 2009. Testing E-OBS European high- resolution gridded data set of daily precipitation and surface temperature.
J. Geophys. Res. 114, D21101. https://doi.org/10.1029/2009JD011799.
IPCC, 2014. Climate Change 2014: Mitigation of Climate Change. Contribution of Working Group III to the Fifth Assessment, Report of the Intergovernmental Panel on Climate Change.
Jerez, S., Montavez, J., Jimenez-Guerrero, P., Gomez-Navarro, J., Lorente, R., Zorita, E., 2013. A multi-physics ensemble of present-day climate regional simulations over the Iberian Peninsula. Clim. Dynam. 40, 3023–3046. https://doi.org/10.1007/s00382- 012-1539-1.
Kotlarski, S., Szab´o, P., Herrera, S., R¨aty, O., Keuler, K., et al., 2017. Observational uncertainty and regional climate model evaluation: a pan-European perspective. Int.
J. Climatol. 39, 3730–3749. https://doi.org/10.1002/joc.5249.
Kurz-Besson, C., Lousada, J., Gaspar, M., Correia, I., David, T., Soares, P., et al., 2016.
Effects of recent minimum temperature and water deficit increases on Pinus pinaster radial growth and wood density in southern Portugal. Front. Plant Sci. 7 https://doi.
org/10.3389/fpls.2016.01170.
Lanzante, J.R., 1996. Resistant, robust and non-parametric techniques for the analysis of climate data: theory and examples, including applications to historical radiosonde station data. Int. J. Climatol. 16, 1197–1226. https://doi.org/10.1002/(SICI)1097- 0088(199611)16:11<1197::AID-JOC89>3.0.CO;2-L.
Lausier, A., Jain, S., 2018. Overlooked trends in observed global annual precipitation reveal underestimated risks. Sci Rep-UK 8, 12. https://doi.org/10.1038/s41598- 018-34993-5.
Lloyd-Hughes, A., Aug 2014. The impracticality of a universal drought definition. Theor.
Appl. Climatol. 117 (3), 607–611. https://doi.org/10.1007/s00704-013-1025-7.
ISSN 1434-4483.
Martins, D.S., Raziei, T., Paulo, A.A., Pereira, L.S., 2012. Spatial and temporal variability of precipitation and drought in Portugal. Nat Hazard Earth Sys 12 (5), 1493–1501.
https://doi.org/10.5194/nhess-12-1493-2012.
McKee, T., Doesken, J., Kleist, J., 1993. The relationship of drought frequency and duration to time scales. Eight Conference on Applied Climatology 179–184.
Merino, A., L´opez, L., Hermida, L., S´anchez, J.L., García-Ortega, E., et al., 2015.
Identification of drought phases in a 110-year record from western Mediterranean basin: trends, anomalies and periodicity analysis for Iberian Peninsula. Global Planet. Change 133, 96–108. https://doi.org/10.1016/j.gloplacha.2015.08.007.
Moratiel, R., Soriano, B., Centeno, A., Spano, D., Snyder, R.L., 2017. Wet-bulb, dew point, and air temperature trends in Spain. Theor. Appl. Climatol. 130, 419–434.
https://doi.org/10.1007/s00704-016-1891-x.
P. P´ascoa et al.
Moreira, E.E., Mexia, J.T., Pereira, L.S., 2012. Are drought occurrence and severity aggravating? A study on SPI drought class transitions using log-linear models and ANOVA-like inference. Hydrol. Earth Syst. Sci. 16 (8), 3011–3028. https://doi.org/
10.5194/hess-16-3011-2012.
Palmer, W.C., 1965. Meteorological Drought. Research Paper NO. 45.
P´ascoa, P., Gouveia, C., Russo, A., Trigo, R., 2017. Drought trends in the Iberian Peninsula over the last 112 years. Adv Meteorol 2017. https://doi.org/10.1155/
2017/4653126.
Ribeiro, A.F.S., Pires, C.A.L., 2015. Seasonal drought predictability in Portugal using statistical-dynamical techniques. Phys. Chem. Earth 94, 155–166. https://doi.org/
10.1016/j.pce.2015.04.003.
Ribeiro, A.F.S., Russo, A., Gouveia, C.M., P´ascoa, P., 2019. Copula-based agricultural drought risk of rainfed cropping systems. Agric. Water Manag. 223 https://doi.org/
10.1016/j.agwat.2019.105689.
Ruiz-Sinoga, J.D., García-Marín, R., Martinez-Murillo, J.F., Gabarron-Galeote, M.A., 2011. Precipitation dynamics in southern Spain: trends and cycles. Int. J. Climatol.
31 (15), 2281–2289. https://doi.org/10.1002/joc.2235.
Russo, A., Gouveia, C.M., Pascoa DaCamara, C.C., Sousa, P.M., Trigo, R.M., 2017. ´ Assessing the role of drought events on wildfires in the Iberian Peninsula. Agric. For.
Meteorol. 237–238, 50–59. https://doi.org/10.1016/j.agrformet.2017.01.021.
Russo, A., Gouveia, C.M., Dutra, E., Soares, P.M., Trigo, R.M., 2019. The synergy between drought and extremely hot summers in the Mediterranean. Environ. Res.
Lett. 14 (1) https://doi.org/10.1088/1748-9326/aaf09e.
Santo, F., Ramos, A., de Lima, M., Trigo, R., 2014a. Seasonal changes in daily precipitation extremes in mainland Portugal from 1941 to 2007. Reg. Environ.
Change 14, 1765–1788. https://doi.org/10.1007/s10113-013-0515-6.
Santo, F., de Lima, M., Ramos, A., Trigo, R., 2014b. Trends in seasonal surface air temperature in mainland Portugal, since 1941. Int. J. Climatol. 34, 1814–1837.
https://doi.org/10.1002/joc.3803.
Schubert, S.D., Stewart, R.E., Wang, H., Barlow Berbery, E.H., et al., 2016. Global meteorological drought: a synthesis of current understanding with a focus on SST drivers of precipitation deficits. J. Clim. https://doi.org/10.1175/JCLI-D-15-0452.1.
Sen, O.K., 1968. Estimates of the regression coefficient based on Kendall’s tau. J. Am.
Stat. Assoc. 63, 1379–1389.
Sousa, P.M., Trigo, R.M., Aizpurua, P., Nieto, R., Gimeno, L., Garcia-Herrera, R., 2011.
Trends and extremes of drought indices throughout the 20th century in the Mediterranean. Nat Hazard Earth Sys 11 (1), 33–51. https://doi.org/10.5194/nhess- 11-33-2011.
Spinoni, J., Naumann, G., Carrao, H., Barbosa, P., Vogt, J., 2014. World drought frequency, duration, and severity for 1951-2010. Int. J. Climatol. https://doi.org/
10.1002/joc.3875.
Spinoni, J., Naumann, G., Vogt, J.V., Barbosa, P., 2015. The biggest drought events in Europe from 1950 to 2012. J Hydrol Reg Stud 3, 509–524. https://doi.org/10.1016/
j.ejrh.2015.01.001.
Spinoni, J., Naumann, G., Vogt, J.V., 2017. Pan-European seasonal trends and recent changes of drought frequency and severity. Global Planet. Change 148, 113–130.
https://doi.org/10.1016/j.gloplacha.2016.11.013.
Spinoni, J., Barbosa, P., Jager, A.D., McCormick, N., Naumann, G., et al., 2019. A new global database of meteorological drought events from 1951 to 2016. J Hydrol Reg Stud 22, 100593. https://doi.org/10.1016/j.ejrh.2019.100593.
Theil, H., 1950. A rank-invariant method of linear and polynomial regression analysis.
Proc. R. Neth. Acad. Arts Sci. 53 (Part I), 386–392. Part II: 521-525, Part III: 1397- 1412.
Thornthwaite, C., 1948. An approach toward a rational classification of climate. Geogr.
Rev. 38 (55–94).
Trigo, R., Barriopedro, D., Ramos, A.M., Parker, D., Mühr, B., et al., 2013a. Iberia, in state of the climate in 2012. Bull. Am. Meteorol. Soc. 94, S176–S178. https://doi.
org/10.1175/2013BAMSStateoftheClimate.1.
Trigo, R., A˜nel, J., Barriopedro, D., García-Herrera, R., Gimeno, L., et al., 2013b. The record winter drought of 2011-12 in the iberian peninsula, in Explaining Extreme Events of 2012 from a Climate Perspective. Bull. Am. Meteorol. Soc. 94, S41–S45.
https://doi.org/10.1175/BAMS-D-13-00085.1.
Vicente-Serrano, S.M., Beguería, S., Lopez-Moreno, J.I., 2010. A multiscalar drought ´ index sensitive to global warming: the standardized precipitation evapotranspiration index. J. Clim. 23 (7), 1696–1718. https://doi.org/10.1175/2009JCLI2909.1.
Vicente-Serrano, S.M., L´opez-Moreno, J.I., Drumond, A., Gimeno, L., Nieto, R., et al., 2011. Effects of warming processes on droughts and water resources in the NW Iberian Peninsula (1930-2006). Clim. Res. 48 (2–3), 203–212. https://doi.org/
10.3354/cr01002.
Vicente-Serrano, S.M., L´opez-Moreno, J.I., Beguería, S., Lorenzo-Lacruz, J., Sanchez- Lorenzo, J.M., 2014. Evidence of increasing drought severity caused by temperature rise in southern Europe. Environ. Res. Lett. 9 (4), 044001 https://doi.org/10.1088/
1748-9326/9/4/044001.
Vicente-Serrano, S.M., der Schrier, G.V., Beguería, S., Azorin-Molina, C., Lopez- Moreno, J.I., 2015. Contribution of precipitation and reference evapotranspiration to drought indices under different climates. J. Hydrol. 526, 42–54. https://doi.org/
10.1016/j.jhydrol.2014.11.025.
Vicente-Serrano, S.M., Tomas-Burguera, M., Beguería, S., Reig, F., Latorre, B., et al., 2017. A high resolution dataset of drought indices for Spain. Data 2 (3). https://doi.
org/10.3390/data2030022, 22, Jun.
Vicente-Serrano, S.M., Quiring, S.M., Pe˜na-Gallardo, M., Yuan, S., Domínguez-Castro, 2019. A review of environmental droughts: increased risk under global warming?
Earth Sci. Rev. 102953. https://doi.org/10.1016/j.earscirev.2019.102953.
Wilhite, D., Svoboda, M., Hayes, M., 2007. Understanding the complex impacts of drought: a key to enhancing drought mitigation and preparedness. Water Resour.
Manag. 21 (5), 763–774. https://doi.org/10.1007/s11269-006-9076-5.
Zolina, O., Simmer, C., Kapala, A., Shabanov, P., Becker, P., et al., 2014. Precipitation variability and extremes in central Europe: new view from STAMMEX results. Bull.
Am. Meteorol. Soc. 95 (7), 995–1002. https://doi.org/10.1175/BAMS-D-12- 00134.1.