ABOUT THIS PUBLICATION
“Energy and Poverty” is Chapter 13 of the International Energy Agency’s World Energy Outlook 2002 to be released at the Ministerial Meeting of the Consumer-Producer Dialogue (International Energy Forum) in Osaka, Japan on 21 September. Since energy poverty is a key topic at the World Summit on Sustainable Development meeting in Johannesburg, IEA Member countries decided to make this study available in advance.
The chapter includes new, country-by-country data on electrification rates worldwide and provides regional projections to 2030. It also includes estimates on the use of traditional biomass energy sources in developing countries over the same period. The chapter sets out a quantitative framework for poverty alleviation strategies.
This study, as well as the full book from which it is taken, was prepared by the IEA’s Economic Analysis Division. It benefited from comments from many institutions/experts: African Energy Policy Research Network, Stephen Karakezi, Kenya; Asian Development Bank, Carol Litwin, Philippines; Department for International Development, Gill Wilkins, United Kingdom; Electricité de France, François Verneyre and Prabodh Porouchottamin, France; European Commission Development Directorate-General, Philip Mann, Belgium;Kumasi Institute of Technology and Environment, Abeeku Brew-Hammond, Ghana; German Advisory Council on Global Change to the Federal Government, Marc Ringel, Germany; Development Centre and Secretary-General’s Advisory Unit, Organisation for Economic Co-operation and Development, France; Tata Energy Research Institute, Rajendra Pachauri, India; United Nations Environment Program, Lawrence Agbemabiese, France; United Nations Food and Agriculture Organization, Gustavo Best, Miguel Trossero and Adrian Whiteman, Italy; World Bank, Jamal Saghir and Dominique Lallement, United States.
All errors and omissions are solely the responsibility of the IEA.
CHAPTER 13
ENERGY AND POVERTY
This chapter analyses the relationship between energy use and poverty in developing countries. It describes current patterns of energy use, including rates of electrification. A unique, country-by-country database was especially prepared for this study. This chapter details electricity access and the way households make the transition from traditional fuels to modern forms of energy. It projects biomass use and electricity access rates for the next three decades. It assesses the factors behind these trends, including policies to promote investment in electricity supply and to make electricity more affordable for poor people.
HIGHLIGHTS
• Some 1.6 billion people – one-quarter of the world population – have no access to electricity. In the absence of vigorous new policies, 1.4 billion people will still lack electricity in 2030.
• Four out of five people without electricity live in rural areas of the developing world, mainly in South Asia and sub-Saharan Africa.
But the pattern of electricity deprivation is set to change, because 95% of the increase in population in the next three decades will occur in urban areas.
• Some 2.4 billion people rely on traditional biomass – wood, agricultural residues and dung – for cooking and heating. That number will increase to 2.6 billion by 2030. In developing countries, biomass use will still represent over half of residential energy consumption at the end of theOutlookperiod.
• Lack of electricity and heavy reliance on traditional biomass are hallmarks of poverty in developing countries. Lack of electricity exacerbates poverty and contributes to its perpetuation, as it precludes most industrial activities and the jobs they create.
• Investment will need to focus on various energy sources, including biomass, for thermal and mechanical applications to bring productive, income-generating activities to developing countries.
Electrification and access to modern energy services do notper se guarantee poverty alleviation.
• Renewable energy technologies such as solar, wind and biomass may be cost-effective options for specific off-grid applications, while conventional fuels and established technologies are likely to be preferred for on-grid capacity expansion.
The Link between Energy Use and Poverty
Access to electricity and other modern energy sources is a necessary, but not a sufficient, requirement for economic and social development.
The escape from poverty also requires, among other things, clean water, adequate sanitation and health services, a good education system and a communication network. Yet cheap and available energy is indispensable.
Electricity provides the best and most efficient form of lighting; household appliances require it. Kerosene and liquefied petroleum gas (LPG) are more energy-efficient cooking fuels than traditional biomass. Diesel, heating and heavy fuel oil are more cost-effective for space heating. Diesel, gasoline and LPG are, and will remain, the primary transport fuels.
Modern energy services enhance the life of the poor in countless ways.1Electric light extends the day, providing extra hours for reading and work. Modern cook-stoves save women and children from daily exposure to noxious cooking fumes. Refrigeration allows local clinics to keep needed medicines on hand. And modern energy can directly reduce poverty by raising a poor country’s productivity and extending the quality and range of its products – thereby putting more wages into the pockets of the deprived.2
The extensive use of biomass in traditional and inefficient ways and the limited availability of modern fuels are manifestations of poverty. They also restrain economic and social development:
• Time spent gathering fuel: The widespread use of fuelwood and charcoal can result in scarcity of local supplies. This forces people – usually women and children – to spend hours gathering fuelwood and other forms of biomass further afield. In India, two to seven hours each day can be devoted to the collection of fuel for cooking.3 This reduces the time that people can devote to other productive activities, such as farming and education.
• Gender:70% of all people living in poverty are women.4Women place a high value on improved energy services because they are the primary users of household energy. Women are most likely to suffer
1. In September 2000, the World Bank, the International Monetary Fund, members of the Development Assistance Committee of the OECD and many other agencies adopted the Millennium Development Goals. These goals set targets for reductions in poverty, improvements in health and education, and protection of the environment. Improved access to energy services is an underlying component linked to the achievement of these goals. (http: //www.developmentgoals.org).
2. The World Bank Group (2002).
3. United Nations Development Program, United Nations Department of Economic and Social Affairs and World Energy Council (2002).
4. http: //www.undp.org/unifem/ec_pov.htm
the health effects of energy-inefficient appliances. Their exclusion from the decision-making process in many countries has led to the failure of many poverty alleviation programmes.
• Environment: Gathering wood for fuel leads to local scarcity and ecological damage in areas of high population density where there is strong demand for wood.
• Energy efficiency:In developing countries, biomass fuels are often burned in inefficient stoves. Wood is much less efficient for cooking than modern fuels, such as kerosene and LPG – its net calorific value is four times lower.
• Health:The inefficient use of biomass can lead to serious health damage from indoor smoke pollution. Possible effects include respiratory diseases, such as asthma and acute respiratory infections; obstetrical problems, such as stillbirth and low birth- weight; blindness; and heart disease (Box 13.1).
• Agricultural productivity: Use of biomass energy reduces agricultural productivity, because agricultural residues and dung are also widely used as fertilizer. The more biomass is put to household use, the less there is available for fertilizer. The dung used as fuel in India would be worth $800 million per year if it were used as fertilizer.5
Box 13.1:Examples of the Impact of Energy Poverty on Health
5. Tata Energy Research Institute et al. (1999).
6. http: //allafrica.com
The absence of efficient and affordable energy services can severely damage the health of the poor in developing countries.
• In rural sub-Saharan Africa, many women carry 20 kilogrammes of fuel wood an average of five kilometresevery day.6The effort uses up a large share of the calories from their daily meal, which is cooked over an open fire with the collected wood.
• Poor people in the developing world are constantly exposed to indoor particulate and carbon monoxide concentrations many times higher than World Health Organization standards.
Traditional stoves using dung and charcoal emit large amounts of CO and other noxious gases. Women and children suffer
The share of energy in the total spending of low-income households is high, up to 15% of income (Table 13.1). Energy spending rises with income, but generally at a less than proportional rate.
Table 13.1:Share of Energy Expenditures in Household Income(%) Uganda Ethiopia India South Africa United Kingdom
Lowest quintile 15.0 10.0 8.5 7.2 6.6
Highest quintile 9.5 7.0 5.0 5.5 2.0
Sources: African Energy Policy Research Network (Afrepren), direct communication; Tata Energy Research Institute (2001); Davis (1998); Department of Trade and Industry (2002).
The Transition to Modern Fuels
As poor families in developing countries gradually increase their incomes, they can afford more modern appliances, and they demand more and better energy services. But the transition from traditional biomass use to full dependence on modern energy forms is not a straight-line process.
most, because they are exposed for the longest periods of time.
Acute respiratory illness affects as much as 6% of the world population. The WHO estimates that 2.5 million women and young children in developing countries die prematurely each year from breathing the fumes from indoor biomass stoves.7
• A shift from cooking with wood to charcoal reduces the overall health risk by a factor of more than four. A shift to kerosene results in a reduction by a factor of six. Using LPG reduces the overall health risk by a factor of more than 100.8
• Often in developing countries, there are no pumps to gather or to purify water. In sub-Saharan Africa, only half of the population has access to an improved water source.9
• Lack of refrigeration means that food is spoilt and wasted.
Clinics lacking electricity cannot perform such routine functions as sterilising instruments or safely storing medicines.
7. United Nations Development Program, United Nations Department of Economic and Social Affairs and World Energy Council (2002).
8. http: //www.ftpp.or.ke/rnews/biomass.htm
9. http: //www.developmentgoals.org/Definitions_Sources.htm
There is a widespread misconception that electricity substitutes for biomass. Poor families use electricity selectively — mostly for lighting and communication devices. They often continue to cook and heat with wood or dung, or with fossil-based fuels like LPG and kerosene.
The three main determinants in the transition from traditional to modern energy use are fuel availability, affordability and cultural preferences. If a modern distribution system is not in place, households cannot obtain access to modern fuels, even if they can afford them. LPG penetration rates are low in many developing countries, partly because distribution infrastructure is lacking.
Even when they can afford modern fuels, households may not use them if they are much more expensive than traditional biomass. In rural areas, biomass is often perceived as something that is “free” and readily available. This kind of thinking seriously hampers the switch to modern energy. Even when fuelwood is purchased, it is likely to be cheaper than the cheapest alternative fuel.10The affordability of energy-using equipment is just as important as the affordability of fuels. The initial cost of acquiring kerosene and LPG stoves and LPG bottles may discourage some people from switching away from biomass.
In some cases, traditions determine the fuel choice regardless of fuel availability and income. In India, even very rich households keep a biomass stove to prepare their traditional bread.
Figure 13.1 is a static representation of the typical fuel transition in poor households as their income rises. The actual transition is much more dynamic, as nearly all households opt for a combination of fuels.11 Very poor households can hope to satisfy only their most basic needs: heating, cooking and lighting. Their fuel choices are restricted mainly to different forms of biomass. As their income increases, their fuel choices widen. The incremental energy needs of the highest-income households, whose use of biomass is minimal, tend to be met by electricity. The share of basic needs in total consumption falls off sharply as families grow more prosperous.
Figure 13.1 cannot adequately capture rural-urban differences in fuel choices, nor can it capture fuel switching that takes place within each block. Poor people often switch from one biomass fuel to another when the first becomes scarce. If wood is scarce or labour to collect it is in short
10. See World Bank (1995), which cites the result of a household energy survey in N’Djamena, Chad showing that fuelwood and charcoal are much cheaper than kerosene and LPG, even on the basis of cooking heat delivered.
11. Davis (1998), Masera et al. (2000) and Barnett (2000).
supply, low-income families will use dung or agricultural residues for cooking and heating. In cities, consumption patterns are more likely to be affected by relative fuel prices.
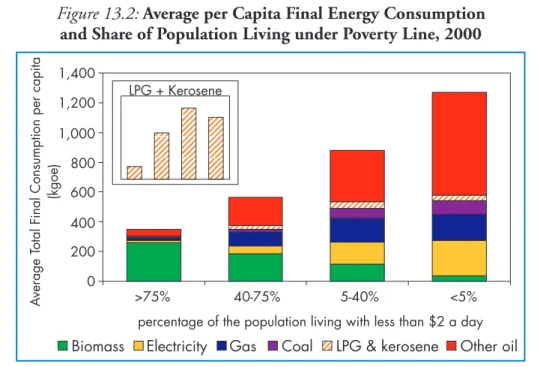
Figure 13.2 plots average final energy consumption per capita for 100 developing and transition countries, grouped according to the percentage of their population under the poverty line ($2 a day).12 In countries where less than 5% of the population is poor, per capita energy consumption is four times higher than in countries where more than 75% of the population lives under the poverty line. Consumption of commercial fuels, especially oil products, is much higher in the
12. World Bank (2001). In this chapter, being below the poverty line is defined as having income of less than $2 per day. People with income of less than $1 per day are categorised as “very poor”. Roughly 1 billion come into this category. There is, however, considerable uncertainty over data on the number of people in each of these categories.
Income
Low High
Cooking Heating
Refrigeration Basic Appliances
Transport ICT Cooling Other Appliances
Water Pump
Refrigeration Basic Appliances Transport
Biomass Biomass Kero, LPG, Biomass, Coal
Diesel Electricity
Oil Electricity,
Batteries
Electricity
Electricity
Oil
Gas, Electricity, LPG Gas, Coal, Oil Lighting Candles, batteries
Cooking Heating
Cooking Heating
Lighting Kero, batteries, elec Lighting Electricity Cooking
Heating
, Oil
Figure 13.1:Illustrative Example of Household Fuel Transition
Traditional/VitalFuel/Energy ServiceModern/Advanced
Note: ICT is information and communication technology.
Source: IEA analysis.
richest group of countries, partly because transport demand rises with income. LPG and kerosene are transition fuels in households: their consumption is higher for the intermediate groups, but lower for the richest citizens, who replace them with natural gas and electricity (see insert in Figure 13.2).13 Electricity consumption is very strongly correlated with wealth. The share of biomass in final energy consumption is lowest in countries where the percentage of poor people is lowest.
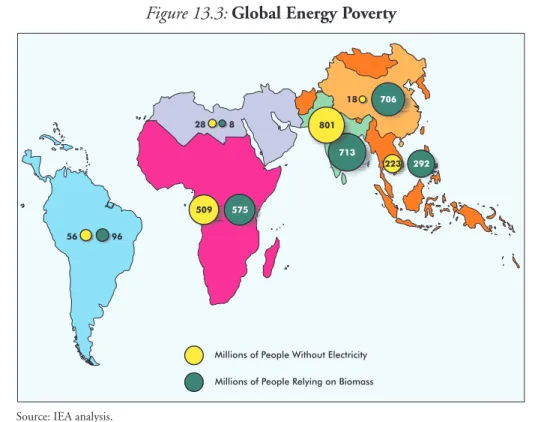
Some 2.8 billion of the world’s people live on less than $2 a day – the
“poor” as defined in this chapter. Our detailed statistical analysis of energy use in developing countries reveals that 2.4 billion people rely on biomass for cooking and heating, which account for more than 80% of their residential energy needs, and 1.6 billion people use no electricity at all.14 Most of these people live in South Asia and sub-Saharan Africa (Figure 13.3).
Figure 13.2:Average per Capita Final Energy Consumption and Share of Population Living under Poverty Line, 2000
Average Total Final Consumption per capita (kgoe) 0 200 400 600 800 1,000 1,200 1,400
<5%
5-40%
40-75%
>75%
percentage of the population living with less than 2 a day$ Biomass Electricity Gas Coal LPG & kerosene Other oil
LPG + Kerosene
Source: IEA analysis.
13. LPG accounts for nearly 20% of total residential energy demand in Latin America, but only for some 3% in Asia and Africa.
14. Access to electricity is defined as the number of people with electricity in their homes, either on-grid or off-grid. Our estimate does not include unauthorised connections. See Annex 13.1 for further discussion.
***
The transition from energy poverty to relative affluence is a complex and irregular process, varying widely from nation to nation, village to village and family to family. In a general way, it is a journey from nearly exclusive reliance on traditional biomass to the access and use of electricity together with a range of other modern fuels. By 2030, about two billion people will have completed the trip, but more than a billion will still be stranded in primitive energy poverty.
It is a common misconception that electricity simply replaces biomass. In fact, most households use a wide mix of fuels as their income rises, combining biomass with kerosene or LPG to cook or with fuel oil to heat their homes.
Nevertheless, traditional biomass and electricity do occupy contrasting positions in the fuel transition, and that is why this chapter concentrates mainly on them.
Statistics and analysis of all the other fuels that play a part in the transition from energy poverty to energy affluence are provided in chapters on individual fuels and on regions in theWorld Energy Outlook.
***
Figure 13.3:Global Energy Poverty
Source: IEA analysis.
Access to Electricity
To improve our understanding of the electrification process, we have built an extensive database with the best available information for most developing countries on how many people have access to electricity in their homes. The database is broken down by rural and urban areas. Annex 13.1 provides a detailed account of electrification rates for each country covered in the survey.
Aggregate data for 2000 show that the number of people without electricity today is 1.64 billion, or 27% of the world’s population. More than 99% of people without electricity live in developing countries, and four out of five live in rural areas. The World Bank estimates that the number of people without electricity has fallen from 1.9 billion in 1970, but not on a straight-line decline, in 1990, the figure was 2 billion.15As a proportion of the world’s population the number of unelectrified has fallen even more sharply — from 51% in 1970 to 41% in 1990.
The average electrification rate for the OECD, as well as for transition economies, is over 99%. Average electrification rates in the Middle East, North Africa, East Asia/China and Latin America are all above 85%. More than 80% of the people who currently have no access to electricity are located in South Asia and sub-Saharan Africa (Figure 13.4). Lack of electricity is strongly correlated to the number of people living below $2 per day (Figure 13.5). Income, however, is not the only determinant in electricity access. China, with 56% of its people still poor, has managed to supply electricity to more than 98% of its population (Box 13.2).
The rate of improvement in electricity access varies considerably among regions. Rapid electrification programmes in East Asia, especially China, account for most of the progress since 1970. Excluding East Asia/China, the number of people without electricity increased steadily from 1970 to 2000 (Figure 13.6).
Box 13.2:China’s Electrification Success Story
15. World Bank (1996).
16. Most sources confirm this electrification rate (See Annex 13.1).
China secured electricity access for almost 700 million people in two decades, enabling it to achieve an electrification rate of more than 98% in 2000.16From 1985 to 2000, electricity generation in China increased by
nearly 1,000 TWh, 84% of it coal-fired, most of the rest hydroelectric.
The electrification goal was part of China’s poverty alleviation campaign in the mid-1980s. The plan focused on building basic infrastructure and on creating local enterprises. China’s economy grew by an average annual 9.1% from 1985 to 2000. A key factor in China’s successful electrification programme was the central government’s determination and its ability to mobilise contributions at the local level. The electrification programme was backed with subsidies and low-interest loans. The programme also benefited from the very cheap domestic production of elements ranging from hydro generators down to light bulbs. China has avoided a trap into which many other nations have fallen: most Chinese customers pay their bills on time. If they do not, their connections are cut off.
This achievement dwarfs the efforts of any other developing country, but it conceals some serious shortcomings. China’s transformation and distribution networks still need very large investment to meet modern standards. Electricity services are unreliable and of poor quality. Wiring and meters in homes and offices are undependable, even unsafe. Usage is low, especially in rural areas, where consumers tend to restrict their electricity use to lighting their homes.
Figure 13.4:Electrification Rates by Region, 2000
per cent
0 10 20 30 40 50 60 70 80 90 100
Middle East North Africa East Asia/
China
Latin America
South Asia Sub-Saharan Africa Developing countries average
World average
Source: IEA analysis.
Figure 13.5:The Link between Poverty and Electricity Access 020406080
100 0102030405060708090100 % of population below $2 a day
OECD Nigeria
India Burkina Faso
Pakistan Madagascar
Nepal
Ghana MozambiqueBangladesh Ethiopia
Senegal Lesotho
Cameroon
Zimbabwe Kenya
Botswana Tanzania
Namibia
Indonesia
Egypt
China Ecuador Mongolia Côte d'IvoireYemen
Honduras
Paraguay El Salvador
Peru
VenezuelaTurkmenistan
Moldova Trinidad & Tobago
Armenia Colombia South Africa BoliviaGuatemala
Panama
Thailand Dominican Republic
Morocco
Jamaica
Chile Kazakhstan
AlgeriaUkraine Estonia Bulgaria BrazilCosta Rica
Romania Russia TunisiaJordanUruguay AzerbaijanLithuaniaCroatia
electricity access %
Note:SometransitioneconomiesandtheOECDaverageareincludedforcomparisonpurposes. Source:IEAanalysis;incomestatisticsfromtheWorldBank’sWorldDevelopmentIndicators,2001.
With only 23% of its population electrified, sub-Saharan Africa has the lowest electrification rate of any major world region (Table 13.2). More than 500 million Africans are still without access to electricity. The region’s poverty is one reason, but so is its low population density, which raises the cost of extending networks.
There are 580 million people lacking electricity in India. Although the electricity network there is technically within reach of 90% of the population, only 43% are actually connected because many poor people cannot afford the cost of connection. Even where incomes are high enough, households are often discouraged from connecting to the grid because of the poor quality of service, including frequent blackouts and brownouts.
Over the past three decades, half the growth in world population occurred in urban areas. Worldwide, electrification has kept pace with urbanisation, maintaining the number of the urban population without electricity at roughly 250 million. Put another way, the urban electrification rate increased from 36% in 1970 to 91% in 2000. The bulk of the urban unelectrified live in Africa and South Asia, where more than 30% of the urban population do not have electricity.
0 500 1,000 1,500 2,000 2,500
1970 1975 1980 1985 1990 1995 2000
World Rest of the world East Asia/China
Figure 13.6:Number of People without Electricity, 1970-2000
million
Source: IEA analysis.
Table 13.2:Urban and Rural Electrification Rates by Region, 2000(%)
Urban Rural Total
North Africa 99.3 79.9 90.3
Sub-Sahara 51.3 7.5 22.6
Africa 63.1 16.9 34.3
South Asia 68.2 30.1 40.8
Latin America 98.0 51.5 86.6
East Asia/China 98.5 81.0 86.9
Middle East 98.5 76.6 91.1
Developing countries 85.6 51.1 64.2
World 91.2 56.9 72.8
Four out of five people lacking access to electricity live in rural areas.
This ratio has remained constant over the past three decades. The number of the rural unelectrified has fallen by more than 200 million, and rural electrification rose from 12% in 1970 to 57% in 2000.
In Africa, more than 83% of the population in rural areas still lack electricity. In sub-Saharan Africa, more than 92% of the rural population is unelectrified. The number of the people without electricity in this region has doubled in rural areas and tripled in urban areas in the last 30 years. In South Asia, 70% of the rural population has no electricity access.
At the rate of connections of the past decade, it would take more than 40 years to electrify South Asia and almost twice as long for sub-Saharan Africa.
Prospects for Electricity Access in Developing Countries17
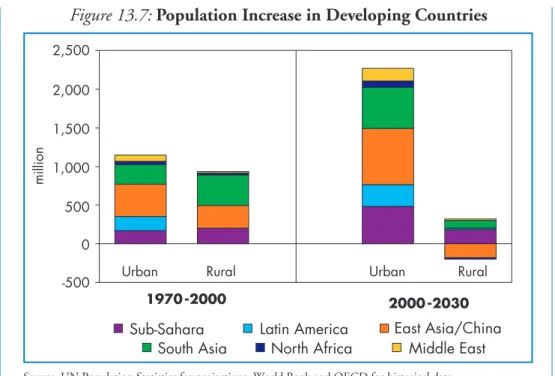
TheWEOReference Scenario projections show that 1.4 billion people will still not have electricity in 2030, some 17% of the world’s population, despite assumptions on more widespread prosperity and more advanced technology. The number of unelectrified will be 200 million less than today, in spite of an assumed increase in world population from 6.1 billion in 2000 to 8.2 billion in 2030. Since as much as 95% of population growth will take place in urban areas (Figure 13.7), urban electrification programmes will need to accommodate the swelling mass of the urban poor.
17. A new module has been added to the IEA’s World Energy Model to generate projections of electrification rates. The projections are based on many factors, including incomes, fuel prices, demographic trends, technological advances and electricity consumption.
Figure 13.7:Population Increase in Developing Countries
-500 0 500 1,000 1,500 2,000 2,500
Urban Rural Urban Rural
Sub-Sahara Latin America East Asia/China South Asia North Africa Middle East
1970 -2000 2000 -2030
million
Source: UN Population Statistics for projections, World Bank and OECD for historical data.
Figure 13.8:Number of People without Electricity, 1970-2030
0 100 200 300 400 500 600 700 800 900
1970 1980 1990 2000 2010 2020 2030
South Asia East Asia/China Latin America Middle East Sub-Saharan Africa North Africa
million
Source: IEA analysis.
Electrification rates and the number of unelectrified people will continue to diverge significantly among regions. Numbers of those without electricity will decline throughout the projection period in China and the rest of East Asia, North Africa, Latin America and the Middle East.
They will continue to rise slightly in South Asia, turning down after 2010.
They will peak in sub-Saharan Africa around 2025.
Most of the people without access to electricity in 2030 will still be in sub-Saharan Africa (650 million) and South Asia (680 million). In all other regions, including North Africa, the overall electrification rate will exceed 96% (Table 13.3) and will likely be close to 100% in urban areas. On average, 75 million people will gain access to electricity each year for the next 30 years (Figure 13.9).
In sub-Saharan Africa, the population without electricity will increase steadily until 2025 in line with projected trends in the number of people below the $2 per day poverty line.18The number of the unelectrified is expected to stabilise after 2025, mainly because of migration to towns and cities, where access to electricity will be easier. The region’s population is projected to
Figure 13.9:Annual Average Number of People Gaining Access to Electricity
million
0 20 40 60 80 100 120 140
1970 -1980 1980 -1990 1990 -2000 2000 -2010 2010 -2020 2020 -2030
Africa South Asia Middle East Latin America East Asia/China
Source: IEA analysis.
18. See http: //www.developmentgoals.org/Sub-Saharan_Africa.htm for income projections.
double in the next three decades.19Three-quarters of the increase will occur in urban areas. By 2030, roughly half the population will have electricity.
The number of the unelectrified in South Asia is expected to peak and level off in this decade and start declining from then on. Affordability and reliability are the main factors in this region. Two out of three people will have access by 2030. If poverty were to be reduced faster than assumed in our analysis, electricity access would expand farther and faster.
These projections are highly dependent on assumptions about incomes and electricity pricing, which together determine the affordability of electric power, and about the rate of investment in expanding electricity supply.
Table 13.3:Electrification Rates by Region(%)
1970 1990 2000 2015 2030
North Africa 34 61 90 98 99
Sub-Sahara 9 16 23 33 49
Africa 14 25 34 43 56
South Asia 17 32 41 53 66
Latin America 45 70 87 94 96
East Asia/China 30 56 87 94 96
Middle East 36 64 91 97 99
Developing countries 25 46 64 72 78
World 49 60 73 78 83
Investment in Electricity Supply Infrastructure
Investment requirements in developing countries fall broadly in these categories:
• additional generation capacity;
• extension of the electricity grid in urban areas;
• mini-grids in medium-sized settlements;
• decentralised installations providing thermal, mechanical and electric power in rural areas;
• maintenance and upgrading of existing infrastructure.
Over the next three decades the investment needed for new power generation capacity in developing countries will amount to $2.1trillion– 10% in Africa and 15% in South Asia.20Even if this investment is secured
19. United Nations Population Division (2001).
20. See Chapter 3 for the global and regional electricity generation and investment outlooks.
over the next thirty years, 1.4 billion people will still lack access to electricity in 2030.The average cost of connection varies greatly among countries. In South Africa, the average cost in 2001 was $240, compared to
$270 in Sri Lanka and over $1,000 in rural Kenya and Uganda.
Private investment in electricity projects in the developing world increased through most of the 1990s. It fell off, however, after the Asian financial crisis, from $46 billion in 1997 to less than $15 billion in 1999, then recovered to $30 billion in 2000.21 Private investment in electricity projects in developing countries is concentrated in power generation, rather than transmission and distribution. It is also concentrated in a small number of countries. Only a quarter offoreigndirect investment in energy goes to South Asia and Africa, while official development aid to Africa from foreign governments has fallen by some 6% a year since 1995.22
Since most sub-Saharan African and South Asian countries are strapped for cash, their governments will have to choose which electrification programmes to do first. Meeting the electricity needs of the urban poor costs much less per capita than meeting those of the rural poor.
Therefore, providing electricity to the 230 million unelectrified urban people in the two regions is likely to be tackled first.23In many countries, strenuous efforts will be made to reduce transmission and distribution losses due to unauthorised connections, non-metering, non-payment of bills and technical malfunctions.
In rural areas, investment is likely to focus on harnessing indigenous energy sources, including fossil fuels, to drive productive, income-generating activities. Smaller, less capital-intensive investments are more likely to be funded and will benefit more poor people. The technology choice should be based on economics and on natural resource availability. Private utilities will not extend networks where it is unprofitable to do so, unless government subsidies make up for financial losses and provide a fair margin of profit. In remote areas, where the distance from the grid renders it too costly to connect communities to the national or regional grid, decentralised micro- projects are an option. (Table 13.4). What is needed is a comprehensive strategy, co-ordinating policies and programmes through which micro- credit, technology uptake and capacity building can take place.
21. These figures do not include investments in oil and upstream gas. (SeePrivate Participation in Infrastructure Database, World Bank)
22. OECD (2002).
23. Future electrification investment needs will depend greatly on the level and pattern of rural/urban electrification trends. Detailed projections for rural/urban electrification are in progress and will be made available in the forthcoming study,WEO 2003 Insights: Global Energy Investment Outlook.
Table 13.4:Examples of Off-Grid Power Plant Technologies
Technology Applications Pros Cons
Diesel engines Water pumps Mills
Refrigeration Lighting and communication
Easy maintenance Continuous energy services (24 hours a day)
Allows for income- generating activities
High fuel costs Noxious and CO2 emissions
Small biomass plants
Water pumps Mills
Refrigeration Lighting and communication
Allows for income- generating activities Base load operation, continuous operation possible
Noxious emissions
Mini-hydro Mills Lighting, communication and other
Long life, high reliability
Allows for income- generating activities
Site-specific Intermittent Water availability
Wind Lighting and
communication Mills
Pumps
No fuel cost Expensive batteries Intermittent energy services
PV/Solar Basic lighting and electronic equipment
No fuel cost High capital costs High cost of battery replacement Needs further R&D
Frequent electricity blackouts and brownouts (euphemistically known as “load shedding”) induce many poor consumers to maintain an alternative energy source. Kerosene is the standard replacement fuel for electricity. In the Indian state of Madhya Pradesh, over 90% of rural electrified households use kerosene as a backup fuel for lighting. In urban areas, “load shedding” is much less frequent and kerosene plays a lesser role. Low-quality electricity service imposes non-negligible costs on consumers, and it can undermine their willingness to pay for electricity. Where it is possible, “scheduled load shedding” is announced to consumers in advance to allow them to adjust and plan for it. Even predicted power outages disrupt activities and increase costs to the end user.
Across India, unauthorised power connections run as high as 20% to 40% of the total.24A third of all power produced in India gets stolen. Slums survive on stolen power. Tapped electric lines and poles are a common sight in Indian cities. In Angola, theft is roughly equal to 40% of total electric utility revenue.25Poverty drives people to steal electricity and boosts the number of unauthorised grid connections. The expected rise in urban population will exacerbate the problem. In India, half of the electricity supply is estimated to be unmetered. Unpaid bills are also an issue. Unmetered and unauthorised connections lead to very high electricity losses in many developing countries, compared with OECD countries, where losses are technical (Figure 13.10).
Pricing
Even when the infrastructure to supply electricity to the poor exists, they are often unable to pay for it. There are two main barriers:
• the initial cost of connection to the grid and of inside wiring, which can be too high for poor households;
Figure 13.10:Electricity Losses by Country
0 5 10 15 20 25 30 35
Nigeria India Togo Kenya Zimbabwe Cameroon Eritrea Algeria Sudan Philippines Egypt Indonesia Ethiopia China OECD
per cent Source: IEA analysis.
24. Tata Energy Research Institute (2002).
25. Angola News Agency.
• monthly charges for units consumed; since many poor people do not earn a regular wage, it is hard for them to keep up monthly payments for electricity.
As a result, most developing countries subsidise electricity to households, since the benefits subsidies provide are judged to exceed the long-term costs to government. In many countries, the size of the subsidies and the way they are delivered result in heavy losses of economic efficiency, wasteful habits on the part of consumers and adverse environmental effects.26
One way to improve this situation is to have the government paypart of the capital cost of connection, or have the utility company spread the connection charge out over several months. Another approach is the so- called “lifeline rate,” a special subsidy for poor families — with “poverty”
defined by both household income and electricity use. The lifeline-rate system avoids a number of the pitfalls of other forms of subsidies, but it is hard to design in such a way that it does not benefit the rich even more than the poor.
Market Reforms
Energy industries in most developing countries are in urgent need of reform. Several countries have begun the process, but in widely varying ways. These include the commercialisation and privatisation of state- owned utilities, unbundling energy production from its distribution, opening markets to private investors and revising price policies. A few countries have even begun setting up competitive power pools. One aim of all these schemes is to attract private capital, in one way or another, into an impoverished energy sector.
Competition is the major theme in OECD reform programmes of the power sector. This may not be the first priority in developing countries.
Typically in these countries, the prerequisites for reform are often weak or lacking. Utilities are poor or bankrupt, the institutional framework for investment is non-existent and energy networks are underdeveloped.
Reform strategies in developing countries should address the issue of sustainable financing. Prices charged to consumers must cover the cost of producing and distributing energy. But achieving that end can be very difficult in the world’s poorest countries. Subsidies in the form of low-cost energy for consumers are rife. Pilfering, unauthorised grid connections and
26. See IEA (1999).
the non-payment of utility bills can be the rule, not the exception. In India, electricity revenues regularly run at about three-quarters of actual costs.27
In these circumstances, innovative thinking and the proper sequencing of events are vital to successful reform. Indeed, there are some cases in which systematic subsidisation for a limited period may be more desirable than attempting to charge full economic prices overnight. As energy industries in the developing world face these challenges, a degree of public support may be essential.
In countries like India, the necessary process of raising prices to market levels is bound to be politically and socially difficult. There is evidence, however, that even very poor families are willing to pay for reliable energy services.
One of the highest barriers to new investment in these countries is the perceived threat of “regulatory risk.” If the regulatory framework is perceived as unpredictable or incompetent, investors tend to keep their money in their pockets. A striking example occurred in Argentina earlier this year, when the regulator cut consumer prices after a large foreign investor had built a plant on the basis of the previous tariff lists.
Further complications arise from the lack of domestic capital markets, which can often mean high interest rates, with built-in risk premiums, to offset expected currency volatility and inflation.
The ultimate objective of reform should be an industry structure allowing a sufficient number of players to compete on equal terms, with the monopoly power of established entities truly constrained. This is feasible in most developed countries, but it may be an unrealistic early objective in the developing world. The tendency may be to privatise first and reform industry structures later on. In some cases, there may not be much choice.
Most developing countries have inadequate gas and electricity grids, and the deficiency must obviously be made good before real competition can occur. But, in that event, close regulation will be needed to avoid exploitation of customers and to achieve wider electrification.
International lenders and major financial institutions have learned many lessons the hard way. Major lenders have switched away from energy projectsto energyprogrammesand sector reforms aimed at paving the way for private-sector participation and competition. And there is a new emphasis on the propersequencingof reform steps, which can be expected to vary from country to country.
27. IEA (2002).
Biomass Use
Poor people in developing countries rely heavily on traditional biomass for cooking and heating.28 Because the share of biomass use in final consumption has been decreasing since 1994, the earliest year for which comprehensive IEA data are available29, it is easy to get the impression that it is being replaced by other fuels and is gradually being phased out. New industries, transport and power generation oftendouse fossil fuels. But wood and other biomass continue to be used in many industries in developing countries and for cooking and heating.30
In developing countries, some 2.4 billion people rely on traditional biomass for cooking and heating. The 2000 estimates presented in Table 13.5 are based on an analysis of rural and urban biomass consumption in developing countries. While the people included in the table may or may not have access to electricity for lighting, they generally lack access to modern energy services for cooking and heating.
Over half of all people relying on biomass for cooking and heating live in India and China, but the proportion of the population depending on biomass is heaviest in sub-Saharan Africa. Extreme poverty and the lack of access to other fuels mean that 80% of the overall African population relies primarily on biomass to meet its residential needs. In Kenya, Tanzania, Mozambique and Zambia, nearly all rural households use wood for cooking, and over 90% of urban households use charcoal. In Indonesia, nearly all rural households use wood for cooking. In East Asia, the heaviest biomass use occurs in the Philippines, Thailand, Myanmar and Vietnam.
In China, the government has discouraged people from using straw and other agricultural waste for fuel. Nevertheless, in rural areas, many families do still rely on biomass. In the past, coal replaced biomass for heating and cooking in China’s cities. Poor people in many Central American countries, especially Guatemala, Honduras, Nicaragua and Haiti, rely on wood for cooking and heating.
28. See definition in Annex 13.1. Biomass use here is mostly non-commercial.
29. Despite the importance of biomass in energy demand in developing countries, only recently has it been included in global energy statistics. This is mainly because national biomass statistics have been incomplete or of poor quality. Biomass use can vary widely within a single country, and statistics based on a small number of villages can be misleading when extrapolated to the national level. The IEA has created a specialised database on biomass, with historic data from 1994. Projections for biomass energy demand by region/country are in Annex 13.1.
30. Hulscher (1997) finds that there is no inverse correlation between per capita consumption of biomass and GDP per capita for countries in South and South-East Asia. As GDP per capita rises, people in these countries are likely to go on using biomass, and complement it with other fuels.
Table 13.5:Number of People Relying on Traditional Biomass for Cooking and Heating in Developing Countries, 2000
million % of total population
China 706 56
Indonesia 155 74
Rest of East Asia 137 37
India 585 58
Rest of South Asia 128 41
Latin America 96 23
North Africa/Middle East 8 0.05
Sub-Saharan Africa 575 89
Developing countries 2,390 52
Biomass consumption in any country is largely a function of that country’s relative poverty (Figure 13.11). But other factors come into play as well, including the country’s degree of urbanisation and what fuels are readily available. Biomass use can vary sharply between two countries with similar poverty levels. Costa Rica has a similar number of people living below the poverty line as Thailand, but because of the ample availability of hydroelectric power, many Costa Ricans use electricity for cooking and heating. In Eastern Europe and in Russia, modern fuels are available and a higher percentage of people live in cities. When more than half of the population has an income of less than
$2 per day, residential energy demand tends to be dominated by biomass.
In 2000, biomass accounted for over 70% of residential energy consumption in developing countries (Figure 13.12). The amount of biomass consumed and the form it takes differ among regions and even within countries, depending on resource availability, the accessibility of commercial fuels, cultural preferences and incomes. In the majority of sub- Saharan African countries, 80% to 90% of the residential energy needs of low-income households are met by fuelwood or charcoal. In South Asia, dung and agricultural residues account for over half of biomass energy use.
In China, agricultural residues alone make up half of biomass energy use.
In Latin American countries, biomass use is predominately made up of fuelwood for cooking and heating.
Figure 13.11:The Link between Poverty and Share of Traditional Biomass in Residential Energy Consumption
Share of biomass in residential consumption (%)
% of population below $2 a day 0
10 20 30 40 50 60 70 80 90 100
0 10 20 30 40 50 60 70 80 90 100
Algeria Zambia
Panama
Costa Rica Bangladesh
Mexico Ecuador Bolivia
Russia
Tunisia Sri Lanka
Pakistan Nepal India Nigeria
Mozambique Tanzania
Guatemala Senegal
Indonesia
Uruguay
Morocco
Poland Romania
Brazil Turkey Colombia China
Zimbabwe Kenya
Paraguay El Salvador
Peru South Africa
Thailand Chile
Source: IEA analysis and the World Bank’sWorld Development Indicatorsfor income statistics.
Figure 13.12:Share of Traditional Biomass in Residential Energy Consumption, 2000
0 10 20 30 40 50 60 70 80 90 100
Sub-Saharan Africa
India Rest of South Asia
Rest of East Asia
Indonesia China Latin
America North Africa Biomass Other
per cent
Source: IEA analysis.
Rural and urban consumption patterns also differ. But some general observations can be made:
• Biomass consumption is usually higher in rural areas, where fuelwood is more likely to be gathered than bought commercially.
• In urban areas, biomass competes with commercial energy sources, and consumption patterns are largely determined by relative fuel prices.
• Much of the fuelwood used is collected from the roadside or vacant lots. Very little comes from natural forests.
• Cooking stoves used in rural households are generally of poorer quality than those used in cities.
• In peri-urban areas, poor people are likely to use whatever waste is available as fuel for cooking and heating.
Rural industry in developing countries relies heavily on biomass for fish-smoking, brick-making, tobacco curing, food processing, furniture- making, ceramics and bakeries. These industries employ tens of thousands of people, and the income they produce frees many rural households from poverty. Enormous potential exists to improve the efficiency of industrial ovens, dryers and bakeries that run on biomass.31
Prospects for Biomass Use in Developing Countries
Expanded access to electricity, which low-income households use primarily for lighting, is unlikely to reduce the demand for biomass in many country in Africa and South Asia. In thirty years’ time, biomass will also continue to represent the largest share of residential energy demand in some countries in East Asia. In many countries, biomass consumption will continue to increase in absolute terms. The fact that the number of people relying on biomass will remain high over the projection period is not, in itself, a cause for concern. It is the way in which biomass is used, the technologies and applications used in its combustion, which links biomass use to poverty in many developing countries. This makes it urgent to improve the efficiency of biomass use in order to alleviate the adverse impact on health (see Box 13.1) and other damaging effects.
In the WEO Reference Scenario, residential biomass demand in developing countries is projected to rise from 723 Mtoe in 2000 to 788 Mtoe in 2030. The main drivers are macroeconomic and demographic
31. See World Energy Council/FAO (1999) and www.rwedp.org for more information on industrial biomass use in developing countries.
variables, commercial energy use, technology and fuel prices. The availability of biomass resources is also taken into account.32
In Africa, biomass will still account for 80% of residential energy use in 2030. In East Asian countries, excluding China, it will account for over 50% of residential consumption in 2030. Biomass use in the residential sector in Indonesia will decline in the last two decades of the projection period, accounting for 45% of residential demand in 2030.33In South Asia, the share of biomass use will remain high, at nearly 70% in 2030. In developing countries as a whole, biomass will represent 53% of residential energy consumption in 2030, down from 73% in 2000.
The share of the world population relying on biomass for cooking and heating is projected to decline in most developing regions. But the total number of people will rise, mainly due to increases in the number of people relying on biomass in South Asia and sub-Saharan Africa. Over 2.6 billion people in developing countries will continue to rely on biomass for cooking and heating at the end of the projection period.34 That is an increase of 238 million, or 9% (Table 13.6). In China and Indonesia, the number of people using traditional biomass for cooking and heating will decline.
Vigorous government measures to encourage the use of agricultural waste for power generation rather than for cooking will lower the share in China.35In much of Latin America, rising incomes, improved availability of modern energy and urbanisation will reduce demand for biomass, although it will likely remain the dominant fuel in the poorer countries of Central America.
Because biomass will continue to dominate energy demand in developing countries in the foreseeable future, the development of more efficient biomass technologies is vital for alleviating poverty, creating employment and expanding rural markets. Modern biomass technologies compete with conventional technologies in many applications, and the room for improving the use of biomass in developing countries is immense.36Biomass is routinely listed along with other “renewable” energy
32. See Annex 13.1 for regional projections. Regional assumptions regarding wood fuel availability and biomass utilisation issues were made in co-operation with the Food and Agriculture Organization of the United Nations (FAO-UN).
33. See Chapter 11 for more detail on biomass energy demand in Indonesia.
34. The energy demand projections on which these estimates are based include technological parameters that increase the efficiency of biomass use. The estimates of the number of people relying on biomass for cooking and heating are based on the assumption that biomass demand per capita in each region is constant over theOutlookperiod at 2000 levels. The constant per capita use is a conservative assumption, which defines the lower limit of the number of people who rely on biomass for cooking and heating.
35. Ping (2001).
36. See United Nations Development Program (2000) and IEA (2001).
sources, and the impression persists that it is a “free good” that will continue to be available indefinitely. That, however, is not the case.
Urbanisation and industrialisation strain the availability of biomass resources. Peri-urban areas, in particular, will come under increasing pressure to meet demands for biomass energy and agricultural land.
Biomass scarcity will worsen living conditions in poor neighbourhoods, by forcing residents to use lower-quality waste as cooking fuel. Rising demand for commercially-traded fuelwood in towns and cities will put pressure on supplies in nearby rural areas. As rural supplies become monetised, traditional “free” sources will diminish.
Table 13.6:Number of People Relying on Biomass for Cooking and Heating in Developing Countries(million)
2000 2030* 2000-2030
(%)
China 706 645 -9
Indonesia 155 124 -25
Rest of East Asia 137 145 6
India 585 632 7
Rest of South Asia 128 187 32
Latin America 96 72 -33
Africa 583 823 27
Developing countries 2,390 2,628 9
* Assuming that biomass use per capita is constant, at some 0.3 toe per capita, over the projection period. This figure is an average across all regions and countries. Analysis indicates that average per capita biomass use varies between some 0.24 toe in South Asia to nearly 0.4 toe in many countries in East Asia. See Tata Energy Research Institute et al. (1999) for a similar approach.
In some rural areas, people must go farther and farther afield to gather fuelwood. Radar imagery, which shows deforestation along roads and trails leading to villages, is presented in Figure 13.13. The figure gives a rough idea of how biomass has been depleted around villages in Central Africa.
In many urban and suburban areas of mega-cities in developing countries, there is virtually no wood left to scavenge — or what is left is many miles away. Populations in slums are growing fast because of the influx of people from rural areas attracted by the perception of opportunities that the cities offer. Some of them resort to fuelwood gathering even in the cities.
Currently in Africa, there are two cities with more than 10 million people,
Lagos and Cairo. By 2015, Lagos will have a population of over 23 million and Cairo’s population may reach 14 million. With an increasing number of people living in marginalised conditions in mega-cities in developing countries, the use of traded wood fuels is bound to increase.
As a result, poverty proliferates and quality of life erodes even further. One example is Delhi, where sprawling slums have proliferated.37 When wood becomes scarce, the better-off switch to kerosene. But very poor families have to collect virtually anything lying about — twigs and scraps from construction sites — to heat, cook and light their homes. Together with the low ceilings, cramped quarters and tainted water of the Delhi slums, the noxious fumes from inefficient combustion of this mix of fuels pose a direct threat to the
Figure 13.13:Radar Image of the “Charcoal Web”
in Central African Republic
Note: This enhanced radar image shows swathes of deforested land, in darker colour, along the roads and tracks leading out of towns and villages in northwest Bangui in the Central African Republic. The “charcoal web” refers to the deforestation swathes. Most of the wood is used to make charcoal for use by village households.
Source: Courtesy: NASDA; Interpretation: Radar Technologies France.
37. Bhasin (2001).
residents’ health. Poverty is also severe in many African cities. In Dar es Salaam, the poor often cannot afford to buy wood for cooking, instead, they collect various sawmill- and agro-residues, twigs from city trees and wastes from public dumps.38
Our projections for biomass use take account of expectations for biomass supply. But the link between availability of biomass resources and demand pressures is still not very well understood. The projections are meant to provide a message about possible outcomes of biomass use. The precise numbers are less important than the message they portend.
38. Katyega (2001).
Annex 13.1
EXPLANATORY NOTES
Contents
Table 13.A1 – Electricity Access in 2000 (Country-by-Country Database)
• Regional Aggregates
• Africa
• Developing Asia
• Latin America
• Middle East
Table 13.A2 - Urban and Rural Electrification Rates by Region, 2000 Table 13.A3 - Projections of Biomass Energy Demand in Developing Countries
Definitions
Electricity Access
There is no single internationally accepted definition for electricity access. The definition used here covers electricity access at the household level, i.e. the number of people that have electricity in their home. It comprises commercially sold electricity, both on-grid and off-grid. It also includes self-generated electricity, for those countries where access to electricity has been assessed through surveys by government or government agencies. The data do not capture unauthorised connections.
The main data sources are listed in the tables. Each data point has been validated through a consistency-check process among different data sources and experts. The electrification rate shown in this annex is the number of people with electricity access as a percentage of total population.
Rural and urban electrification rates have been collected for most countries. Only the regional averages are shown in this publication.
Enquiries about statistics should be addressed to the Economic Analysis Division (http://www.worldenergyoutlook.org).
Secretariat Estimates
Where country data appeared contradictory, outdated or unreliable, the IEA Secretariat made estimates based on cross-country comparisons, earlier surveys, information from other international organisations, annual statistical bulletins, publications and journals.
Population and Urban/Rural Breakdown
Projections are from the World Urbanisation Prospects – The 2000 Revision 1,published by the United Nations Population Division. Historical data are fromWorld Bank Development Indicators, 2001.
Biomass
Biomass comprises solid fuels (wood, charcoal, wood wastes and agricultural residues and dung), gas (biogas, landfill gas, and other gases from biomass), liquid fuels (alcohols, bio-additives and other liquid fuels) and industrial and municipal waste. Data on biomass consumption are from IEA statistics,Energy Balances of Non-OECD Countries, 2002 edition.
UN-FAO data are used for information on forest coverage and estimates of biomass supply. In the chapter, traditional biomass refers mainly to non-commercial biomass use, which is largely solid fuels.
Table 13.A1:Electricity Access in 2000 - Regional Aggregates Electrification
rate
%
Population without electricity
million
Population with electricity
million
World 72.8 1644.5 4390.4
Developing countries 64.2 1634.2 2930.7
Africa 34.3 522.3 272.7
Developing Asia 67.3 1041.4 2147.3
Latin America 86.6 55.8 359.9
Middle East 91.1 14.7 150.7
Transition economies 99.5 1.8 351.5
OECD* 99.2 8.5 1108.3
*OECD figures aggregate some important regional variations. The electrification rate for Turkey and Mexico is about 95 %. All other Member countries have 100% electrification.