Challenge of Design Data Exchange between heterogeneous Database Schema
Roland Eckert, EADS Deutschland GmbH, Germany, roland.eckert@eads.com Günther Specht, University of Ulm, Germany, specht@informatik.uni-ulm.de
Abstract. The development of complex systems becomes increasingly difficult. The diversity and number of tools necessary to develop such a system is extensive. One solution to exchange engineering data between these tools is the Standard for Product Data Exchange (STEP), ISO 10303. It offers domain specific database schema called application protocols.
This paper analyses the problems of the data exchange between tools via an application protocol. and proposes a Transformation Report, which records individual transformation steps during the exchange between two different tools. The Transformation Report supports the understanding of the data exchange process and helps correcting incomplete or incorrect transformed data.
1. Introduction
The number of available heterogeneous data sources increases daily. Companies exchange and share information across the country and the world. This has created an increased demand for automated data translation. The primary problem of data translation is that the user is unaware of what happens during the data transformation. Only restricted techniques are available to handle inconsistencies, heterogeneity of data and loss of data quality.
In large projects with several cooperating partners different tools for the same activity are used by different partners, or even by the same partners in different stages of product development (for instance, for functional modelling during concept development, versus full product definition). Information transfer between partners or tools has to be bridged by appropriate data transformations. The problem, however, is that while data is exported or imported in a target tool, its structure may be altered so that semantic concepts in the source schema are represented using the target model’s preferred mechanisms for denoting them. Not all data from the source finds an adequate representation in the target tool. Some of the data gets lost. Error detection in the target tool is a difficult task if the delivered data contains special terms, symbols, formulas, or conventions whose syntactic contributions cannot be established without a complete understanding of the delivered data. Today, there is no standardized documentation available about the data that gets lost or becomes altered during data transformation. This paper presents a Transformation Report that logs the translation of the data from the source to the target.
A Transformation Report can also be a powerful instrument for improving the data migration from a legacy system into a state of the art system. The documentation of the data migration process is also of great importance. If the user has to migrate millions of items, he is not able to check the whole import results, looking for corrupted or lost items. Specific migration tools often leave a developer in a situation where 80% of the code had been converted successfully but the remaining 20% has to be fixed by hand, which is completely ineffective.
The paper is organized as follows. Section 2 describes the problems of the data exchange via a global schema. Section 3 describes the different steps of a data transformation from the source to the target. It also introduces the transformation of the data from the source to the target. Next we describe the specific elements of such a Transformation Report in section 4. In section 5 the restrictions of the solution are explained. Section 6 summaries the benefits of such a report and proposes the standardisation of the report by an international body, e.g. the ISO.
Proc. 13th Conf. Product Data Technology (PDT Europe 2004), 18.-20. Oct. 2004, Stockholm, pp.125-132
2. Challenge of Data Exchange via Neutral Database Schema
There is a lot of previous work on schema matching developed in the context of schema translation and integration, knowledge representation, machine learning and information retrieval [Batini, 1986; He, 2003; Rahm, 2001]. This work is relevant for the developer of the interface, but they offer no documentation of the data transformation process. The user of the interface does not know what happens with his data during the data transformation from one digital tool to another.
A standardised database schema as transfer vehicle like AP233 helps to improve the quality of IS-Gateways (in the paper called interfaces) and, consequently, the interoperability of tools because a lot of errors in the interface development can be avoided as there is a smaller number of interfaces to be built. Also, the structure of the interfaces is well prepared and fixed in such a standard, so that every tool vendor has the same baseline for his development, which increases the interoperability of the interfaces themselves. There are even more advantages:
The standard enables the long term storage of systems engineering data in tool neutral format, considering that a lot of systems have a lifespan of 50 years or more. Additionally, engineers will get the possibility to collect parts of design information from multiple tools so that they can perform continuous consistency checking of the data. There is the possibility to store data of different tools in a central data repository which could, for instance, include automatic consistency checking and other feat ures.
Never the less, subtle and unnoticed transmission errors can lead to expensive errors in systems development. If the user loses 1% of information or the data is changed in meaning, he has to check all transferred data. This additional time expenditure reduces dramatically the worthiness of the received data and the benefit of an automated data exchange. One fundamental question when dealing with autonomous heterogeneous database systems with own database schema is the disclosure of semantic [Naiman, 1995; Garia-Salaco 1996], schematic [Kim, 1991; Krishnamurthy, 1991] and syntactical conflicts (data quality). A conflict is the consequence of different concepts and database representations in tools as a result of their independent development by vendors and comes by two (or more) not identical representations of the same concept.
The same concept can be described in different schemas using different representations. This generates several types of semantic relationships between these representations. In [Batini, 1986] these relationships are classified as: identical, when the representations are exactly the same; equivalent, when the representations are not exactly the same, but it is possible to use either behaviour, or mapping, or transformation equivalences; compatible, when the representations are neither identical nor equivalent, but the constructs and integrity constraints are not contradictory; and incompatible, when the representations are contra dictionary. The equivalent, compatible and incompatible semantic relationships are defined as conflicts.
We identify two types of semantic heterogeneity; Cognitive heterogeneity arises when two data models have different perceptions of real world facts. Using the same names, i.e. homonyms, can conceal these differences. Naming heterogeneity refers to different names for identical concepts of real world facts, also called synonyms.
Other types of conflicts can be classified as follow: Scale, involving the use of different units of measurement. Structural, when the same facts are described in two schemas using different elements of the same data model. Representation, when the same data item has different representations in the schema. Different levels of abstractions, when one schema contains more information details than the other. Schematic discrepancies, when data in one database corresponds to metadata in an other.
Data loss during a data transformation occurs, when information (e.g. entities) are mapped from the source to the target tool [Table 2-1], were no equal or suitable structure is available.
If a pair of schemas (A,B) is considered then a transformation function T can be defined to capture how a specific concept in schema A shall be represented in schema B:
b=T(a) with
a={a1, a2,...,am} ∈ Schema A ∨ ∅ ∧ b={b1, b2,...,bn} ∈ Schema B ∨ ∅
A schema may be defined with the intention to be implemented in a particular database system, in this case it is called data model. An information model or concept model is a schema that is independent of any particular implementation.
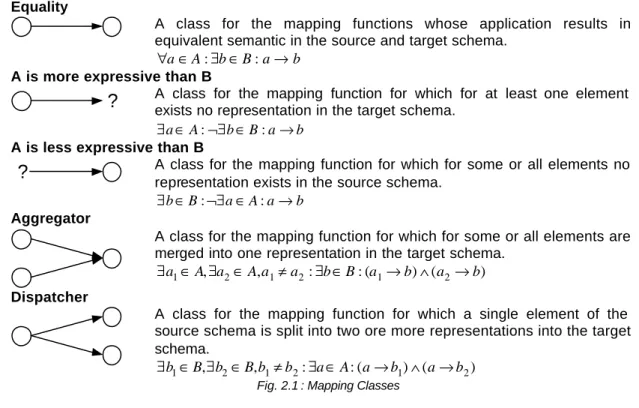
Equality
A class for the mapping functions whose application results in equivalent semantic in the source and target schema.
b a B b A
a∈ ∃ ∈ →
∀ : :
A is more expressive than B
?
A class for the mapping function for which for at least one element exists no representation in the target schema.b a B b A
a∈ ¬∃ ∈ →
∃ : :
A is less expressive than B
?
A class for the mapping function for which for some or all elements no representation exists in the source schema.b a A a B
b∈ ¬∃ ∈ →
∃ : :
Aggregator
A class for the mapping function for which for some or all elements are merged into one representation in the target schema.
) ( ) ( : : ,
, 2 1 2 1 2
1 A a Aa a b B a b a b
a ∈ ∃ ∈ ≠ ∃ ∈ → ∧ →
∃ Dispatcher
A class for the mapping function for which a single element of the source schema is split into two ore more representations into the target schema.
) ( ) ( : : ,
, 2 1 2 1 2
1 B b Bb b a A a b a b
b∈ ∃ ∈ ≠ ∃ ∈ → ∧ →
∃
Fig. 2.1 : Mapping Classes
During the data transformation also loss of semantic information can occur. There are many mappings between structures which are syntactically correct and result in the transfer of all of the data from one structure to another. However, many of these are semantically incorrect and result in information loss. As an example consider the data transformation from a relational schema to hierarchical database schema. Or consider a data structure, consisting of a colour value and a set of (x,y) points used to create a graphics image. Given a data migration system, the structure could easily be converted to a tabular form with triples of x,y and colour values.
This involves no data loss, but, there is a semantic loss in that the fact that a group of points in the original form had an identity associated with it by virtue of the shared colour. If one were to change the colour for one of the points, then they would all change colour. The behaviour can only guaranteed by surrogate, but not all tools support surrogates. These tools cannot guarantee the behaviour when the information is stored as x,y, colour triples.
The established approach for data transformation and integration ignores the data processing before the data integration and looses important information.
For evaluating the presented concept a data exchange between CASE tools Teamwork from Computer Association and Statemate from I-logic was analysed. Four different data sets were used:
Data
Instances 3374 5537 5227 8323 9033 14566 5376 8900 Function Instances 36 36 61 61 114 114 62 62
Leaf Function 30 30 51 51 86 86 48 48
Defined Functions 188 161 351 319 670 667 347 347 Element Identifier 431 740 652 1051 957 1736 572 1113
Set 1 Set 2 Set 3 Set 4
The first column describes the data export from Statemate and the second column describes the data export from Teamwork, after the data from Statemate was imported. The critical observation is, that function definitions goes lost. Both tools use different concepts for element identifier. The different number of instances is a result of the different concepts of the interfaces and the way data is stored in the tools.
3. Data Transformation logged by Transformation Report
The strategy of the suggested Transformation Report and Acknowledgment in this paper is to log all data processing results as early as possible. At every step were the exported data are processed a report is derived. This reporting includes also a feedback, the acknowledgment.
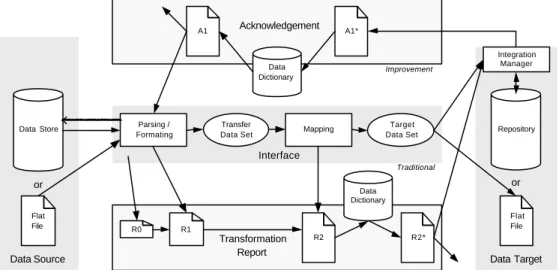
The reporting architecture [Fig. 3-1.] is divided into two parts, the ‘transformation report’ (R0, R1, R2, R2*) and the ‘acknowledgement’ (A1*, A1). The generation of the transformation report starts at the source and ends at the target tool. The acknowledgement describes which data were actually imported into the repository.
The transformation process of the data can be divided into a set of processing steps connected by pathways indicating the flow of information from one processing step to another. The data source and the data target can be proprietary stored data in an application or tool. Than there is no Integration Manager. The data can also be stored in a repository defined with a standardised data model (e.g. STEP ISO 10303-AP233) or a single file, called flat file, formatted in a suitable format like e.g. ISO 10303-P21 (ASCII), or ISO 10303-P28 (XML) that is e.g. ISO 10303-AP233 conform.
Data Source Data Target
Mapping Target
Data Set
Data Store Repository
Integration Manager
Transfer Data Set
A1*
A1
R2
Data Dictionary
Transformation Report
Acknowledgement
Parsing / Formating
R2*
Interface
Flat File
Flat File
or or
Data Dictionary
R1 R0
Improvement
Improvement Traditional
Fig. 3.1 : Architecture for gaining the Transformation Report and the Acknowledgement
The exporting of data from the data source starts with the selection of the data set which has to be exported. The first task is the parsing and formatting of the data into an intermediate structure ‘Transfer Data Set’. This intermediate structure will probably be based on a predefined data schema (e.g. application protocol). The next task is to map the structure of the data schema to the data structure of the destination system. This data set is called ‘Target Data Set’
to signify that it is the same data semantic with different representation. The “Integration Manager” level selects an integration strategy for every entity. An entity can be completely ignored, defined as an initial version, or merged with a version already existing in the repository or can be initialised if it is new.
The first available information for the transformation report is ‘R0’. It contains predefined configuration information of the data source, the data target, the used interface, and organisation information. The initial report ‘R0’ is extend by a listing of all entities that were exported (R1). During the parsing and formatting phase errors, e.g. referential integrity, or syntax errors are discovered. These phenomena are also listed in the transformation report.
During the mapping phase those entities are separated who are not mapable to the target schema. Here also semantic errors are discovered and added to the transformation report ‘R2’.
Our technique can even handle different naming conventions for the stored entities. So the entities are translated from one naming convention to another via the central ‘Data Dictionary’
[Lomax, 1977]. The result of the renaming of the entity identifier is the report ‘R2*’. This report
‘R2*’ together with the ‘Target Data Set’ is presented to the Integration Manager.
Versioning and independent sources lead to different naming conventions for the entities. For configuration management purposes it is necessary to use an unambiguous identifier for every entity by every involved tool through the life cycle. A data dictionary could fulfil this task. It is an organized list of all data elements that are pertinent to all involved systems, with precise, rigorous definitions so that both the source and target tool have a common understanding of all
inputs, outputs, components of stores. The initiative “Product Life Cycle Support”
(http://www.plcsinc.org/) offers an identification mechanism that could be sufficient.
These identifiers are organized in the “Data Dictionary”.
The receiver of any message sends a feedback information, “Acknowledgement” about the result of the import process. In case of a successful importing, an acknowledgement message is send to the sender, in the error case, a message send with information about the problems detected. The Acknowledgement has to manage the following conditions:
OK The Data file successfully imported Wrong An error is occurred during import Wait The data file is waiting to be processed Pending The data fail is waiting to be processed again
It is possible to use the same structure of the Transformation Report for the Acknowledgement Report. Because of different naming conventions it is necessary to translate A1* to the original naming convention via the data dictionary. The only difference is, that there is only the Acknowledgment Report and no more data is attached. With this report the user can try to fix possible problems in the source system.
4. Instantiation of a Transformation Report
The Transformation Report is available in different granularity and from different points of time so the decisions are governed by multiple measures of merit. The used architecture is very pragmatic with a high usability and feasibility.
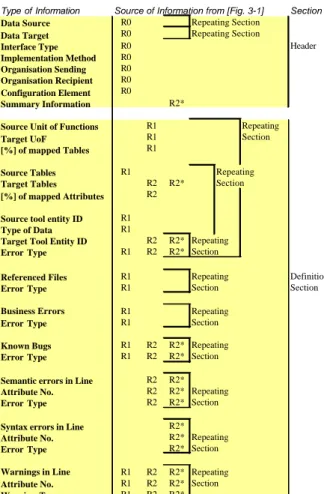
In figure 4-1 the format of a transformation report is specified. In the left column the content of the meta information is listed. The column in the middle is a reference to the figure 3-1 Architecture for gaining a Transformation Report and in the right column there are comments, describing the use of the described section.
Type of Information Source of Information from [Fig. 3-1] Section
Data Source R0 Repeating Section
Data Target R0 Repeating Section
Interface Type R0 Header
Implementation Method R0 Organisation Sending R0 Organisation Recipient R0 Configuration Element R0
Summary Information R2*
Source Unit of Functions R1 Repeating
Target UoF R1 Section
[%] of mapped Tables R1
Source Tables R1 Repeating
Target Tables R2 R2* Section
[%] of mapped Attributes R2
Source tool entity ID R1
Type of Data R1
Target Tool Entity ID R2 R2* Repeating
Error Type R1 R2 R2* Section
Referenced Files R1 Repeating Definition
Error Type R1 Section Section
Business Errors R1 Repeating
Error Type R1 Section
Known Bugs R1 R2 R2* Repeating
Error Type R1 R2 R2* Section
Semantic errors in Line R2 R2*
Attribute No. R2 R2* Repeating
Error Type R2 R2* Section
Syntax errors in Line R2*
Attribute No. R2* Repeating
Error Type R2* Section
Warnings in Line R1 R2 R2* Repeating
Attribute No. R1 R2 R2* Section
Warning Type R1 R2 R2*
Fig. 4.1 Format Specification of a Transformation Report
4.2 The Header Section
The header contains administration and technical information on the sender and receiver of data. It describes the used interface, the sending tool, the assumed destination tool and general configuration information. This information is available before the parsing and formatting activities starts and is marked with R0. Only the summary information in the header section is generated, after the whole report is available.
There are two important attributes, which characterise the capability of the implemented interface: the “Implementation Level” and the “Estimated Data Loss”. We suggest treating both as attributes to the data section “Interface Type”. The attribute “Implementation Level” is an indicator for the worthiness of the data. It indicates the maturity of the interface or the test coverage applied. It is an indicator for the maturity of the interface. This factor seems obscure, but is useful because in many cases the documentation of the underlying data model of the source tools is not publicly available. Therefore it is necessary to develop an interface by trial and error [Eckert, 2003]. Other information contained in this attribute is the coverage of the mappings that are implemented.
Another quality measurement is the “Estimated Data Loss”. The “Estimated Data Loss”
(Equation 2) compares the source with the target data model. It describes in which level of detail the target system can interpret the delivered data. It gives an impression how good the understanding of the whole data in the target tool can maximal be. Every tool uses its own data modal for storing its data. If the data models are equal, or the source data model is an element of the target data model it is ideal. With this scale factor it is possible to give a forecast about the expected minimal data loss.
all mapped
SE U = SE
U Estimated Data Loss
SEall Number of all entity from source
SEmapped Number of map-able entities from source U=1 If SEall=SEmapped
(1) Estimated Data Loss
The “Implementation Level” and the “Estimated Data Loss” are static values, that are already available before the data transformation. They are not directly relevant for the data integration strategy, but they give an indicator about the trustworthiness of the delivered data.
4.3 The Definition Section
Units of Functions (UoF) are a collection of application objects and their relationships that defines one or more concepts within the application context such that removal of any component would render the concepts incomplete or ambiguous [ISO, 1994]. A new trend in the standardisation of data models (e.g. in ISO 10303) is to modularise the so called Application Protocols in sub data models, that are compatible with other models from other domains. The modules are like Units of Functions. This cluster is the first indicator for the effective size of data loss. It indicated which module or UoF has no or a restricted representation in the target data model.
With this field the data loss can be documented.
Tables: This section gives information on table level about which tables are mapped. With this field the data loss can be documented.
(Source tool) Entity ID is an identifier. It is a character or group of characters used to identify or name an item of data and possibly to indicate certain properties of that data (ISO 2382/4). This section provides detailed information about the transformed data. In this section the cognitive and the naming heterogeneity can be documented.
With this field the data loss and different levels of abstractions can be documented.
In the Referenced Files sections the files are listed, that were intended to send. This list is compared with the files that actually were attached.
Business Errors are operating rule/policy that are agreed by the involved organisations and the transferred data has to comply with, e.g. invalid authority, work authorisation is missing, invalid area type, authority is already closed, …
Known Bugs, it is very difficult to perform a mapping from a well-known global database schema to a tool data model if the tool provider hides the proprietary data model. It is also recommended to reconsider the established mapping during the implementation as new experience is gained, by e.g. the known bugs sections. This section is during the testing and development of the interfaces very useful. It improves the quality of the interface especially if it is necessary to develop it by trial and error [Eckert, 2003].
The likeliest causes for Semantic Errors are that the detailed structure of the definition doesn't correspond to what is allowed by the specialization in use, or that the definition is inconsistent. It has to assure, that data sent in an exchange message have the same meaning in the sending environment as the receiving environment after import.
With this field the semantic Information loss and schematic discrepancies can be documented.
Syntax Errors occur frequently, e.g. if the user have not filled correctly the source database with data. In literature this error is described as missing “Data Quality”. This section also assures, that errors within the mapping processor in import or export due to wrong syntax of the data- files are prevented.
Warnings could be a syntactical change like splitting of a structure into two parts or replacing an integer into a real one. A structural change of the data is also documented into the warnings like the transformation of a 3D representation into a 2D representation.
With this field the scale, structural and representation error can be documented.
4.4 Discussion
The limitation of the report is e.g. certain prediction hold (e.g. the sum of expense in each department is less than or equal to the department budget). The transformation report cannot control project internal requirements. Also possible problems of different graphical representation of the design data in different case tools cannot be solved. For example the graphical representation of the design objects in the tools Statemate and Teamwork differs. In Statemate the basic symbols are rectangles while in Teamwork basic symbols are circles.
Because of that the proportion of shapes, text, workspace etc. differs. The tools use different predefined symbols that are unknown in other tools. A critical point in the data models is how the graphical information is stored, e.g. absolute position information of model objects versus relative position information. Another solution could be, that the interfaces have to be improved for the graphical representation topic. If we look at tools for designing printed circuit boards, they use sophisticated algorithm for improving the graphical representation. The results of this algorithm are much better than a human being can attain. The third, but unrealistic solution is, that all tools support the same graphical representation, as suggested in the UML 2.0 or Systems Modelling Language (SysML, www.sysml.org) initiative. Then all tools support an agreed set of symbols and it is no longer necessary to define mappings between different symbols like circles (Teamwork) and rectangular (Statemate).
It is difficult to guarantee that information changed in one tool does not inadvertently reduce the quality of another tool already stored in the repository or that affected processes or tools. The transformation report cannot clarify the neighbourhood and side effects of the imported entities because it has no knowledge about what already exists in the repository. This is information that is also of interest for an integration strategy but is not available. There are two solutions to compensate for this side effect so that new integrated data does not pollute the existing data.
The first solution is to copy the whole rules and restrictions from the source tool to the target tool. In most cases, this task is too complex. The easiest way is to use a neutral data model of high quality for the source.
Another decision criteria for collecting the data from different tools / databases and integrating the data on one single repository are the costs for this undertaking. Benefits are reduced personnel cost due to faster data trans fer and reduced costs for manual error handling. On the other side there are costs for developing such an interface and framework and costs for using data transfer devices and environments.
4.5 Conclusion
The quality of data exchange can be significantly improved when the results of the individual steps of the trans formation process are well documented. With the transformation report the user can gain a clear understanding of the data itself and, secondly, properly focused information to help determine a suitable data integration strategy for use in a repository. In a sequential file based data exchange between different tools data loss cannot be precluded. This reduces the benefits of an automated interface dramatically. The data export form one tool to another tool is processed in several steps. At every step errors can occur, that should be logged, e.g. semantic errors, syntax errors, hurt business rules. A solution could be a standardized and machine interpretable transformation or mapping report. The benefits for such a report are:
• Worthiness and confidence of the delivered data
• Documentation of data loss
• Bill of delivered data
• Minimized error propagation
• History of data
• Constraint violations
• Handshaking function for data integration
The transformation report traces data exchange actions and is a precondition for data integration strategy to improve quality of exchanged information. The described report is not tool specific and therefore it is suggested to be a part in the framework of ISO standards, e.g.
“Industrial automation systems and integration” (ISO/TS 18876). The structure of the transformation report is generic, so it is easy to use the report without any adaptation for all kinds of data transformations.
Acknowledgement
Special thanks to Dr. Wolfgang Mansel for the support and helpful discussions in connection with this document.
5. Reference
[Batini, 1986] C. Batini, M. Lenzerini and S. B. Navathe. A Comparative Analysis of Methodologies for Database Schema Integration, ACM Computing Surveys, 18(4):323-364, 1986.
[Eckert, 2003] R. Eckert, G. Johansson, Experiences from the use and development of ISO 10303-233 Interfaces in the systems Engineering Domain, ICE 2003, June 2003, S. 501-508
[Garia-Salaco 1996]
Garia-Salaco, M., Saltor, F. Castellos, M. Semantic heterogeneity in multidatabase systems. Object-Oriented Multidatabase Systems: A Solution for Advanced Applications, chapter 5, p 129-202. Prentice-Hall, 1996
[He, 2003] B. He and K. C.-C. Chang. Statistical Schema Matching across Web Query Interfaces. In SIGMOD 2003.
[Kim, 1991] Kim, W., Seo, J., Classifying schematic and data heterogeneity in multidatabase systems. IEEE Computer, 24(12):12-18
[Krishnamurthy, 1991]
Krishnamurthy, R., Litwin, W., Kent, W., Language features for interoperability of databases with schematic discrepancies. In Proceedings of the ACM SIGMOD Conference, pages 40-49., 1991
[Lomax, 1977] Lomax, J.D, Data Dictionary Systems. Rochelle Park, N.J.: NCC Publications, 1977
[Naiman, 1995] Naiman, C.F, Ouskel, A. M., A classification of semantic conflicts in heterogeneous database systems. J. of Organizational Computing, 5(2):
167-193, 1995
[Rahm, 2001] E. Rahm and P. A. Bernstein. A Survey of Approaches to Automatic Schema Matching, VLDB Journal 10(4):334-350, 2001.