A D V A N C E S I N C I C H L I D R E S E A R C H I I I
An exploration of the links between parasites, trophic ecology, morphology, and immunogenetics in the Lake Tanganyika cichlid radiation
Britta S. Meyer .Pascal I. Hablu¨tzel .Anna K. Roose .Melinda J. Hofmann . Walter Salzburger .Joost A. M. Raeymaekers
Received: 15 February 2018 / Revised: 2 October 2018 / Accepted: 12 October 2018 / Published online: 26 October 2018 ÓThe Author(s) 2018
Abstract Differences in habitat and diet between species are often associated with morphological differences. Habitat and trophic adaptation have therefore been proposed as important drivers of speciation and adaptive radiation. Importantly, habitat and diet shifts likely impose changes in exposure to different parasites and infection risk. As strong selective agents influencing survival and mate choice, parasites might play an important role in host diver- sification. We explore this possibility for the adaptive
radiation of Lake Tanganyika (LT) cichlids. We first compare metazoan macroparasites infection levels between cichlid tribes. We then describe the cichlids’
genetic diversity at the major histocompatibility complex (MHC), which plays a key role in vertebrate immunity. Finally, we evaluate to what extent trophic ecology and morphology explain variation in infection levels and MHC, accounting for phylogenetic rela- tionships. We show that different cichlid tribes in LT feature partially non-overlapping parasite communi- ties and partially non-overlapping MHC diversity.
While morphology explained 15% of the variation in mean parasite abundance, trophic ecology accounted for 16% and 22% of the MHC variation at the nucleotide and at the amino acid level, respectively.
Parasitism and immunogenetic adaptation may thus add additional dimensions to the LT cichlid radiation.
Guest editors: S. Koblmu¨ller, R. C. Albertson, M. J. Genner, K. M. Sefc & T. Takahashi / Advances in Cichlid Research III:
Behavior, Ecology and Evolutionary Biology
Electronic supplementary material The online version of this article (https://doi.org/10.1007/s10750-018-3798-2) con- tains supplementary material, which is available to authorized users.
B. S. Meyer (&)W. SalzburgerJ. A. M. Raeymaekers Zoological Institute, University of Basel, Vesalgasse 1, 4051 Basel, Switzerland
e-mail: britta-meyer@gmx.de B. S. Meyer
Evolutionary Ecology of Marine Fishes, Helmholtz Centre for Ocean Research Kiel, GEOMAR, Du¨sternbrooker Weg 20, 24105 Kiel, Germany Present Address:
B. S. Meyer
Max Planck Institute for Evolutionary Biology, Max Planck Research Group Behavioural Genomics, August-Thienemann- Str. 2, 24306 Plo¨n, Germany
P. I. Hablu¨tzelA. K. RooseJ. A. M. Raeymaekers Laboratory of Biodiversity and Evolutionary Genomics, University of Leuven, Ch. Deberiotstraat 32,
3000 Louvain, Belgium Present Address:
P. I. Hablu¨tzel
Flanders Marine Institute, Wandelaarkaai 7, 8400 Ostend, Belgium
M. J. Hofmann
Department of Biodiversity and Evolutionary Biology, Museo Nacional de Ciencias Naturales, CSIC, Calle Jose´
Gutie´rrez Abascal 2, 28006 Madrid, Spain https://doi.org/10.1007/s10750-018-3798-2(0123456789().,-volV)(0123456789().,-volV)
Keywords ParasitesMacroparasitesTrophic ecologyMorphologyImmunogenetics
Introduction
Adaptive radiations of vertebrates belong to the most powerful model systems for the study of adaptation and diversification (Kornfield & Smith, 2000; Sch- luter, 2000; Berner & Salzburger, 2015). Sudden bursts of diversification often occur in newly emerging environments such as islands or lakes, which can offer colonizers a broad range of unoccupied niches in terms of habitat properties and food availability (Losos, 2010; Wagner et al.,2012). These bursts are promoted by natural selection on ecologically relevant traits such as body size and shape, trophic morphology, visual, acoustic and olfactory communication, and behavior (Rundell & Price, 2009; Schluter, 2009;
Nosil,2012). Sexual selection on mate choice behav- ior and ornamental traits is thought to further contribute to diversification (Salzburger,2009; Wag- ner et al., 2012). It has been suggested that diversi- fication in habitat use, trophic specialization, and the evolution of mating preferences represent the major axes of diversification underlying vertebrate adaptive radiations (Danley & Kocher, 2001; Streelman &
Danley, 2003). These three axes may be tightly entangled, and pleiotropic interactions among genes or traits under both natural and sexual selection can accelerate speciation (‘‘magic trait’’ principle) (Gavri- lets,2004; Servedio et al.,2011).
Parasites represent an important selection pressure, which is predominant in all living animals, and which may lead to strong evolutionary interactions (De- caestecker et al.,2013). Parasites have therefore also received attention in speciation research (Kaltz &
Shykoff, 1998; Buckling & Rainey,2002; Summers et al., 2003; Eizaguirre & Lenz, 2010; Karvonen &
Seehausen, 2012). Parasite-induced speciation requires divergent parasite communities, adaptation to these parasite communities, and evolution of reproductive isolation (Karvonen & Seehausen, 2012). Specialization in habitat use has been shown to significantly affect exposure to parasites (Johnson et al.,2009; Matthews et al., 2010; Karvonen et al., 2013,2018), and shifts in trophic niche may lead to changes in parasite transmission (Knudsen et al.,2010;
Hablu¨tzel et al., 2017; Karvonen et al., 2018).
Following adaptive divergence in allopatry, exposure of migrants to novel parasite communities may lead to reduced fitness and promote the evolution of prezy- gotic barriers (Nosil et al., 2005; MacColl & Chap- man, 2010). Similarly, hybrids occurring in intermediate habitats or migrants between parental habitats face selective pressure of both parental parasite communities and hence could suffer from higher infection burdens (Hja¨lte´n, 1998; Fritz et al., 1999; Wolinska et al.,2006). Furthermore, introgres- sion can create changes in the genetic background of resistance in hybrid offspring and thus increase parasite susceptibility. The reduced individual fitness can consequently lead to post-zygotic reproductive isolation (Karvonen & Seehausen,2012). However, in some cases hybridization can lead to increased evo- lutionary adaptability due to additive effects of both parental species (Fritz et al.,1999; Seehausen,2004).
Finally, magic traits simultaneously involved in parasite defense and mate choice can further mediate adaptive divergence and the evolution of reproductive isolation (MacColl,2009). Parasite burden can influ- ence mating cues such as coloration and thus mating preferences (Hamilton & Zuk, 1982; Maan et al., 2008). This happens because male condition and disease resistance are under sexual selection, as infected individuals may appear less attractive as prospective mates (Adamo & Spiteri, 2009; Beltran- Bech & Richard,2014).
Defense mechanisms against parasites range from behavioral mechanisms such as avoidance and clean- ing behavior to molecular mechanisms. Among the latter, vertebrates have evolved a highly specific and efficient immune system based on antigen recognition referred to as adaptive immunity (Cooper & Alder, 2006; Flajnik & Kasahara, 2010). This system includes the major histocompatibility complex (MHC). Some proteins encoded by genes of the MHC play a central role by binding and presenting Present Address:
M. J. Hofmann
Museo de Zoologı´a, Pontificia Universidad Cato´lica del Ecuador, Av. 12 de Octubre 1076, Quito, Ecuador Present Address:
J. A. M. Raeymaekers
Faculty of Biosciences and Aquaculture, Nord University, 8049 Bodø, Norway
parasite-derived antigens to T cell receptors (Janeway, 2005). As antigen-binding can be highly specific, MHC genes evolved into one of the most polymorphic gene families of the vertebrate genome (Garrigan &
Hedrick,2003). In teleost fishes, the MHC is spread over three chromosomes. One chromosome contains the MHC class I, whereas the MHC class II loci are spread across two different chromosomes, called class IIa and class IIb genes. Each of these regions encompasses two separate subclasses of genes, the MHC class II A and B genes, coding for two different chains within the MHC molecules. In teleost fishes, the class IIagenes are more conserved than the class IIb genes. In cichlids, both groups of genes have oftentimes undergone several duplication events (Sato et al., 2012; Hablu¨tzel et al., 2013; Hofmann et al., 2017). MHC evolution is typically characterized by high standing variation (Sommer,2005), positive and balancing selection (Hughes & Nei, 1988, 1989;
Bernatchez & Landry, 2003), gene duplication and loss (Ma´laga-Trillo et al.,1998; Nei & Rooney,2005), and extensive trans-species polymorphism (Klein et al.,2007). Interestingly, the MHC has been shown to act as a mate choice cue in several vertebrate species (Milinski, 2006; Piertney & Oliver, 2006; Kamiya et al.,2014). Due to this pleiotropic role of the MHC, diverging host populations adapting to contrasting parasite communities might simultaneously evolve reproductive isolation (Eizaguirre et al., 2009; Eiza- guirre & Lenz,2010).
The adaptive radiations of cichlids from the three East African Great Lakes (Lake Tanganyika, Victoria, and Malawi) represent important model systems to unravel causes of biological diversity and mechanisms of diversification (Kocher,2004; Salzburger & Meyer, 2004; Seehausen,2006; Salzburger,2009,2018; Maan
& Seehausen, 2011). The approximately 250 cichlid species from Lake Tanganyika (LT) are genetically and morphologically very diverse and consist of 12–16 different morphological lineages (Salzburger et al., 2002; Koblmu¨ller et al.,2008; Meyer et al.,2016). The other two hotspots, Lake Victoria and Lake Malawi, harbor hundreds of cichlid species belonging to the haplochromine tribe (Salzburger & Meyer, 2004;
Joyce et al., 2011; Wagner et al., 2013). This enormous biodiversity can be partially explained by the palaeohydrological history and ecological oppor- tunities (Salzburger et al., 2014), combined with sexual selection (Wagner et al.,2012). Cichlids have
been suggested to have diverged along the three aforementioned major axes of diversification (adapta- tion to macrohabitats, diversification along feeding gradients, and mating preferences) (Danley & Kocher, 2001), though the chronology of these stages of diversification is under debate (Muschick et al.,2014).
A number of studies have investigated the impor- tance of parasites and immunogenetics in fish and cichlid diversification (Vanhove et al., 2016; Malm- strøm et al. 2016). First, differentiation in parasite communities has been related to differences in mor- phology, trophic ecology, and evolutionary history of cichlid host species (Blais et al.,2007; Hablu¨tzel et al., 2016; Hayward et al., 2017). At the intra-specific level, such differentiation has also been described between allopatric populations, suggesting that para- sites may represent a divergent selective force pro- moting divergence in allopatry (Raeymaekers et al., 2013; Gre´goir et al., 2015; Hablu¨tzel et al., 2016).
Second, extensive diversity and variation in MHC gene pools has been observed among cichlid species and populations (Klein et al.,1993; Ono et al.,1993;
Ma´laga-Trillo et al., 1998; Blais et al., 2007; Sato et al., 2012; Hablu¨tzel et al., 2013, 2016; Hofmann et al., 2017). Dissimilarities in parasite community composition concur with differentiation of MHC class II genes in closely related cichlid species living in sympatry (Blais et al.,2007), as well as in allopatric populations within species (Hablu¨tzel et al., 2016).
These results suggest a role for immunogenetic adaptation in cichlids. Individual MHC diversity has also been linked to variation in fat reserves, suggesting a relevant role of the MHC for host body condition (Hablu¨tzel et al.,2014). Third, a study by Maan et al.
(2008) suggested that parasite-mediated sexual selec- tion might contribute to the divergence of female mating preferences for male coloration, strengthening reproductive isolation. Together, these results indicate that the major axes of diversification (adaptation to macrohabitats, diversification along feeding gradients, and mating preferences) are potentially associated with exposure to different parasites or shifts in infection risk.
While these studies consider the possibility of parasite-driven diversification in cichlids between populations and closely related species, no study has investigated the potential contribution of parasitism to a cichlid adaptive radiation. Here, we explore this possibility for the adaptive radiation of LT cichlids.
We base our analysis on a sample of 32 species across the tribes, which is about 12% of the LT cichlid species diversity. We first evaluated macroevolution- ary relationships between trophic morphology, trophic ecology, and parasitism within LT cichlids. We expected different macroparasite communities among species, possibly between algae and invertebrate feeders (i.e., species that shifted in diet), or between generalists and sand and rock dwelling species (i.e., species that shifted in habitat) (Hablu¨tzel et al.,2017;
Hayward et al.,2017). Second, we tested whether the species evolved immunogenetic differences by screen- ing several loci of teleost MHC class IIB genes. To achieve these goals, data by Muschick et al. (2012) on the trophic morphology and ecology of LT cichlids were combined with new parasitological and immuno- genetic data.
Materials and methods
Field sampling and laboratory work Parasitological survey
For the parasitological survey, 23 cichlid species were screened for metazoan ecto- and endoparasites (Sup- plementary Table 1). Sampling was conducted at Toby’s place on the Zambian shoreline of Lake Tanganyika. While most fish species were obtained in August 2012, Simochromis diagramma(Gu¨nther, 1894) and Haplotaxodon microlepis (Boulenger, 1906) were captured in August 2011 and July 2013, respectively. One species, Astatotilapia burtoni (Gu¨nther, 1894), was obtained in July 2013 at Kapata, which is about 20 km southward. About 7–18 indi- viduals per species (usually ten) were caught by chasing fish into standing nets (Supplementary Table 1). After capture, the fish were kept in tanks
of 0.8 m90.8 m91.2 m depth or
0.8 m90.8 m 92 m depth. Before usage, tanks were cleaned, dried, and filled with lake water.
All fish were dissected in the field within 4 days post-capture. The day of dissection (0, 1, 2, or 3 days after capture) was recorded in order to keep track of changes in parasitological parameters while the fish were kept in the tanks. Individual fish were killed with an overdose of MS222. The parasitological survey consisted of three parts. First, the outer surface and the
mouth cavity of the fish were inspected for ectopar- asitic monogeneans and crustaceans (copepods, branchiurans, isopods), bivalves, and any kind of helminthic cysts. Second, the four gill-branches on the left were dissected and stored in 100% analytical ethanol (EtOH), and later in the lab screened for ectoparasitic monogeneans, crustaceans (copepods and branchiurans), bivalves, and any kind of hel- minthic cysts. Third, fish were screened for intestinal monogeneans, digeneans, acanthocephalans, nema- todes, and any kind of helminthic cysts. To do so, stomach, intestines, gall and urinary bladder were dissected and inspected in a petridish with lake water.
Finally, the sex of the fish was determined by visual inspection of the genital papilla and gonad development.
The parasitological survey was performed with a stereomicroscope and by multiple observers. Obser- vers were recorded in order to keep track of observer bias. A single observer screened the outer surface and the mouth cavity of the fish. The number of observers varied between years for gills and intestines (gills: two observers in each year; intestines: three, four, and one observer(s) in 2011, 2012, and 2013, respectively). All parasites were counted and identified to genus or class level and preserved as follows: Monogeneans were isolated using dissection needles and were either mounted on slides in ammonium picrate glycerine for further morphological characterization, or stored in 100% EtOH. Acanthocephalans and nematodes were stored in 80% EtOH, while intestinal monogeneans, branchiurans, copepods, any kind of helminthic cysts, bivalves, and unknown groups were stored in 100%
EtOH.
Analysis of MHC diversity
MHC loci are traditionally designated by a three-letter code and an Arabic number (e.g., DFB2). Whereas the first letter (D) designates the MHC class II gene, the second and third letters indicate the genomic region (letter code A–Z) and the subclass (A or B), respec- tively. A consecutive Arabic number defines the locus identity. Here, we focused on the MHC class II genes of the subclass b and only on the genes for the beta chain, which are located in the five genomic regions defined by (Sato et al.,2012) and which were named DBB-DFB. The genetic diversity of the MHC class II
Bgenes within and among different LT cichlid tribes was analyzed for 26 species (Supplementary Table 1).
The sampling was conducted in the years 2007 and 2013 at the shoreline of Lake Tanganyika between Mpulungu and Kalambo River, independently from the parasite screening, using a standard sampling procedure (Muschick et al.,2012). From each species, between 5 and 16 individuals were used for genotyp- ing, which allowed us to characterize the most common variants present in each species (Supple- mentary Table 1). The same fish samples were used as in Meyer et al. (2016).
Due to the extreme polymorphism of MHC genes, especially in cichlids (Klein et al., 1993; Figueroa et al.,2000; Blais et al.,2007; Hofmann et al.,2017), it is notoriously difficult to obtain primers that can amplify all MHC loci within a single species, and presumably impossible to obtain primers that amplify all MHC loci across a wide range of species like the ones in this study. For this reason, we opted to use primers that amplify a subset of MHC loci in all species that we sampled, allowing our results to be comparable across species despite not amplifying the full diversity of MHC. For the amplification of these cichlid MHC loci, the forward primer TU383
(CTCTTCATCAGCCTCAGCACA; annealing
upstream at the end of exon 1) and the reverse primer
TU377 (TGATTTAGACAGARKGKYGCTGTA;
annealing in exon 2 at base pair 248) (Ono et al., 1993) were used. This primer pair is known to amplify intron 1 and exon 2 of up to 17 homology groups in cichlids (Ma´laga-Trillo et al.,1998). In another study, up to eight expressed putative loci were found with this primer set (Blais et al.,2007). This primer pair has been successful in amplifying MHC in a wide range of cichlid species, and therefore we proceeded to the PCR without further optimization. The PCR amplifi- cation of the MHC was conducted in a final volume of 25lL of the Multiplex PCR Kit (Qiagen, Hom- brechtikon, Switzerland). Normalized DNA of the different species and sixteen MHC specific barcoded fusion primers (0.1lM of each primer) were added.
Fusion primers were synthesized at Microsynth (Bal- gach, Switzerland): the forward fusion primer is composed of the template-specific forward primer, the B-Adaptor, and the respective TCMID1–10 bar- codes. Reverse primer is composed of the template- specific reverse primer and the A-Adaptor. In order to obtain sufficient amplicon product for further
sequencing steps, we utilized a high number of PCR cycles, which is generally not recommended because of the inherent possibility of artifact generations (Acinas et al.,2005; Lenz & Becker,2008). Standard- ized PCR conditions started with an initial heat activation phase (necessary for the HotStarTaq DNA polymerase) of 95°C, and continued with 35 amplifi- cation cycles consisting of 30 s of denaturation at 94°C, 90 s of annealing phase at 60°C, and an extension phase of 90 s at 72°C. The PCR was terminated with a final extension phase of 10 min at 72°C. The PCR products were purified with the magnetic bead system of Agencourt AMPure XP (Beckman Coulter, Nyon, Switzerland). The purifica- tion quality of the PCR products was assessed using the 2100 Bioanalyzer (Agilent, Basel, Switzerland) before the pyrosequencing step (454 with GS FLX system, Roche, conducted by Microsynth, Balgach, Switzerland). Our assessment does not employ all measures which can improve estimates of MHC diversity at the individual or species level (e.g., elimination of PCR artifacts through independent reaction assays, reconditioning PCR, increased elon- gation time, lower PCR cycles). However, the lack of such measures is not expected to affect our ability to compare patterns of MHC across a wide range of species, since any methodological bias is expected to be similarly distributed across the tribes.
General sequence handling
First, the generated raw reads (11,569 reads) were processed with Roche’s demultiplexing and convert- ing tools (sffinfo, sfffile) and sequences of primer annealing sites were removed. For quality filtering, we applied a filter for too short reads (B150 bp). We only allowed 1% of ambiguous bases (N) and filtered out low-quality sequences (mean C15). These sequences were imported into Geneious (6.1.6 Biomatters Ltd., www.geneious.com) and de novo assembled (with custom sensitivity: minimum overlap identity of 95%
and maximum ambiguity 4 using all reads from one species. This resulted in contigs of single individuals with highly identical reads (pairwise identity: median 99.50%) and contigs of several individuals sharing these reads (pairwise identity: median 99.40%). The coverage ranged from 2 to 131 for single individual contigs and 2–337 reads for contigs originating from multiple individuals. We also kept low coverage
contigs as we use our data for measuring genetic diversity among tribes and not for investigating functionality or selection processes (indicated with suffix ‘‘low’’ in the alignment). However, if more than 3 bp of a read were different than the rest of the contig, the read was excluded. Also singletons, which differed dramatically (C10 mutations) to other contigs, were removed from the data set (readsN= 517). Consensus sequences were generated within Geneious using 50%
strict rule from each contig and for each individual.
Most homopolymer regions were correctly called with these settings. Ambiguous positions were coded according to IUPAC rules. The obtained variants were aligned using MAFFT (–auto; 200PAM/k = 2, 1.53 open penalty/0.123 offset) (Katoh & Standley,2013), and insertions of ambiguous positions, homopoly- mers, and misalignments were manually checked.
This resulted in an alignment of 751 base pairs con- taining both intronic and exonic regions. A blast search of the alleles led to the exclusion of further sequences (removed contigsN= 266). In a next step, we shortened the alleles to exon 2 only, in order to (i) reduce our data set to coding nucleotides and (ii) to reduce the amount of missing data and ambiguities.
This resulted in a total number of 844 MHC exon 2 variants of 160 bp.
Specific data analysis
We here limit our statistical inference to the compar- ison between tribes (relative to the variation among species within tribes), rather than to a comparison among species (relative to the variation among individuals within species). For this exploratory study this is an appropriate choice, since the tribes represent the most important evolutionary branches of the LT radiation. As such, within our dataset representing a sample of 32 species across the tribes, we consider the species level (rather than the individual level) as the statistical unit. Analyses first aimed at the comparison of MHC diversity and parasite infection levels.
Subsequently, in order to evaluate to what extent infection levels and immunogenetic divergence mirror adaptive radiation, we explore the relationships of these data with data on body shape, trophic morphol- ogy (pharyngeal jaw shape), and trophic ecology (diet and stable isotope signatures), available from Muschick et al. (2012) (Supplementary Table 1).
MHC diversity and differentiation
Immunogenetic diversity per species and immuno- genetic differentiation between species was estimated with the software package MEGA (v.7) (Tamura et al., 2011). This was done for a set of 844 MHC variants, i.e., after excluding species with a very low amount of total MHC reads (Supplementary Table 1). Immuno- genetic diversity was quantified as the average evo- lutionary divergence over sequence pairs within species. Ambiguous positions were eliminated in a complete comparison. The average evolutionary diversity was then subjected to a Kruskal–Wallis ANOVA to test for differences in MHC diversity between tribes.
In order to quantify immunogenetic differentiation, we calculated genetic distances between species on the basis of MHC variants of each species as a between group average. Specifically, we estimated the distance (uncorrected p-distance, complete deletion of missing data in the comparison) of the nucleotides of the exon (first, second, and third codon together; 143 positions).
In addition, we calculated the distance of amino acid sequences using the Jones–Taylor–Thornton (JTT) model. This empirical substitution model corrects for multiple substitutions based on a model for amino acid substitutions using the substitution-rate matrix (Jones et al.,1992).
Phylogenetic distances
In order to account for the phylogeny in the analyses (see below), phylogenetic distances between the species were quantified by calculating genetic dis- tances (uncorrected p-distances, pairwise deletion) based on sequences of 42 nuclear genes (17,545 nucleotides) from Meyer et al. (2015).
Parasites versus trophic ecology, morphology, and isotope signatures
The analyses of infection levels were performed in the statistical package R (R Core Team,2014). Prevalence and mean abundance were calculated for each group of parasites and each host species following the termi- nology of Ro´zsa et al. (2000). A MANOVA was used to test for differences in infection levels (quantified either as prevalence or mean abundance) between cichlid tribes for all parasite groups together.
Subsequently, Kruskal–Wallis ANOVAs were used to test for differences in infection levels among the tribes for each parasite group separately.
The level of covariation across cichlid species between infection levels on the one hand and body shape, trophic morphology, diet and stable isotope signatures on the other hand was investigated by a Spearman rank correlation analysis. Data on body shape, trophic morphology, diet, and stable isotope signatures, available from Muschick et al. (2012) (Supplementary Table 1), were included in the anal- yses as follows. Body shape was included as the two first principal components of body shape variation (Body1 and Body2), as calculated by Muschick et al.
(2012) from a geomorphometric analysis. Likewise, trophic morphology was included using the two first principal components of lower pharyngeal jaw shape variation (LPJ1 and LPJ2), again as calculated by Muschick et al. (2012). Diet was included as propor- tional prey data, as well as the two first principal components calculated from these data (Prey1 and Prey2). The isotope signatures included carbon and nitrogen stable isotopes (d13C andd15N), which are a proxy for trophic ecology (Boecklen et al., 2011;
Muschick et al.,2012). In particular, d13C values in LT cichlids were found to be correlated with body shape clusters, whereasd15N values correlate with the shape of the lower pharyngeal jaw. As such thed13C and d15N, respectively, reflect variation between macrohabitats (e.g., benthic versus pelagic) and the relative trophic level of an organism.
To further investigate how much of the variation in infection levels (combining all parasite groups) among cichlid species could be explained by body shape, trophic morphology, diet, or isotopes, we performed a redundancy analysis (RDA). RDA is a canonical extension to PCA in which the principal components produced are constrained to be linear combinations of a set of predictor variables (Legendre & Legendre, 2012). It enables the identification of the best ordina- tion model that describes parasite community similar- ities among cichlid species. In order to account for phylogeny in this analysis, the set of predictor variables also included the first two dimensions of a classical multidimensional scaling (CMDS) analysis on the phylogenetic distances. RDA analysis was performed with the R library vegan. Significance of the proportion of variation in infection levels explained by each source of information was
calculated and tested for significance using 1000 random permutations. For each source of information, the RDA analysis was preceded by a forward selection procedure as implemented in the ‘‘packfor’’ package in R (Dray et al., 2009, 2012). Forward selection corrects for highly inflated type I errors and overes- timated amounts of explained variation.
MHC versus parasites, trophic ecology, morphology, and isotope signatures
All analyses in this section were performed separately for the MHC-based genetic distances based on the exon 2 nucleotide sequences (143 bp) and the trans- lated amino acid sequences (using JTT model). First, a permutational ANOVA on the MHC-based genetic distances was performed to test for significant differ- ences in MHC profiles between tribes. A CMDS analysis was then used to convert these MHC-based genetic distances into a set of coordinates (dimen- sions) for further analyses. The first (MHC dimension 1) versus second (MHC dimension 2) dimension of these CMDS analyses were first plotted to visualize the immunogenetic differences between cichlid spe- cies and tribes. Variation in MHC profiles among species was further visualized in a cluster diagram using the UPGMA criterion based on MHC distances.
We then investigated the relationships across cichlid species between these MHC dimensions and infection levels, body shape, trophic morphology, diet, and stable isotope signatures by means of a Spearman rank correlation analysis. Finally, RDA analyses were performed to investigate how much of the variation in MHC dimensions (MHC dimension 1 and MHC dimension 2) could be explained by infection levels, body shape, trophic morphology, diet, isotopes, or phylogeny. As above, significance of the proportion of variation in MHC dimensions explained by each source of information was calculated and tested for significance using 1000 random permutations, and for each source of information, the RDA analysis was preceded by a forward selection model procedure.
Note that the subset of cichlid species for which parasite data were available was smaller than the subset for which body shape, trophic morphology, diet, and stable isotope data were available. Therefore, the Spearman rank correlation analysis as well as the RDA analyses were performed separately for these subsets.
Results
Parasites versus trophic ecology, morphology, and isotope signatures
MANOVA revealed significant differences between LT cichlid tribes for the prevalence of metazoan ecto- and endoparasites (Wilks’ lambda = 0.0066, F40,28 = 1.96, P= 0.0322). These differences were mainly due to the prevalence of acanthocephalans, which was high in Tropheini, intermediate in Ectodini, and low in Lamprologini and Perissodini, as well as to the prevalence of digeneans which was high in Ectodini (Table1; Fig. 1; Supplementary Table 5).
There was no multivariate difference between the tribes for the mean abundance of parasites (Wilks’
lambda = 0.027, F40,28= 1.12, P= 0.38). However, univariate tests revealed high values for acantho- cephalans and Cichlidogyrus sp. in Tropheini, inter- mediate values in Ectodini, and low values in Lamprologini and Perissodini, while the abundance of digeneans was high in the Ectodini (Table1; Fig.1;
Supplementary Table 6). A two-dimensional (PCA- based) representation of parasite communities (Fig.2) revealed partially non-overlapping parasite commu- nities in the Lamprologini and Tropheini, while
parasite communities in the Ectodini show similarities with both the Lamprologini and the Tropheini.
Spearman rank correlations revealed that infection levels across cichlid species were correlated with morphology and diet (Supplementary Table 2). For instance, the prevalence of acanthocephalans was correlated with LPJ shape (PC1; Fig.3a) and increased with the proportion of aufwuchs in the diet (Fig.3b), while the prevalence of Cichlidogyrussp.
correlated with body shape (PC2) (Fig.3c). Spearman rank correlations with mean abundance confirmed these results (Supplementary Table 2), and also revealed an increase ofErgasilussp. with the propor- tion of arthropods in the diet (Fig. 3d).
Forward selection followed by RDA identified a significant effect of body shape (PC2) on the entire parasite community, accounting for 15% of the variation in mean abundance after controlling for phylogenetic relationships (RDA: F2,13= 2.72;
P = 0.041). Other variables accounting for trophic ecology, morphology, or isotope signatures were not selected in these models. No models explained significant variation in prevalence.
MHC versus parasites, trophic ecology, morphology, and isotope signatures
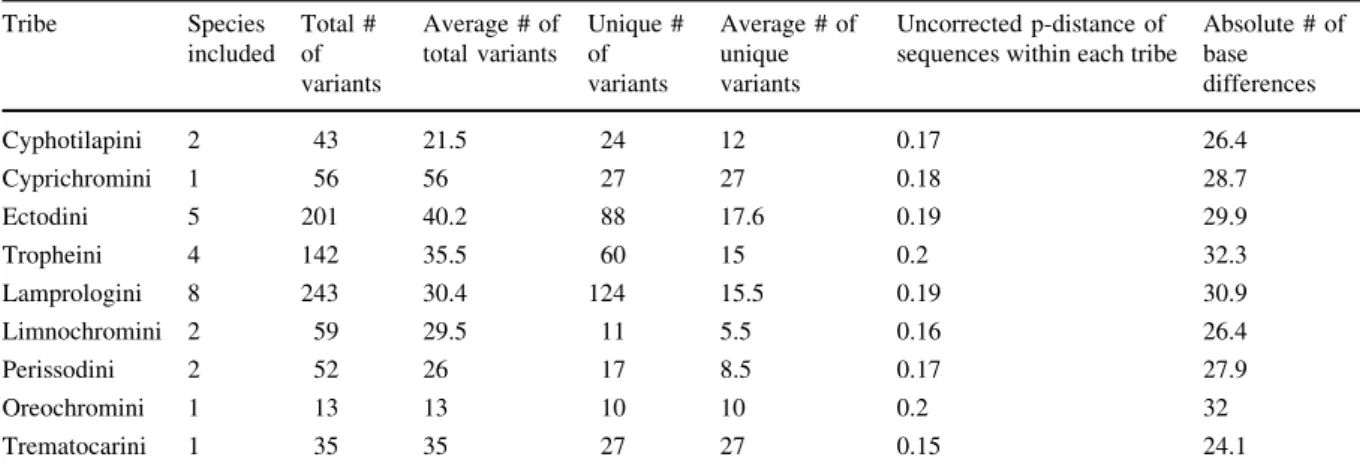
In 316 individuals from 26 different species we identified 844 variants in total, of which 388 are unique variants. Averaged across all tribes, we thus find 93.8 variants in total and 43.1 unique variants per tribe. Overall, we find an average of 14.9 variants per species, which was represented by on average 12.2 individuals. Per individual we have sequenced one to nine (mean 2.6) variants. The overall genetic distance within the three major tribes, namely the Lampro- logini, the Ectodini, and Tropheini, was very similar (ranging around 0.2) (see Tables2,3). ANOVA did not reveal any significant differences in MHC diver- sity (based on average evolutionary divergence) among tribes (v2= 13.226,df= 8,P= 0.103).
MHC dissimilarities between cichlid species could be attributed to tribe (nucleotide level of exon 2:
F8,16= 1.46;P= 0.013;R2= 0.42; amino acid level:
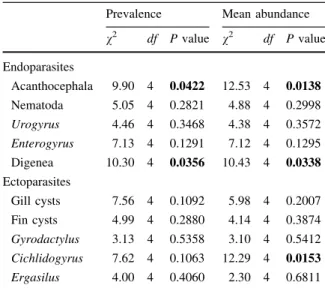
Table 1 Non-parametric (Kruskal–Wallis) ANOVA on the prevalence of metazoan ecto- and endoparasites between five Lake Tanganyika cichlid tribes
Prevalence Mean abundance v2 df Pvalue v2 df Pvalue Endoparasites
Acanthocephala 9.90 4 0.0422 12.53 4 0.0138
Nematoda 5.05 4 0.2821 4.88 4 0.2998
Urogyrus 4.46 4 0.3468 4.38 4 0.3572 Enterogyrus 7.13 4 0.1291 7.12 4 0.1295
Digenea 10.30 4 0.0356 10.43 4 0.0338
Ectoparasites
Gill cysts 7.56 4 0.1092 5.98 4 0.2007
Fin cysts 4.99 4 0.2880 4.14 4 0.3874
Gyrodactylus 3.13 4 0.5358 3.10 4 0.5412 Cichlidogyrus 7.62 4 0.1063 12.29 4 0.0153 Ergasilus 4.00 4 0.4060 2.30 4 0.6811 SignificantPvalues are in bold
Fig. 1 Prevalence (top) and mean abundance (bottom) of tenc groups of endo- and ectoparasites by cichlid tribe.EcEctodini, ErEretmodini,LaLamprologini,PePerissodini,TrTropheini
Acanthocephala Cichlidogyrus sp. Digenea Enterogyrus sp. Ergasilus sp.
Fin cysts Gill cysts Gyrodactylus sp. Nematoda Urogyrus sp.
0.00 0.25 0.50 0.75 1.00
0.00 0.25 0.50 0.75 1.00
Ec Er La Pe Tr Ec Er La Pe Tr Ec Er La Pe Tr Ec Er La Pe Tr Ec Er La Pe Tr
Tribe
Prevalence
Acanthocephala Cichlidogyrus sp. Digenea Enterogyrus sp. Ergasilus sp.
Fin cysts Gill cysts Gyrodactylus sp. Nematoda Urogyrus sp.
0 10 20 30 40
0 10 20 30 40
Ec Er La Pe Tr Ec Er La Pe Tr Ec Er La Pe Tr Ec Er La Pe Tr Ec Er La Pe Tr
Tribe
Abundance
F8,16= 2.52;P= 0.003;R2= 0.56), but with a lower proportion of variation than for phylogenetic dissim- ilarities between species (F8,16= 51.75; P= 0.001;
R2= 0.96). Accordingly, a two-dimensional (MDS- based) representation of MHC dissimilarities between cichlid species revealed partial overlap between the three largest tribes (Tropheini, Ectodini, and Lampro- logini) at the nucleotide level of exon 2 as well as the amino acid level (Fig.2f, g). The MHC profiles of the two species belonging to the Limnochromini were distinct from other tribes, especially at the amino acid level (Fig.2g). The position of Limnochromini at the root of the MHC differentiation is confirmed by a (UPGMA-based) cluster analysis at the amino acid level, but not at the nucleotide level, where synony- mous mutations are also taken into account (Supple- mentary Fig.1).
Spearman rank correlations revealed relationships between the first and second MHC dimension and trophic ecology and infection levels, but not between MHC and morphology (Fig.3; Supplementary Tables 3 and 4). At the amino acid level, MHC
dimension 2 decreased with the proportion of sand (Fig.3e) and molluscs (Fig.3f) in the diet, and increased with the prevalence and mean abundance of nematodes (Fig. 3i). For the nucleotide level of exon 2, MHC dimension 1 increased with feeding on molluscs (Fig.3g) and with the prevalence of acan- thocephalans (Fig.3k). MHC dimension 2 for nucleo- tide level of exon 2 decreased with feeding on fish eggs (Fig.3h), and increased with infection levels of nematodes (Fig.3j) and gill cysts (Fig.3l).
Forward selection followed by RDA on MHC dimension 1 and MHC dimension 2 identified a significant effect of the prevalence of nematodes on MHC divergence after controlling for phylogenetic relationships. The model explained 30% of the vari- ation at the nucleotide level (RDA: F1,10= 5.15;
P = 0.01). Yet, none of the infection parameters explained significant variation at the MHC amino acid level. Feeding on sand explained 16% of the MHC variation at the nucleotide level (RDA:
F1,21= 5.0; P= 0.006), while feeding on sand and fish eggs accounted for 22% of the MHC variation at
−0.05 0.00 0.05
−0.06−0.04−0.020.000.020.04
Body shape
Principal component 1
Principal component 2
(a)
−0.10 −0.05 0.00 0.05 0.10
−0.15−0.10−0.050.000.050.10
LPJ shape
Principal component 1
Principal component 2
(b)
−0.8 −0.6 −0.4 −0.2 0.0 0.2 0.4
−0.4−0.20.00.20.40.60.8
Stomach and gut content
Principal component 1
Principal component 2
(c)
−10 −15 −20
246810
Stable isotope signatures
δ13C δ15N
(d)
−3 −2 −1 0 1
−1012
Parasites
Principal component 1
Principal component 2
(e)
−0.04 −0.02 0.00 0.02 0.04 0.06 0.08
−0.06−0.04−0.020.000.020.040.06
MHC class II exon 2
Dimension 1
Dimension 2
(f)
−0.2 −0.1 0.0 0.1 0.2
−0.10.00.10.20.3
MHC class II amino acids
Dimension 1
Dimension 2
(g)
Lamprologini Ectodini Tropheini Cyphotilapiini Cyprichromini Eretmodini Limnochromini Perissodini Tilapiini Trematocarini
Fig. 2 Two-dimensional representations based on principal component analyses (PCA) or classical multidimensional scaling (CMDS) of morphology, trophic ecology, isotope signatures, infection levels, and MHC-based genetic divergence in Lake Tanganyika cichlids.aPCA on body shape;bPCA on LPJ shape;cPCA on proportional stomach and gut contents;
d stable isotope data (d15N versusd13C);e PCA on mean
square-root transformed abundance of parasites; f CMDS on between-species MHC classIIb B exon 2 genetic distances;
g CMDS on between-species MHC classIIb B amino acid distances. Filled triangles represent tribes for which only one species was analyzed; gray bars in d indicate t-based 95%
confidence intervals. Plota–dare based on data from Muschick et al. (2012)
Table2MHCvariantswithinthespecies:speciesnameandtribe;averageevolutionarydivergence(calculatedoversequencepairswithinspecies);numberoftotalandunique variants;numberofindividualssequenced;average,minimum,andmaximumnumbersofvariantsperspeciesandindividual;averageMHC-based(genetic)distancesofamino acidsandnucleotidesofeachspeciestotheotherspecies SpeciesTribeDivergenceTotalUniqueInd.AverageMin.Max.Distance, aminoacidsGeneticdistance, nucleotides Cyphotilapiafrontosa(Boulenger,1906)Cyphotilapiini0.1552818162.00160.5070.187 Trematochromisbenthicola(Matthes,1962)Cyphotilapiini0.15915672.14150.5160.196 Cyprichromisleptosoma(Boulenger,1898)Cyprichromini0.1785627115.09190.5560.202 Aulonocranusdewindti(Boulenger,1899)Ectodini0.1328571.14120.4820.193 Callochromismacrops(Boulenger,1898)Ectodini0.1785719163.56190.5370.197 Grammatotrialemairii(Boulenger,1899)Ectodini0.1843822152.53140.5360.197 Ophthalmotilapiaventralis(Boulenger,1898)Ectodini0.1914825162.80240.5390.198 Xenotilapiaspiloptera(Poll&Stewart,1975)Ectodini0.1765017163.13150.5480.196 Astatotilapiaburtoni(Gu¨nther,1894)Tropheini0.18226783.25240.5210.199 Ctenochromishorei(Gu¨nther,1894)Tropheini0.2073418152.27140.5710.212 Lobochiloteslabiatus(Boulenger,1898)Tropheini0.1885519163.44160.5440.204 Tropheusmoori(Boulenger,1898)Tropheini0.1962716141.93140.5280.203 Lamprologuscallipterus(Boulenger,1906)Lamprologini0.1652112141.54130.5340.197 Lepidiolamprologuselongatus(Boulenger,1898)Lamprologini0.1867331164.56180.5420.199 Neolamprologusmodestus(Boulenger,1898)Lamprologini0.167191372.71130.5420.196 Neolamprologusprochilus(Bailey&Stewart,1977)Lamprologini0.2236651.20120.5620.202 Neolamprologuspulcher(Trewavas&Poll,1952)Lamprologini0.1933715132.85160.5670.203 Neolamprologustetracanthus(Boulenger,1899)Lamprologini0.181281383.50250.5590.200 Telmatochromisdhonti(Boulenger,1919)Lamprologini0.2083524142.50160.5630.205 Variabilichromismoorii(Boulenger,1898)Lamprologini0.1742410141.71130.5100.193 Gnathochromispermaxillaris(David,1936)Limnochromini0.162466162.88150.5600.199 Limnochromisabeelei(Poll,1949)Limnochromini0.15613571.86130.5810.203 Haplotaxodonmicrolepis(Boulenger,1906)Perrissodini0.187208121.67130.5250.204 Perissodusmicrolepis(Boulenger,1898)Perrissodini0.16329142.36140.5140.192 Oreochromistanganicae(Gu¨nther,1894)Oreochromini0.205131071.86140.5510.207 Trematocaranigrifrons(Boulenger,1906)Trematocarini0.1533527122.92150.5010.189
the amino acid level (RDA:F2,20= 4.05;P= 0.004).
Variables quantifying morphology or isotope signa- tures did not explain significant variation at the MHC nucleotide or amino acid level.
Discussion
In this study, we explore the relationships between parasite infection, trophic ecology, morphology, and
−0.1 0.0 0.1 0.2
0.00.20.40.60.81.0
LPJ shape dimension 1
Acanthocephala (prevalence)
ρ = 0.45; P = 0.0325 (a)
0.0 0.1 0.2 0.3 0.4 0.5 0.6
0.00.20.40.60.81.0
Aufwuchs
Acanthocephala (prevalence)
ρ = 0.44; P = 0.0340 (b)
−0.04 −0.02 0.00 0.02 0.04
0.00.20.40.60.81.0
Body shape dimension 2
Cichlidogyrus sp. (prevalence)
ρ = −0.48; P = 0.0206 (c)
0.0 0.2 0.4 0.6 0.8 1.0
05101520
Arthropods
Ergasilus sp. (mean abundance)
ρ = 0.48; P = 0.0214 (d)
0.0 0.1 0.2 0.3
−0.10.00.10.20.3
Sand
MHC dimension 2 [AA]
ρ = −0.43; P = 0.0274 (e)
0.00 0.05 0.10 0.15 0.20 0.25 0.30
−0.10.00.10.20.3
Molluscs
MHC dimension 2 [AA]
ρ = −0.39; P = 0.0487 (f)
0.00 0.05 0.10 0.15 0.20 0.25 0.30
−0.040.000.040.08
Molluscs
MHC dimension 1 [exon 2]
ρ = 0.50; P = 0.0099 (g)
0.00 0.02 0.04 0.06 0.08 0.10
−0.06−0.020.020.06
Fish eggs
MHC dimension 2 [exon 2]
ρ = −0.47; P = 0.0161 (h)
0.0 0.2 0.4 0.6 0.8
−0.10.00.10.20.3
Nematoda (prevalence)
MHC dimension 2 [AA]
ρ = 0.73; P = 0.0008 (i)
0.0 0.2 0.4 0.6 0.8
−0.06−0.020.020.06
Nematoda (prevalence)
MHC dimension 2 [exon 2]
ρ = 0.71; P = 0.0016 (j)
0.0 0.2 0.4 0.6 0.8
−0.040.000.040.08
Acanthocephala (prevalence)
MHC dimension 1 [exon 2]
ρ = 0.51; P = 0.0364 (k)
0.00 0.05 0.10 0.15
−0.06−0.020.020.06
Gill cysts (prevalence)
MHC dimension 2 [exon 2]
ρ = 0.55; P = 0.0229 (l)
Fig. 3 Relationships between infection levels and trophic ecology or morphology (a–d; 23 cichlid species), MHC divergence and trophic ecology (e–h; 26 cichlid species), and MHC divergence and infection levels (i–l; 17 cichlid species).
Dashed lines were obtained with a lowess function. The colors distinguish species from different tribes according to the color scheme of Fig.2
Table 3 MHC variants across the major cichlid tribes of LT with number of included species, number, and average of variants (total and unique) and the genetic distance based on the exon sequences (uncorrected p-distance and absolute difference)
Tribe Species
included
Total # of variants
Average # of total variants
Unique # of variants
Average # of unique variants
Uncorrected p-distance of sequences within each tribe
Absolute # of base differences
Cyphotilapini 2 43 21.5 24 12 0.17 26.4
Cyprichromini 1 56 56 27 27 0.18 28.7
Ectodini 5 201 40.2 88 17.6 0.19 29.9
Tropheini 4 142 35.5 60 15 0.2 32.3
Lamprologini 8 243 30.4 124 15.5 0.19 30.9
Limnochromini 2 59 29.5 11 5.5 0.16 26.4
Perissodini 2 52 26 17 8.5 0.17 27.9
Oreochromini 1 13 13 10 10 0.2 32
Trematocarini 1 35 35 27 27 0.15 24.1
immunogenetics in the LT cichlid radiation. Within such a large adaptive radiation of fishes, and with parasites as one of the most diverse taxa and the MHC as one of the most diverse genes, our assessment of the diversity at both levels is inevitably incomplete. The patterns that emerge from the comparison between these data layers are thus preliminary and must be interpreted with caution.
Parasite diversity
Habitat adaptation and trophic adaptation have been proposed to be important drivers of the LT cichlid radiation, because the habitat and diet of the various cichlid species are strongly linked with morphology.
For instance, Muschick et al. (2012) observed that habitat is associated with differences in body shape, while diet is associated with pharyngeal jaw morphol- ogy, a key trait for feeding on a specialized diet (from algae and biofilms to invertebrates and fish). In addition, carbon and nitrogen stable isotope signa- tures, which are classical indicators of the habitat and trophic position of an organism, also correlate with morphology (Muschick et al., 2012). In particular, d13C values in LT cichlids are associated with body shape clusters characteristic for a benthic or pelagic lifestyle, andd15N values correlate with the shape of the lower pharyngeal jaw. Stable isotope signatures thus reflect variation between macrohabitats as well as the relative trophic level of an organism.
In this study, we anticipated that habitat divergence and diet shifts might lead to exposure to different parasites and shifts in infection risk. If so, variation in morphology, diet, or stable isotopes among cichlid species should reflect differences in the composition of parasite communities. Accordingly, we observed that variation in body shape, LPJ shape, and individual prey items among species correlated either with overall parasite community composition or with the infection levels of individual parasite categories. For instance, LPJ shape correlated with the prevalence of acanthocephalans, and body shape accounted for 15%
of the variation in the overall parasite community.
Overall, different cichlid tribes featured partially non- overlapping parasite communities. These observations are not surprising given that variation in trophic- morphological traits enables cichlids to occupy dif- ferent niches, which may harbor different parasites.
Nevertheless, it has a major implication for the
understanding of cichlid species diversification: adap- tation to novel habitats or diets may as well require adaptation to different parasite environments. Because of the coexistence of many of the investigated hosts at the same locality, confounding effects arising as a consequence of geographical separation are minimal in this study.
This study is the first to investigate the assertion of parasite-driven species diversification across repre- sentative species from multiple tribes within an entire adaptive radiation. Recently, Baldo et al. (2017) came to a similar conclusion for gut bacteria, which significantly deviated between cichlid species with a carnivorous and herbivorous lifestyle. Overall, there are thus substantial indications that habitat and diet influence both the bacterial microbiota as well as parasitic macrobiota with the LT cichlid radiation.
Previously, Hablu¨tzel et al. (2017) demonstrated that trophic divergence can also lead to divergence in parasite communities at younger branches of the LT radiation. Within the Tropheini, one of the tribes included in this study, species evolved from relatively unselective substrate browsing of aufwuchs to more specialized foraging strategies, such as selective combing of microscopic diatoms or picking of macro-invertebrates. This divergence entailed reduced ingestion of intermediate invertebrate hosts of acan- thocephalans (i.e., ‘‘parasite escape’’), hence poten- tially facilitating niche divergence (Hablu¨tzel et al., 2017). Possibly, the level of trophic specialization can also explain infection at the tribe level. For instance, the relatively indifferent feeders of aufwuchs includ- ing Tropheini and Ectodini had higher infection levels with acanthocephalans than the Lamprologini and Perissodini, who pick their food selectively. Yet, the explanation for differences in infection by other parasites such as digeneans or Cichlidogyrus sp. is more obscure, because the infectious stage of these parasite groups search for hosts actively. Overall, the knowledge of the biology of the large diversity of LT fish parasites remains poor (Vanhove et al.,2016), and thus, why certain cichlid tribes are more infected with specific parasite groups than others is unclear.
Interestingly, the best predictor of parasite load within the LT cichlid radiation among a set of host characteristics was the number of host species that a particular host may encounter due to its habitat preferences (Hayward et al., 2017). This suggests increased transmission rates in environments with a
high cichlid species richness, which could result in more similar parasite communities. Locally, parasites in Lake Tanganyika may thus not act as a divergent, but as a convergent evolutionary force. However, the few detailed parasitological studies that exist for Lake Tanganyika hint at a huge diversity of parasite species, some of which are remarkably host-specific (Vanhove et al., 2011; Gillardin et al.,2012). Since taxonomic identification of the various metazoan macroparasites was done with a low resolution, we anticipate that our study underestimates parasite community differentia- tion. Divergent parasite-induced selection is therefore expected to be the predominant evolutionary force accompanying habitat adaptation and trophic special- ization. A previous study on LT cichlids has shown that at early stages of diversification (e.g., among allopatric population of the same species), parasite communities are divergent, but the degree of commu- nity shifts is not related to degree of host divergence (Hablu¨tzel et al., 2016). However, as mentioned above, cases of species divergence related to changes in trophic ecology may be associated with pre- dictable changes in parasite communities (Hablu¨tzel et al.,2017). So, while parasite community shifts may not represent a singular factor underlying host speci- ation, it is possible that they contribute to speciation via a reinforcement process.
Immunogenetic diversity
An important prerequisite for a role of parasites in adaptive radiation is that the divergent parasite selection pressures lead to immunogenetic adaptation among host lineages. We therefore assessed to what extent the different cichlid tribes are immunogeneti- cally differentiated at the level of a set of MHC genes.
We also assessed to what extent habitat shifts, diet shifts, and infection patterns correlate with immuno- genetic divergence. The various tribes indeed showed different MHC profiles, in particular at the amino acid level. The Limnochromini, a deep-water tribe, repre- sented the tribe with the most divergent MHC profile, while the three largest tribes (Tropheini, Ectodini, and Lamprologini) were partially overlapping. Further- more, immunogenetic differentiation correlated with (among others) the proportion of sand and molluscs in the diet, as well as with infection levels of nematodes and acanthocephalans. Overall, feeding on sand and infection with nematodes accounted for significant
variation at the MHC level. In contrast, morphology and isotope signatures did not explain immunogenetic divergence.
These results suggest that immunogenetic differ- entiation in the LT cichlid radiation occurred along a similar axis as the trophic and parasitological differ- entiation. Yet, as with any study of macroevolution, these correlational results do not allow us to conclude whether immunogenetic differentiation has truly con- tributed to adaptive radiation, or whether it is merely a reflection of it. Importantly, at the micro-evolutionary level, it has been observed that both near-panmictic populations of a good disperser (S. diagramma) and divergent allopatric color morphs of a philopatric species (Tropheus moorii (Boulenger, 1898)) are immunogenetically differentiated (Hablu¨tzel et al., 2016). This suggests that immunogenetic divergence might be common, and is not exclusively linked to cases of on-going species diversification. Yet, this might as well be the case for other putative drivers of cichlid adaptive radiation, and hence it is important to further investigate the patterns that emerge from this study in detail. First, the role of sand versus rock habitat in speciation has been frequently emphasized in cichlids (Danley & Kocher,2001). Our observation that the proportion of sand in the diet correlates with MHC divergence suggests that immunogenetic prop- erties might be an important component of the diversification among species of these two habitat types. Second, the distinct MHC profile of the Limnochromini suggests that also the deep water selects for different immunogenetic properties. No parasitological data of the Limnochromini are cur- rently available, except for monogenean gill-parasites of the genus Cichlidogyrus. Interestingly, the Cichli- dogyrus species diversity in the Limnochromini is reduced compared to littoral cichlid hosts (Kmentova´
et al.,2016b). This pattern appears to be replicated in three other tribes of non-littoral cichlids, the Bathy- bathini, the Benthochromini, and the Trematocarini (Kmentova´ et al.,2016a,c). Finally, while both MHC and parasites were both correlated with specific prey items, it is intriguing that MHC variation was not explained by trophic morphology. This indicates that the trophical-morphological axes might be relatively unimportant in shaping the immunogenetic properties of LT cichlids, perhaps because of the large variety of parasites and pathogens that are not transmitted through ingestion. At the same time, we cannot