Scales of population dynamics, ecology and diversity of planktonic foraminifera and their relationship
to particle flux in the eastern tropical Atlantic
Cruise No. M140
11.8.2017 – 5.9.2017
Mindelo (Cabo Verde) – Las Palmas (Spain)
FORAMFLUX
Michal Kucera, Michael Siccha, Raphaël Morard, Lukas Jonkers, Christiane Schmidt, Philipp Munz, Jeroen Groeneveld, Gerhard Fischer, Götz Ruhland, Marco Klann, Morten Iversen, Christian Konrad, Jan-Berend Stuut, Geert-Jan Brummer, Bob Koster,
Yvo Witte, Jan-Dirk de Visser, Manuel Weinkauf, Haruka Takagi, Julie Meilland, Ulrike Baranowski, Marina Rillo, Jacqueline Bertlich, Theresa Fritz-Endres, Gurjit Theara,
Adrian Baumeister, Paul Debray, Jasper Leonard Magerl and Andreas Raeke
Michal Kucera & Michael Siccha
MARUM – Zentrum für Marine Umweltwissenschaften der Universität Bremen 2019
Table of contents
1 Summary ... 3
2 Participants ... 4
3 Research program ... 6
3.1 Plankton ecology ... 6
3.2 Dust monitoring ... 7
3.3 Particle studies ... 8
4 Narrative of the cruise ... 9
5 Preliminary results ... 11
5.1 Physical oceanography ... 11
5.1.1 Plankton-sampler-mounted CTD unit ... 11
5.1.2 Ship-board CTD unit with water sampling rosette ... 12
5.1.3 Ship’s thermosalinograph ... 12
5.2 Water column sampling and measurements ... 13
5.2.1 Water sampling ... 13
5.2.2 Plankton sampling and sample processing ... 14
5.2.2.1 Underway plankton monitoring ... 14
5.2.3.2 Underway Multi-Plankton-Sampler stations ... 15
5.2.2.3 High resolution sampling ... 16
5.2.2.4 Counting and morphometric analysis of foraminifera ... 17
5.2.2.5 Photophysiology of foraminifera symbionts ... 20
5.2.2.6 Plankton filtration ... 22
5.2.2.6.1 Sampling for plankton environmental genomics ... 22
5.2.2.6.2 Determination of plankton biomass ... 23
5.2.2.6.3 Phytoplankton community sampling ... 24
5.2.3 Drifting traps ... 25
5.2.4 Particle camera surveys ... 26
5.2.5 Water chemistry ... 27
5.2.5.1 Alkalinity and pH ... 27
5.2.5.2 Dissolved oxygen concentrations ... 28
5.2.5.3 Stable oxygen and deuterium isotopes ... 29
5.2.5.4 Stable carbon isotopes ... 29
5.2.5.5 Nutrients ... 30
5.3 Moorings ... 30
5.3.1 Dust collecting buoys ... 30
5.3.2 Moored sediment traps ... 31
5.3.2.2 Central Atlantic mooring arrays ... 31
5.3.2.3 Cape Blanc mooring array ... 34
5.3.2.3.1 BioOptical Platform ... 36
5.3.3 Test mooring ... 37
5.4 ARGO floats ... 38
5.5 Atmospheric dust sampling ... 38
6 Ship’s meteorological station ... 40
7 Station list ... 41
8 Data and sample storage and availability ... 44
9 Acknowledgements ... 44
10 References ... 45
11 Appendix ... 47
1 Summary
Cruise M140 combined sampling of plankton, mineral dust and other particles in the water column with recovery of data and samples from long-term observational platforms (sediment traps and dust-collecting buoys). The aim of the cruise was to provide new observations to improve our understanding of the ecology of planktonic foraminifera as important carriers of paleoceano- graphic proxies and to investigate how mineral dust deposition and the production of marine snow and biogenic particle ballast vary in space and time and how they affect the marine biological pump. To this end, the cruise followed a transect in the central western Atlantic between oligo- trophic waters of the subtropical gyre and the productive coastal waters off Mauretania affected by coastal upwelling. To characterise population dynamics, ecology and physiology of planktonic foraminifera, we obtained a series of fourteen vertically resolved plankton net profiles along the cruise track, together with profiles of physical and chemical properties of the ambient water masses. Live foraminifera extracted from these profiles were used to quantify photosynthetic ac- tivity of selected species and determine their photoadaptation. High-resolution spatial and tem- poral sampling of the upper 300 m over 24 hours was carried out at two locations (recovering 41 and 46 vertical profiles), allowing the characterisation of patchiness and daily vertical migration of planktonic foraminifera. Moorings with sediment traps monitoring the seasonal and short-term variability of particle fluxes and buoys monitoring atmospheric dust deposition in the region were successfully recovered in the central Atlantic (M3), south of Cabo Verde (M1) and off Mauretania (CB and CBi) and redeployed in the latter two regions to continue the monitoring. Short-term variability of sizes and types of sinking particles in the water column were characterised in each of the monitoring regions with drifting sediment traps and in the Cape Blanc region off Mauretania also with continuous vertical particle camera profile. All aims of the cruise have been met – the plankton sampling and particle characterization studies were carried out successfully and all moor- ings and buoys could be recovered and/or redeployed as planned.
2 Participants
1. Michal Kucera Chief Scientist 1st Leg MARUM 2. Michael Siccha Chief Scientist 2nd Leg MARUM
3. Raphaël Morard Plankton genetics MARUM
4. Lukas Jonkers Sediment traps MARUM
5. Christiane Schmidt Photophysiology MARUM
6. Philipp Munz Multi-Plankton-Sampler Senckenberg/UniTü
7. Jeroen Groeneveld Water chemistry MARUM
8. Gerhard Fischer Sediment traps MARUM
9. Götz Ruhland Moorings MARUM
10. Marco Klann Moorings MARUM
11. Morten Iversen Particle camera MARUM / AWI
12. Christian Konrad Particle camera MARUM / AWI
13. Jan-Berend Stuut Dust buoys NIOZ / MARUM
14. Geert-Jan Brummer Sediment traps NIOZ / VU
15. Bob Koster Dust buoys NIOZ
16. Yvo Witte Moorings NIOZ
17. Jan-Dirk de Visser Moorings NIOZ
18. Manuel Weinkauf Plankton analysis UGeneva
19. Haruka Takagi Photophysiology AORI
20. Julie Meilland Plankton analysis Ocean Zoom
21. Ulrike Baranowski Plankton analysis GEES
22. Marina Rillo Plankton analysis MARUM
23. Jacqueline Bertlich Water chemistry GEOMAR
24. Theresa Fritz-Endres Plankton analysis CEOAS
25. Gurjit Theara Plankton analysis MARUM
26. Adrian Baumeister Plankton analysis MARUM
27. Paul Debray Plankton analysis MARUM
28. Jasper Leonard Magerl Plankton analysis Senckenberg/UniTü
29. Andreas Raeke Weather technician DWD
AORI
Atmosphere and Ocean Research Institute, The University of Tokyo 5-1-5, Kashiwanoha, Kashiwa, Chiba 277-8564 / Japan
www.aori.u-tokyo.ac.jp/english AWI
Alfred-Wegener-Institut, Helmholtz-Zentrum für Polar und Meeresforschung Am Alten Hafen 26, D-27568 Bremerhaven / Germany
www.awi.de CEOAS
College of Earth, Ocean, and Atmospheric Sciences, Oregon State University 104 CEOAS Administration Building, Corvallis, OR 97331-5503 / USA www.ceoas.oregonstate.edu
DWD
Deutscher Wetterdienst, Seeschifffahrtsberatung Bernhard-Nocht-Straße 76, 20359 Hamburg / Germany www.dwd.de
GEES
School of Geography, Earth and Environmental Sciences, University of Birmingham Edgbaston, Birmingham B15 2TT / UK
www.birminghma.ac.uk/schools/gees GEOMAR
Helmholtz-Zentrum für Ozeanforschung Kiel Wishhofstraße 1-3, D-24148 Kiel / Germany www.geomar.de
Senckenberg Centre for Human Evolution and Palaeoenvironment at the University of Tübingen
Hölderlinstraße 12, D-72074 Tübingen / Germany www.geo.uni-tuebingen.de
MARUM
Zentrum für Marine Umweltwissenschaften, Universität Bremen Leobener Straße 8, D-28359 Bremen / Germany
www.marum.de NIOZ
Royal Netherlands Institute of Sea Research in cooperation with Utrecht University PO Box 59, 1790 AB Den Burg (Texel) / The Netherlands
www.nioz.nl Ocean Zoom
UFR Sciences et Techniques
2 rue de la Houssinière, BP 92208, 44322 Nantes Cedex 3 / France www.oceanzoom.fr
UGeneva
University of Geneva, Faculty of Science, Department of Earth Sciences 12 Rue de Maraichers, 1205 Geneve / Switzerland
www.unige.ch VU
Department of Earth Sciences, Vrije Universiteit Amsterdam de Boelelaan 1085, 1081HV Amsterdam / The Netherlands science.vu.nl/en/research/earth-sciences
3 Research program 3.1 Plankton ecology
Much of what we know about the state of our planet in the geological past, in particular the chemistry, temperature and circulation of its oceans, has been derived from the study of microscopic shells of planktonic foraminifera (Kucera, 2007). Because the biomineralisation of foraminifera is highly regulated by the organism, chemical signatures in the calcite shell are often offset from inorganic equilibria and their application as proxies requires species-specific calibration and a detailed understanding of the time and depth of calcification of each species.
Despite their obvious importance ofr the interpretation of paleoceanographic proxies, most of the essential aspects of the ecology of planktonic foraminifera species still remain poorly constrained.
Many of the unknown aspects of planktonic foraminifera ecology are related to the lack of understanding of factors that govern their abundance and distribution in the water column. This issue is not limited to foraminifera. The spatial and temporal heterogeneity (patchiness) of plankton is crucial for the understanding and modelling of plankton population dynamics in general. Although the distribution of planktonic foraminifera species in terms of biogeographic provinces is well constrained, very little is known about the variability on smaller scales. Various concepts about the lifecycle of planktonic foraminifera exits in the literature (Hemleben et al., 1989), but most of them have never been tested rigorously. Amongst these are concepts of synchronised (lunar) reproduction, diel vertical migration and an ontogenetic vertical migration (Hemleben et al., 1989).
Planktonic foraminifera occupy an intermediate position between passively floating small phytoplankton and motile zooplankton. They have no active means of locomotion, but may be able to control their buoyancy; they are heterotrophic but many species harbour photosynthetically active symbionts which render them as facultative autotrophs. It is unknown how vertical habitat depths and its variability among individual species are linked to the existence of cryptic diversity and the occurrence of symbionts and their photophysiology have been studied only in a handful of species. The SCOR/IGBP Working Group 138 ‘Modern Planktic Foraminifera and Ocean Changes’ has been established in 2011 to stimulate research in this field. The working group identified research priorities that have been used to design the research programme of this cruise.
The principal aim of FORAMFLUX was to provide data and samples that are needed to investigate the extent and scale of population patchiness, ontogenetic and diel vertical migration, synchronisation of reproduction, symbiont presence and physiology and the extent of genetic diversity in the group. To meet this goal, we followed an approach combining observations from sediment traps, plankton samples and on-board experiments.
Sampling of the water column by filtration and by plankton tows was used to determine horizontal and vertical distribution, diversity and physiology of planktonic foraminifera species. The sam- pling was carried out using a vertically resolving plankton sampler (multiple closing plankton net) along transects and in a full-day continuous sampling scheme replicated at two stations. Observa- tions on the plankton were combined with measurements of physical water properties and water sampling to characterise the hydrography at the sampling stations. Plankton samples have been processed during the cruise and foraminifera have been be fixed for genetic analysis, TEM study of digestive content and symbiont content and the photosynthetic activity of the symbionts has been measured on board. Next to the seasonal variation of species flux, the existence of synchro- nised reproduction and the extent of short-term variability in planktonic foraminifera flux was studied by analysis of samples from sediment traps, deployed in a unique design allowing high- resolution coverage of flux variability across the seasonal cycle.
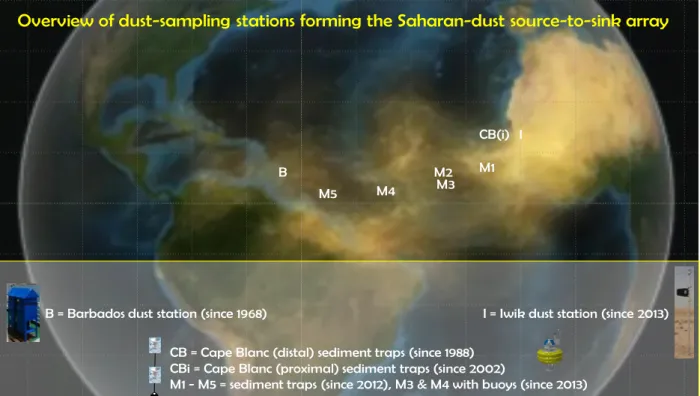
3.2 Dust monitoring
Each year, huge quantities of dust are blown westward from Northwest Africa. About 80% of this dust flux end up in the Atlantic Ocean (Yu et al., 2015). Mineral dust may act as a fertiliser for marine plankton and ballast particles carrying organic material to the sea floor, thus affecting the marine carbon cycle. The dust-monitoring program of the cruise is part of a long-term effort to understand modern mineral dust emission, transport, and deposition in order to assess its role(s) in climate feedback mechanisms, to provide data for climate models, and to interpret dust deposits in marine sediment records with respect to past-climate reconstructions. As the Sahara is by far the largest source of dust on the planet, two projects were designed to monitor Saharan dust along a transatlantic transect between the African coast and Barbados at 12oN: TRAFFIC (funded by NWO, the Dutch national science foundation) and DUSTTRAFFIC (funded by an ERC starting grant). The projects aim to monitor Saharan dust from source to sink across a distance of about 4000km (Figure 3.1). The projects are linked to ongoing dust-monitoring projects like the ~30- year long CB and CBi recording stations off Cape Blanc, Mauritania, and the ~50-year long dust- monitoring station on Barbados, by Prof. Prospero in Miami. For more information on the projects set up, initial results and publications, please see: www.nioz.nl/dust.
Until now, the transatlantic data set contains three complete observation years for the whole tran- sect. The FORAMFLUX cruise facilitated the recovery of moored sediment traps and dust-col- lecting boys with data for the 2016/2017 season. A combination of the dust monitoring program with studies of foraminifera flux offered the possibility to extend the sampling at two stations until autumn 2018. Station M3 at 12oN/37oW consists of a mooring with two sediment traps and dust- collecting buoy Michelle. This mooring at this station has been successfully recovered and monitoring at this station is discontinued. Mooring M1 at 12°N/37°W consists of three sediment traps and dust-collecting buoy Laura. The sediment traps have been collecting settling material at an unprecedented high resolution of four days between April 2016 and August 2017. This unique sediment trap mooring was redeployed at the same position and is programmed to continue until October 2018. At station CB at 21°N/21°W, our array contains dust-collecting buoy Carmen in
B
M5 M4 M2M3 M1
I CB(i)
B = Barbados dust station (since 1968) I = Iwik dust station (since 2013)
CB = Cape Blanc (distal) sediment traps (since 1988) CBi = Cape Blanc (proximal) sediment traps (since 2002)
M1 - M5 = sediment traps (since 2012), M3 & M4 with buoys (since 2013)
Overview of dust-sampling stations forming the Saharan-dust source-to-sink array
Figure 3.1: Position of the dust monitoring stations M3, M1 and CB visited during the FORAMFLUX cruise.
addition to the moored sediment traps operated by MARUM. Buoy Carmen has been serviced and re-deployed. Finally, underway sampling of Saharan dust has been been carried out using so-called Hi-Volume air samplers, a passive rain collector as well drifting traps.
3.3 Particle studies
Understanding the dynamics of the flux of planktonic foraminiferal shells and mineral dust to the sea floor has significant consequences for the assessment of their role in mediating export produc- tion. Through ballasting marine aggregates, foraminifera and dust may play an important role in the biological pump. The formation and sinking of organic aggregates, such as marine snow and fecal pellets, drive the biological carbon pump via export of organic matter to the deep ocean.
Previous field studies off Cape Blanc showed that the export of organic carbon was driven by small and fast-settling aggregates ballasted by coccoliths and fine-grained dust from the Sahara (Fischer and Karakas, 2009). However, most studies on the role of ballast for export of organic carbon have focused on coccolithophorids as a source of carbonate (Iversen and Ploug, 2010) and overlooked the contribution from foraminifera, which contribute a large part of the calcium car- bonate exported to the deep sea.
During FORAMFLUX, short-term particle flux and particle composition in the water column were studied using drifting particle traps and in situ cameras. Most of these observations were made in the Cape Blanc region. This region is part of the upwelling cell off Mauretania. Such coastal upwelling regimes are the most productive areas of the oceans and play a key role in the modern global carbon cycle, climate and ecosystem change. Next to the short-term particle flux studies, there exist two long-term mass flux time series from moored sediment traps. One at the meso- trophic study site CB off Cape Blanc, Mauritania (since 1988; Fischer et al., 2016) and a second from the eutrophic site CBi (since 2003). Both long-term sediment trap sites are situated within the ‘giant Cape Blanc filament and were designed to monitor the long term (subdecadal to decadal) flux variability as well as potential trends in carbon fluxes due to Atlantic climatic forcings or anthropogenic changes in upwelling intensity (Bakun, 1990). FORAMFLUX provided an oppor- tunity to service both moorings, extending the time series to autumn 2018. The CB mooring has been equipped with additional trap to facilitate a spatial replication of the unique high-resolution sampling design used in mooring site M1.
4 Narrative of the cruise
On Friday, August 11, RV METEOR left the port of Mindelo, Cabo Verde, with fair weather conditions and a calm sea and headed towards the NIOZ dust buoy Michelle. After completion of the obligatory safety drill, the scientific program of the cruise started with sampling at the first test station in the early afternoon, which yielded unexpectedly rich planktonic foraminifera fauna and allowed for final adjustments of the multi-plankton-sampler (MPS) and our sampling procedures.
The next morning we had our first full station with three MPS casts, which yielded over 3,000 planktonic foraminifera. The first successful photophysiological measurements of multiple foram- inifera species were carried out. On Sunday August 13, we crossed the deepest parts of the Atlantic with over 6200 m water depth. Saharan dust covered the horizon, reducing the visibility to 9 km.
We recovered the first samples from our continuous pumping system, which contained many ben- thic foraminifera species, most probably from the hull of the ship. On Monday August 14, we encountered the first rain and the yield of foraminifera from the daily station decreased.
On Tuesday August 15, we arrived at dust buoy Michelle in the early hours of the morning. The buoy was sighted in the early morning, hooked up for recovery via motor boat and was on deck by noon. We released a floating trap to collect particles and commenced the first full-day-sampling of the plankton in the afternoon. Almost the whole next day we sampled station after station with the MPS, the scientific crew worked in two shifts to manage the workload. After 26 hours, the sampling was concluded with a total of 41 net hauls carried out. We recovered the drifting trap, which had remained in sight of the radar for most of the full-day-sampling and released the sedi- ment trap mooring M3 in the late afternoon. The top buoy was sighted at 18:20 and by 19:30 the first sediment trap was safely on deck. Following the recovery, we released the first ARGO float as last task at station M3 and started sailing towards M1. Along the track, we continued with our daily MPS stations, which yielded very few foraminifera. On Saturday August 19, we released the second ARGO float.
We reached the position of mooring M1 on Monday August 21, We released the mooring at 10:20 am but it took until 12:30 to sight it. The mooring recovery was accompanied by heavy rain and concluded by 15:00. Having M1 recovered, we headed in the direction of dust buoy Laura and deployed a test mooring of NIOZ halfway. This mooring will serve to determine the durability of a new and reusable type of mooring cable. We spent the night near the dust buoy waiting for sunrise to commence the recovery procedure. On Tuesday August 22 in the morning we began with the recovery of dust buoy Laura. The recovery was completed by 14:00 and after that we released a drifting trap. At 14:30 we commenced the second full-day-sampling. This second scheme was completed after ~25 hours and 46 profiles on Wednesday August 23. Next, we headed towards the deployment position of the new M1 mooring and started the deployment at 17:45; the bottom weight was dropped at 19:00. During the deployment, we witnessed a true tropical rain- storm with 38 mm rain in just 25 minutes and wind gusts of 9 Bf. On Thursday morning, we started the redeployment of dust buoy Laura at first daylight. The whole mooring was first deployed with a dummy buoy on top, which was later caught and replaced by the real dust buoy. This procedure prevented accidental submergence of the dust buoy during the deployment of the anchor weight.
The whole operation took 7.5 hours and the buoy was safely in the water by 13:30. The deployed drifting trap was recovered during heavy rain and another ARGO float released at 15:15. This concluded the scientific program of the first leg and we headed towards Mindelo for the planned crew exchange on August 26.
We arrived in Mindelo as planned, entered the port at 9:00 and left again at around 11:00. In Mindelo three scientists left the METEOR, among them the chief scientist, and five scientists from MARUM and AWI embarked for the second leg. After leaving the port in direction of the Cape Blanc area, the ship’s crew conducted a life boat exercise within the sheltered bay. On our way to dust buoy Carmen, a third ARGO float was released. The station was reached on August 27, at night. On the next morning, we started with the recovery of Carmen, which was completed quickly by collaborative work of the mooring teams from NIOZ and MARUM. Afterwards we recovered sediment trap mooring CB (deployment CB-28) and deployed two drifting traps. On August 29, the dust buoy Carmen as well as mooring CB (as deployment CB-29) were redeployed. We ob- tained several particle camera profiles before recovering the two drifting traps, which had collected material for approximately 24 hours. During the night, we reached the position of the eutrophic sediment trap mooring CBi, closer to the Mauritanian coast. We retrieved the mooring the follow- ing morning, deployed a drifting trap and obtained particle camera profiles for most of the day, while the CBi mooring was prepared for redeployment. On Thursday August 31, we obtained six camera profiles in around the future deployment position of CBi. In the afternoon we exchanged the deployed drifting trap in order to obtain two consecutive days of sampling. During all the mooring work conducted in the Cape Blanc area, the planktonic foraminifera team worked hard in the laboratories, processing the 200 samples of the first full-day-sampling scheme. Friday Septem- ber 1 was the last full working day of M140. We redeployed CBi (as deployment CBi-16) without incident and obtained particle camera profiles at the mooring position until 17:00, when we ended station work and headed towards Las Palmas. On the September 3, we conducted our last MPS daily station. The cruise ended with the METEOR entering the port of Las Palmas at 10:00 on September 5, 2017. All aims of the cruise were met – the plankton sampling and particle charac- terization studies were carried out successfully and all moorings and buoys could be recovered and redeployed as planned.
5 Preliminary results 5.1 Physical oceanography
5.1.1 Plankton-sampler-mounted CTD unit (Michael Siccha)
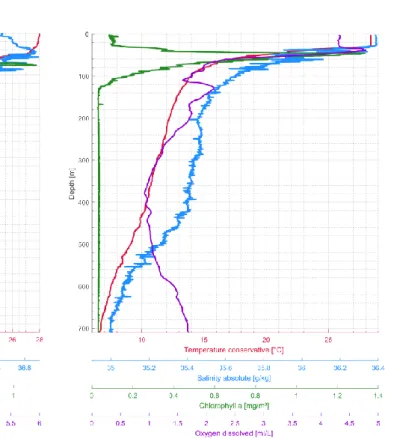
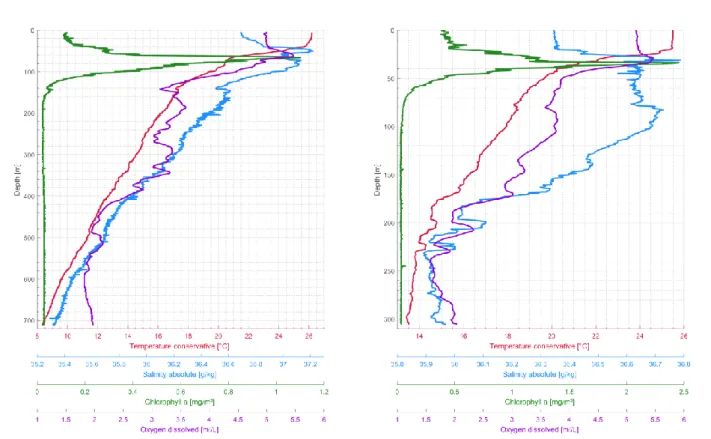
A CTD M90 (Sea and Sun Technologies, Trappenkamp, serial number CTD 979) was mounted on the multi-plankton-sampler (MPS) during all deployments. The instrument measured pressure, temperature, salinity, dissolved oxygen and chlorophyll-a at pressure difference intervals of 0.5 decibar. A pH sensor was also available, but a review of the obtained pH measurements indicated unrealistic values. A visual inspection revealed that the electrolyte inside the probe was leaking and pH measurements were thus discarded. All other sensors of the CTD unit (last calibrated on purchase in January 2015) worked without errors throughout the cruise. The unit was operating during each MPS deployment, resulting in the recovery of 40 CTD profiles of the upper water column at the 14 underway stations (Table 5.1). CTD profiles obtained at the position of the moor- ing stations M3 (GeoB22406-1), M1 (GeoB22410-1), CB (GeoB22414-9) and CBi (GeoB22416- 3) are shown in figures 5.1 to 5.4. The profiles reveal a water column structure with a well-devel- oped mixed layer of varying thickness and a distinct deep chlorophyll maximum. In addition to the underway measurements, the CTD unit was also operating during the full-day sampling schemes, resulting in additional 41 profiles in the region of Station M3 and 46 profiles in the region of Station M1. The raw and processed CTD data are published on PANGAEA.
Figure 5.1: CTD profile of station GeoB22406-1. Figure 5.2: CTD profile of station GeoB22410-1
5.1.2 Ship-board CTD unit with water sampling rosette (Jeroen Groeneveld, Julie Meilland, Michael Siccha)
The onboard Seabird Electronics (SBE) 9 plus CTD (Conductivity-Temperature-Depth) (SN 979) mounted in a SBE water sampler rosette with 24 twelve L Niskin bottles was employed at stations GeoB22410-1 and GeoB22416-3. The CTD unit recorded temperature, salinity, chlorophyll a and dissolved oxygen concentration in the water column. The last calibration date of the instrument before the cruise was 24.10.2016. The main purpose of the instrument’s deployment was to obtain water samples for water chemistry and phytoplankton community analysis to greater depths and with a finer vertical resolution and higher sample volume than what was possible with the MPS- mounted water sampler. In addition, the CTD provided in-situ seawater to fill the sediment trap sampling cups. The raw and processed CTD data are published on PANGAEA.
5.1.3 Ship’s thermosalinograph
(Geert-Jan Brummer, Leonard Magerl)
The RV METEOR is equipped with two thermosalinograph (TS) units (SeaBird Seacat SB 21E, SN 3313 and 3394), measuring temperature and salinity in closed sea water throughflow (Inlet opening 1.5 m below sea surface). Measurements are averaged over 6 second intervals. The last calibration date of unit 3313 was the 12.8.2016, for unit 3394 12.4.2017. During M140 both units were operating throughout the duration of the cruise. Whilst exporting the salinity-data from DSHIP-database of the METEOR, we noticed a significant difference between the data from the TS1 and TS2. This appeared to be caused by fouling around the inlet. Comparing both datasets to
Figure 5.3: CTD profile of station GeoB22414-9. Figure 5.4: CTD profile of station GeoB22416-3.
the MPS-CTD profiles it appeared that TS1 produced biased measurements. Therefore only the data from TS2 will be used for further processing and investigated in relation to the obtained plankton pump samples. The data are available upon request.
5.2 Water column sampling and measurements 5.2.1 Water sampling
(Jeroen Groeneveld, Jacqueline Bertlich, Julie Meilland, Lukas Jonkers)
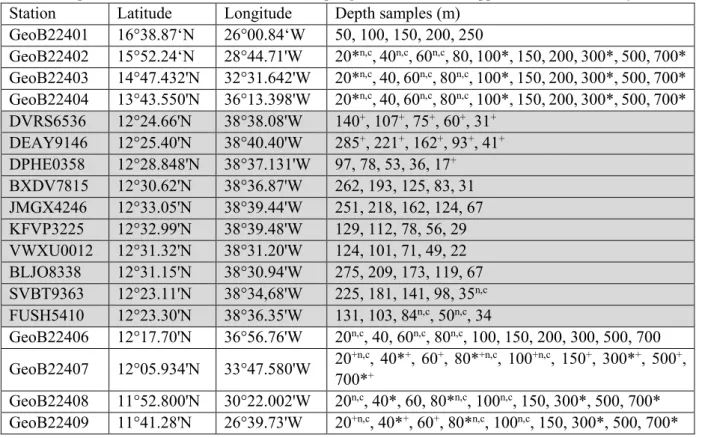
The MPS was equipped with a side-mounted water sampler with five 1.5 L Niskin bottles. The water sampler closed the bottles simultaneously with the opening of the MPS nets, i.e. at the base of each MPS sampling interval. Water samples were also obtained using the ship-board CTD ro- sette. In total, water samples were successfully collected from 66 casts at 33 stations. This includes all daily stations, ten stations at the M3 continuous sampling site, eight stations at the M1 contin- uous sampling site and the two CTD stations GeoB22410 and GeoB22416 (Table 5.1). For each of the daily stations as well as for M3 and M1, water was collected during two different casts to collect shallow and deep water. Water samples for pH, alkalinity and dissolved oxygen measure- ments were collected at every depth and analysed immediately on board (section 5.2.5.2). Sea water samples were also taken for measurements of nutrients, stable oxygen, hydrogen and carbon isotopes (section 5.2.5), as well as for coccolithophores (section 5.2.2.6.3). Samples for stable water isotopes were subsampled (2 mL) from the alkalinity sample bottles, at every depth and for every station listed in table 5.1.
Table 5.1: Stations and water depths of water samples taken during M140.
+ = δ13C of dissolved inorganic carbon, * = O2 (dissolved oxygen concentration), n = nutrients,
c = coccolitophoridae. A detailed overview of the sampling is available in the Appendix Water Chemistry Station Latitude Longitude Depth samples (m)
GeoB22401 16°38.87‘N 26°00.84‘W 50, 100, 150, 200, 250
GeoB22402 15°52.24‘N 28°44.71'W 20*n,c, 40n,c, 60n,c, 80, 100*, 150, 200, 300*, 500, 700*
GeoB22403 14°47.432'N 32°31.642'W 20*n,c, 40, 60n,c, 80n,c, 100*, 150, 200, 300*, 500, 700*
GeoB22404 13°43.550'N 36°13.398'W 20*n,c, 40, 60n,c, 80n,c, 100*, 150, 200, 300*, 500, 700*
DVRS6536 12°24.66'N 38°38.08'W 140+, 107+, 75+, 60+, 31+ DEAY9146 12°25.40'N 38°40.40'W 285+, 221+, 162+, 93+, 41+ DPHE0358 12°28.848'N 38°37.131'W 97, 78, 53, 36, 17+ BXDV7815 12°30.62'N 38°36.87'W 262, 193, 125, 83, 31 JMGX4246 12°33.05'N 38°39.44'W 251, 218, 162, 124, 67 KFVP3225 12°32.99'N 38°39.48'W 129, 112, 78, 56, 29 VWXU0012 12°31.32'N 38°31.20'W 124, 101, 71, 49, 22 BLJO8338 12°31.15'N 38°30.94'W 275, 209, 173, 119, 67 SVBT9363 12°23.11'N 38°34,68'W 225, 181, 141, 98, 35n,c FUSH5410 12°23.30'N 38°36.35'W 131, 103, 84n,c, 50n,c, 34
GeoB22406 12°17.70'N 36°56.76'W 20n,c, 40, 60n,c, 80n,c, 100, 150, 200, 300, 500, 700 GeoB22407 12°05.934'N 33°47.580'W 20+n,c, 40*+, 60+, 80*+n,c, 100+n,c, 150+, 300*+, 500+,
700*+
GeoB22408 11°52.800'N 30°22.002'W 20n,c, 40*, 60, 80*n,c, 100n,c, 150, 300*, 500, 700*
GeoB22409 11°41.28'N 26°39.73'W 20+n,c, 40*+, 60+, 80*n,c, 100n,c, 150, 300*, 500, 700*
GeoB22410 11°26.20'N 22°49.05'W
10*+n,c, 20*+n,c, 30*+n,c, 40*+n,c, 50*+n,c, 60*+n,c, 80n,c, 100*+n,c, 160*+n,c, 300*+, 400*+n,c, 700*+, 1000*+, 1250*+
Fox 11°20.76'N 22°57.58'W 294, 232, 176, 107, 56 Goose 11°20.40'N 22°57.72'W 139, 110, 76, 44, 28 Shark 11°23.161'N 22°59.394'W 226+, 189+, 120+, 89+, 42+ Octopus 11°23.933'N 22°59.649'W 131+, 115+, 81+, 60+, 31+ Gull 11°27.32'N 22°55.47'W 241, 178, 137, 82, 40 Cat 11°26.96'N 22°54.26'W 130, 104, 81, 51, 21 Pig 11°24.77'N 22°54.02'W 221, 178, 145, 114, 58 Hedgehog 11°23.605'N 22°53.214'W 112, 94, 61, 41, 24
GeoB22412 14°06.08'N 23°44.68'W 20+n,c, 40*+, 60+n,c, 80*+n,c, 100+, 150+, 200*+, 300*+, 500+, 700*+
GeoB22413 19.51.99'N 22°59.07'W 20+n,c, 40*+n,c, 60*+n,c, 80*+, 100+, 150+, 200*+, 300*+, 500+, 700*+
GeoB22414 21°17.05'N 20°49.27'W 20+n,c, 40*+n,c, 60*+n,c, 80*+, 100+, 150+, 200*+, 300*+, 500+, 700*+
GeoB22416 20°50.70'N 18°47.96'W
10n,c, 20+n,c, 35*,c, 40*+n,c, 60*+n,c, 80*+n,c, 100*+n,c, 150*+, 240+n,c, 330*+n,c, 450+, 500n,c, 600*+, 700+, 900*n,c, 1250+n,c, 1600, 1800*+
GeoB22417 20°52.19'N 18°56.33'W 20+, 40*+, 60+, 80*, 100, 150, 200*, 300*, 500, 700*
GeoB22421 24°43.73'N 16°34.36'W 20+n,c, 40*+n,c, 60*+n,c, 80*+n,c, 100+, 150+, 200*+, 300*+, 500+, 700*+
5.2.2 Plankton sampling and sample processing 5.2.2.1 Underway plankton monitoring
(Geert-Jan Brummer and Leonard Magerl)
The „Plankton Pump” is a highly efficient way of collecting surface water microplankton in the
>0.1 mm range along an entire cruise transect. It uses the ship's deck-wash or fire extinguishing system to continuously filter large volumes of surface water, without costing ship time, while sea surface parameters such as temperature and salinity are semi-continuously measured by the ship's system. It has been successfully used for three decades to sample skeletal microplankton, particularly the calcitic planktonic foraminifera. Continuous surface water plankton pumping (horizontal) is particularly attractive in combination with the water column sampling (vertical) and proved to be a robust sampling method during this cruise.
In the setup used during M140, surface water was continuously pumped from an inlet at 4 m depth in the bow of the METEOR, and passed through a hose into a plankton net (100 µm mesh size) that was suspended in a cube vessel on the deck. Every 12 hours, at around 9 am and 9 pm (ship- time), a sample was taken. Throughout the sampling, the pump was running with a flow of 2.5 m³ per hour on average, so each plankton sample is the result of filtering about 30 m³ of surface sea water, except during the two full-day sampling campaigns in the working areas M3 and M1, where the sampling interval was shortened to 3 h. To retrieve the sample, the hose was taken out of the net and used to rinse the net from the outside and concentrate the sample into the cod-end. The full cod-end was taken to the wet-lab and its content transferred onto a 90 µm sieve using pre-filtered sea water. The plankton sample was shortly rinsed with milli-Q to remove sea salt, and flushed
into a small zip-lock plastic bag, labelled consecutively from PP1 to PP54 (Appendix table 11.1).
Samples were frozen and stored at -20°C.
Generally, no problems were encountered. An exception occurred around station 44, where slimy plankton clogged the inside base of the net and could not be removed by rinsing with the hose. It was removed using a small spoon and added to the rest of the sample. The exact time of sampling was coupled to the ship's DSHIP-database to determine the exact GPS position at the start of sampling (in UTC) and extract temperature and salinity data from ships thermosalinograph 2. In the lab at NIOZ, all samples will be freeze-dried in their original sample bags, dry-weighed for biomass (total dry weight including the sample bag and post-weighing the empty sample bag), and dry-ashed to retrieve the skeletal matter (in an oxygen plasma using a low-temperature asher).
5.2.3.2 Underway Multi-Plankton-Sampler stations
(Philipp Munz, Michael Siccha, Adrian Baumeister, Manuel Weinkauf, Raphaël Morard, Paul Debray and Julie Meilland)
During transits to and from the mooring deployment stations, plankton tow casts were performed at 14 stations to collect planktonic foraminifera for population analyses, molecular genetic studies and geochemical proxy calibration (Table 5.2). A Hydrobios MultiNet Midi Multi Plankton Sam- pler (MPS) was used with an inlet size of 50 × 50 cm and five individual net bags with a mesh diameter of 100 µm. Slacking and hoisting was done with a rope speed of 0.5 m/s. After each net haul, the net bags were carefully rinsed from outside with sea water from the ship’s pump and the cup’s mesh cloth was washed and rinsed with filtered sea water. Opening and closing depths of each net bag were determined from the pressure readings from the pressure sensor of the device and controlled using a custom software script. It was programmed to activate the motor 2.5 m
Date
(UTC) Ship station
GeoB-
Station Latitude Longitude Net casts (N) Bulk samples (N) Processed samples (N) Env. gen. samples (N) Isolated foraminifera 11/08/17 ME1400/984 22401 16° 38,88' N 026° 00,86' W 1 0 5 0 2799 12/08/17 ME1400/985 22402 15° 52,24' N 028° 44,71' W 3 1 9 5 3037 13/08/17 ME1400/986 22403 14° 47,44' N 032° 30,40' W 3 1 9 5 1058 14/08/17 ME1400/987 22404 13° 43,25' N 036° 12,91' W 3 1 9 5 1279 17/08/17 ME1400/1034 22406 12° 17,58' N 036° 56,55' W 3 1 9 5 605 18/08/17 ME1400/1035 22407 12° 05,75' N 033° 47,10' W 3 1 9 5 1153 19/08/17 ME1400/1036 22408 11° 52,85' N 030° 22,61' W 3 1 9 5 3001 20/08/17 ME1400/1038 22409 11° 41,26' N 026° 39,34' W 3 1 9 5 2101 21/08/17 ME1400/1042 22410 11° 26,41' N 022° 49,23' W 3 15 0 0 - 25/08/17 ME1400/1095 22412 14° 06,70' N 023° 44,43' W 3 1 9 5 3508 27/08/17 ME1400/1096 22413 19° 31,20' N 022° 35.44' W 3 10 0 5 - 28/08/17 ME1400/1104 22414 21° 16,89' N 020° 49,60' W 3 10 0 5 - 31/08/17 ME1400/1119 22417 20° 52,15' N 018° 56,26' W 3 10 0 5 - 03/09/17 ME1400/1134 22421 24° 43,73' N 016° 34,36' W 3 10 0 5 - Table 5.2: MPS underway station list
before reaching the next depth interval. The software simultaneously recorded parameter readings from the MPS, like opening/closing depth, activation time and sampled volume, as well as selected parameters from the DSHIP, such as position, wind speed, rope length and rope speed.
Except for the first station, which was used to test the equipment, each underway station consisted of three consecutive hauls with standard opening/closing depth intervals as follows: a deep cast starting at a depth of 700 m with the sampling intervals 700 – 500 – 300 – 200 – 100 – 0 m, a shallow cast starting at 100 m with the sampling intervals 100 – 80 – 60 – 40 – 20 – 0 m and an intermediate cast starting at 500 m with the sampling intervals 500 – 300 – 150 – 80 – 40 – 0 m.
A CTD M90 (Sea and Sun Technologies, Trappenkamp, Germany, serial number CTD 979) was mounted on the MPS during all deployments and recorded water column properties simultaneously during each cast.
Before priority was moved to processing of the first full-day sampling, plankton samples from the deep and shallow casts of the underway MPS stations were processed directly on board using stereo dissecting microscopes. Individual planktonic foraminifera were extracted from the sam- ples, transferred to cardboard micropaleontological sample slides, classified into living (with cy- toplasm) and dead (empty test), scanned with a Keyence confocal digital microscope (see 5.2.2.4) and stored at -80 °C. The 100 – 0 m interval of the deep cast was frozen as a concentrated bulk sample for reference purposes. Samples that could not be processed on board were also stored as bulk samples. The samples of the intermediate MPS hauls were dedicated to the genetic analysis via Next-Generation-Sequencing (NGS). Samples from these casts were filtered using a vacuum filtration system and stored at -80 °C (see 5.2.2.6.1). All frozen samples were shipped on dry ice to the University of Bremen.
5.2.2.3 High resolution sampling
(Michael Siccha and Lukas Jonkers)
A full day high resolution sampling was conducted twice during the first leg of the cruise, first in the vicinity of the M3 mooring and second near the M1 mooring. To minimise temporal-spatial correlation between sampling locations and to obtain a distribution of inter-sample distances that is as continuous and flat as possible, samples were taken at randomly chosen locations within a predefined area. Similarly, the net intervals were designed in a semi-random way, allowing to detect changes in vertical abundances at a smaller scale than possible with a regular vertical reso- lution. All plankton tow casts consisted of five nets, with shallow and deep casts alternating be- tween stations. Shallow casts had a random collection interval between 15 m and 35 m, deep casts between 30 m and 70 m. In order to sample the same water body the predetermined sampling positions were continuously updated during the progress of the full day sampling. A custom soft- ware script was employed to track progress of the sampling effort, update the sampling stations and communicate the sampling station positions to the bridge. The location of the sampling station position was continuously updated by a local background current velocity data obtained from the shipboard ADCP. Since the ADCP data cannot be read out online from the ship’s system and needs to be processed before use, an update of the local background current velocity data could only be performed in intervals of about 6 hours. Preliminary analysis of the ADCP data shows median absolute current speeds of ~0.08 m/s, temporarily reaching 0.2432 m/s (95% percentile) near the M3 mooring.
The first continuous sampling was carried out centered around 38.5° W, 12.5° N and lasted from 15 August 2017 15:45 UTC until 16 August 2017 17:30 UTC. The initial, pre-drift corrected sam- pling area was a 400 km2 square with 60 randomly distributed stations. An optimal itinerary was designed passing through 48 randomly chosen stations (the 12 remaining were optional in case extra was available). Within 26 hours we managed to sample 41 stations, averaging one cast every 38 minutes. All samples were frozen at -80 °C in bulk directly after the MPS deployment and during the remainder of the cruise samples were sequentially defrosted for isolation, counting and imaging of planktonic foraminifera. All samples were refrozen after picking and the residues were filtered for biomass determination.
The second full day sampling started on 22 August 2017 at 15:45 UTC and ended 25 August 2017 17:00 UTC near 23.0° W, 11.3° N. This time samples were taken in a 144 km2 (pre-drift correction) square in order to investigate smaller scale spatial abundance variability and to obtain more sam- ples. Similar to the first time, 48 stations were randomly chosen from a total of 60, but this time the sampling was started near the center of the square. We completed 46 casts, averaging one cast every 33 minutes. All samples were directly frozen at -80 °C and will be processed at MARUM.
5.2.2.4 Counting and morphometric analysis of foraminifera
(Adrian Baumeister, Manuel Weinkauf, Philipp Munz and Julie Meilland)
A key aim of the cruise was to study ecology of planktonic foraminifera in the region. In total 137 multinet casts were carried out at 104 stations, yielding 685 discrete samples. In 273 of these sam- ples, foraminifera were isolated on board. This included all samples from the M3 area full day sampling area (205 samples from 41 stations) and 68 samples from the 14 daily stations. The daily stations samples were processed immediately onboard after sampling by multiple researchers (two persons per sample for samples shallower than 40 m and one person per sample for all other sam- ples) while the M3 continuous sampling samples were frozen in sampling bags immediately after sampling and defrosted again for processing. The processing of a full station took between six hours and 1.5 days, depending on the overall density of plankton. Each scientist marked their slides with their initials in order to trace potential picking bias, and to ensure that the picking was ex- haustive all samples were checked for completeness of processing by an experienced researcher.
The isolated foraminifera were transferred individually to cardboard slides and sorted onto the slides pre-printed grid. The slides were then imaged with a digital microscope (Keyence VHX 5000), and afterwards stored at -80°C. The microscope setup consisted of the camera unit VHX-
20 40 60 80
Aug 15 18:00 Aug 16 00:00 Aug 16 06:00 Aug 16 12:00 Aug 16 18:00
concentration [# m-3]
deep shallow
Figure 5.5: total planktonic foraminifera abundance in the top net during the full day sampling on 15 and 16 Au- gust, separated by shallow and deep casts. Note that the variability is of a higher frequency than a diurnal cycle.
5100 and an ultra-small compact high-performance zoom lens (20x to 200x). To make the fully automated stitching of images possible the setup consisted as well of the VHX-S550 free-angle observation system with an XYZ motorized stage. The microscope, which has been rented for the cruise period from Keyence, is capable of stacking pictures taken at several focal planes to create a high resolution mosaic image with height information.
During extraction, the foraminifera were separated into those which contained cytoplasm (assumed to be alive) and those whose tests were already empty (dead) at the moment of collection. Separate scans for those two groups were performed. These images will deliver information about the dis- tribution of ontogenetic stages within the dead and living fauna. Images were taken at 150x mag- nification. We tried to take pictures with a vertical stack resolution of 3 and 5 µm but such a high resolution drastically increased the time of scanning. Thus, regarding the large amount of scans to be produced, a resolution of 7 µm was considered the best compromise between resolution and scanning time. Every image was saved as a .jpg file. The height information is contained within the .jpg file and can be accessed by the Keyence software. To make further analysis possible, the height information for every pixel of the image was ex- ported in separate .csv files.
During the work with the Keyence, we encountered a few difficulties. Foremost, vi- brations of the ship made it hard to automatically deter- mine the correct focal planes/heights for the verti- cally resolved images. This technical problem could not be overcome onboard, but post- processing treatment is pro- gressing and accurate size in- formation from the onboard- acquired images will be ex- tractable in the future. We fur- ther noted that the design of the slides is not optimal for
Figure 5.6: Total planktonic foraminifera abundance at each station during the full day sampling on 15 and 16 Au- gust. Profiles are ordered by time.
0
100
200
300
depth [m]
concentration [# m-3]
10 20 30 40 50 60 70 80 90
12.40 12.45 12.50 12.55
-38.70 -38.65 -38.60 -38.55 -38.50
lon
lat
20 30 40 50 60
concentration
Figure 5.7: total planktonic foraminifera abundance (in # m-3) in the topmost nets of the M3 area full day sampling show unprecedented variability at small spatial scales, suggesting patchiness in their distribution.
this application, because the white grid printed on the slides causes artifacts in the com- puted topography. We also no- ticed that the background col- our of the slides is variable.
The microslides are supposed to be plain black but under re- flected light, at high magnifi- cations, the color is patchy in different shades of grey. Fi- nally, due to the use of sea wa- ter to manipulate and position the shells, the cardboard occasionally became uneven and salt crystals were built up.
Both negatively impacted the ensuing particle analysis, but lead us to design new slides suitable for analysis with the Keyence microscope in collaboration with a private company (Kreativika).
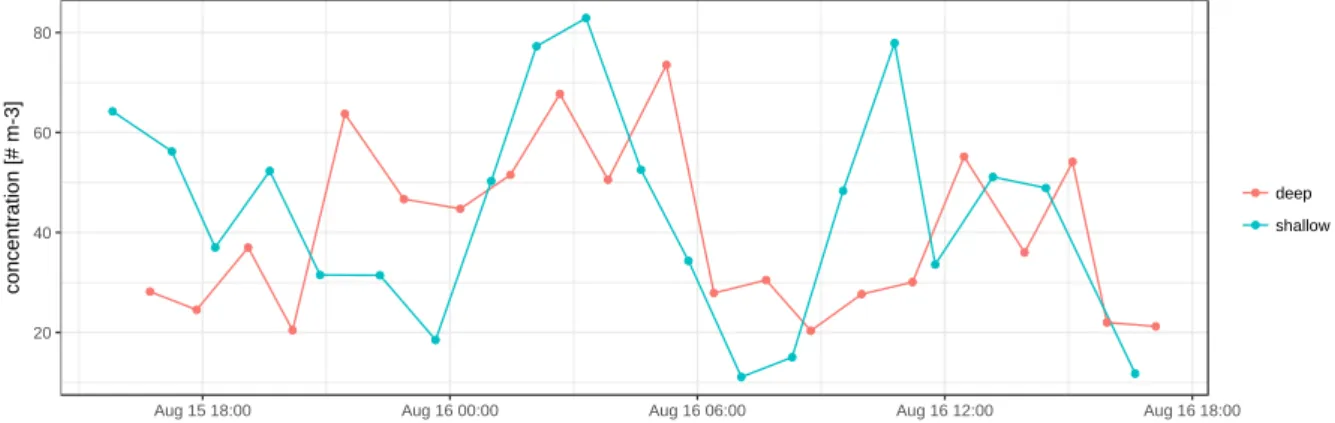
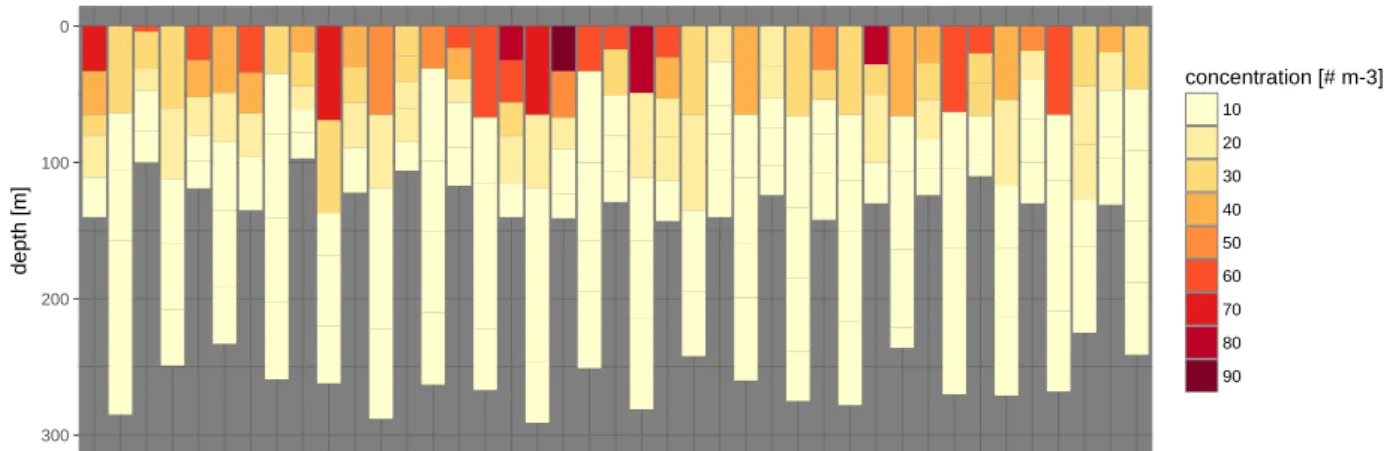
In all of the 273 picked samples, empty and cytoplasm-bearing shells of planktonic foraminifera were counted on board, allowing preliminary analysis of the state and variability of the foraminif- eral assemblage. In the M3 area, sampled during the full-day sampling scheme with 41 replicated 5-depth profiles, total planktonic foraminifera abundances varied between 1 and 83 individuals per m3 with highest abundances virtually always at the surface (Fig. 5.5). Below 100 m, concen- trations rarely reached more than 10 tests per m3. There is clear variability in the near surface concentrations (11-83 tests m-3; Fig. 5.5) that cannot be solely attributed to a dilution effect of the deep casts (Fig. 5.6). Broadly, two maxima are visible, a first centred around midnight on August 15 and a second around noon the next day. This indicates that planktonic foraminifera as a group do not show a diurnal cycle in their depth habitat.
The spatial abundance in the near surface layer (Fig. 5.7) shows patterns that are unlikely the result of temporal changes in the abundance. This is clearest in the north-western quadrant of the sam- pling area, but also in the north-east and the southern half, where stations at the beginning and end show elevated concentrations. The patterns indicates the presence of patchiness in the spatial dis- tribution of planktonic foraminifera. These preliminary data clearly show the potential of the da- tasets from the two full day sampling efforts to shed light on the small-scale spatial and temporal population dynamics.
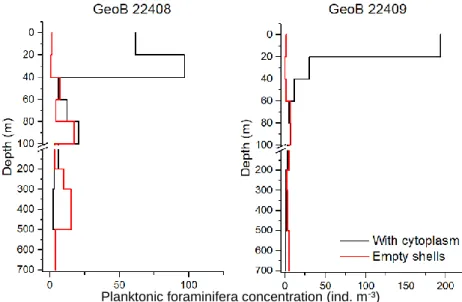
Data of the daily stations also show a strong variability among the stations. For instance, sampled with one day apart the stations GeoB 22408 and GeoB 22409 show exemplarily large differences in both planktonic foraminifera densities and distribution profile (Fig. 5.8).
Figure 5.8: Vertical distribution of planktonic foraminifera abundance (ind. m-3) at stations GeoB22408 and GeoB22409.
Planktonic foraminifera concentration (ind. m-³)
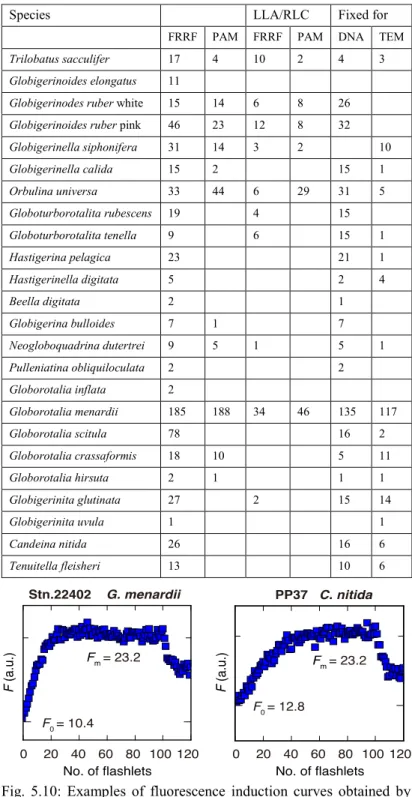
5.2.2.5 Photophysiology of foraminifera symbionts (Haruka Takagi and Christiane Schmidt)
To evaluate the photosynthetic performance of symbiotic algae within planktonic foraminifera, we conducted photophysiological assessments of individual foraminifera-algal consortia (holobionts).
Among the 50 species of living planktonic foraminifera, about 1/4 are known to host photosynthe- sizing algae in their cells (Schiebel and Hemleben, 2017). The photosymbiotic algae (e.g., dino- flagellates, chrysophytes) are obtained from ambient environment and harboured as intracellular endosymbionts (Fig. 5.9). The photosynthetic performance of the symbiotic algae is an indicator of holobiont fitness and the photophysiology of the symbionts likely reflects an adaptation to light conditions. Among the ecological traits of planktonic foraminifera, the extent and rate of vertical migration during life is one of the biggest unanswered questions. Next to providing direct con- straints on the existence of photosymbiosis, the evaluation of photophysiology of specimens col- lected at different depths has a potential to constrain the extent and prevalence of vertical migration or the existence of distinct depth stratification in symbiont-bearing species.
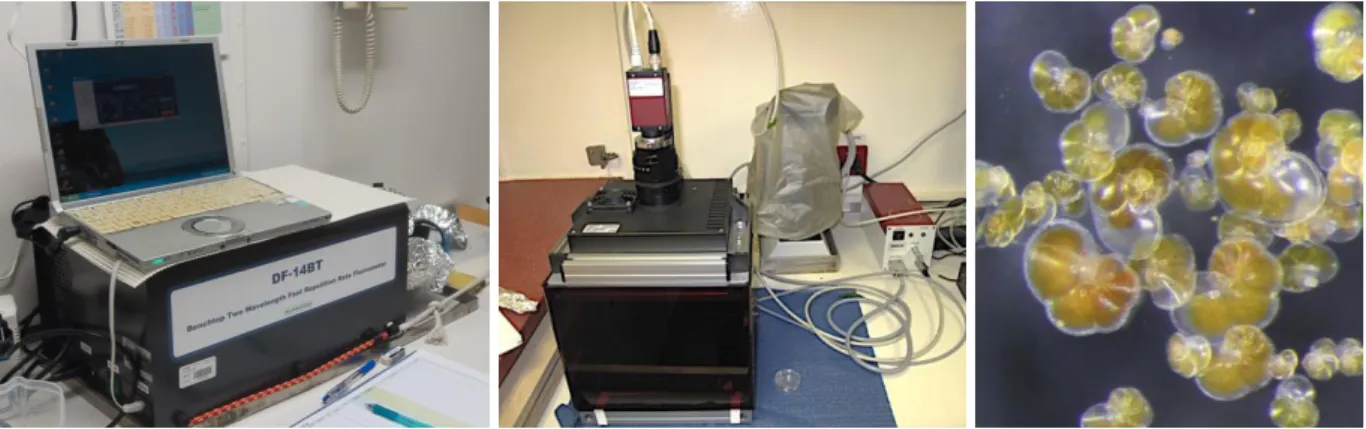
Specimens for photophysiology measurements were isolated from MPS and plankton pump sam- ples. Individuals of different species were selected to either determine the presence of symbionts or to characterize their photophysiology at different depths. They were isolated using either brush or Pasteur pipette as soon as possible after sampling and used for on-board photophysiological measurements by fast repetition rate (FRR) fluorometer (DF-14BT, Kimoto Electric Co., Ltd., Ja- pan) and/or pulse amplitude modulation (PAM) fluorometer (IPAM, WALZ GmbH, Germany) (Fig. 5.9). Isolated specimens were transferred to multidish wells (Nunclon) filled with filtered sea water (0.45µm filtration), and maintained at room temperature until measurement.
In the FRR fluorometer, the specimens were put into a quartz glass cuvette and placed on the detection window of fluorometer. To obtain the fluorescence induction curve in photosystem II (PSII), this instrument generates a series of blue flashes (a wavelength of 470 nm with a 10 nm bandwidth, excitation light intensity of 30 mmol m-2 s-1) at a repetition rate of 500 kHz in saturation phase, and 20 kHz in relaxation phase. We derived the PSII parameters from the fluorescence induction curve by using the numerical fitting procedure described by Kolber et al. (1998): these parameters included the minimum fluorescence (F0), maximum fluorescence (Fm), variable fluo- rescence [Fv (=Fm – F0)], potential photochemical efficiency (Fv/Fm), effective absorption cross- section of PSII (PSII) and minimum turnover time (τQΑ). We also measured a light curve of holo- bionts (light level adaption, LLA) with sequential light intensity of 10, 20, 40, 60, 80, 100, 150, 200, 250, 300, 500, 1000, and 2000 µmol m-2 s-1.
Figure 5.9: FRR fluorometer (left) and PAM fluorometer (middle), used during the cruise. Living Globorotalia menardii (right) from a sample particularly rich in this species (GeoB22414, 60-40 m).
The PAM fluorometer (WALZ GmbH, Germany) was equipped with MAXI-
Head, 1/2” and CCD camera (K7) and zoom objective (F1.0/f = 8–48 mm). It was used to assess the maximum quan- tum yield (Fv:Fm) and conduct rapid light curves (RLC). The light environ- ment around planktonic foraminifera is highly fluctuating, hence the RLC provides reliable assessment of photo- synthetic activity by integrating the symbiont ability to tolerate fluctuating light conditions (Ralph and Gademann 2005). Individual foraminifera speci- mens were cleaned from adhering al- gae and put into a petri dish containing filtered sea water (0.45 um). Only specimens >250 µm could be meas- ured using the PAM setup. Specimens were measured for the Fv:Fm after 10- 15 min dark adaptation. Areas of Inter- est were manually placed in form of circles covering the surface area of the individual foraminifera using the zoom function in the software Imaging Win 2.46i (WALZ GmbH, Germany.
For the conduction of the RLCs foram- inifera were exposed to 17 increasing irradiance steps of 10 s each which were as follows: 2, 9, 21, 32, 50, 70, 97, 127, 163, 200, 240, 290, 335, 390, 449, 506, 589 µmol photons m-2 s-1. The irradiance emitted by the LEDs of the IPAM instrument was calibrated using a hand-held PAR Light Meter (Apogee, USA). After exposure to each actinic light step the effective quantum efficiency ∆F/Fm’ was meas- ured. For every irradiance level, the relative electron transport rate (rETR =
∆F/Fm’ × PAR) was calculated.
After the photosynthetic measurements, some of the specimens were isolated for DNA analysis of symbiotic algae, and transmission electron microscopy (TEM) observation. Specimens for DNA analysis were transferred into micropaleontological slides, photographed individually, air dried and then stored at –80°C. Specimens for TEM observation were transferred into 200 µL micro- tubes containing 100 µL fixation buffer for electron microscopy (Glutaraldehyde-Formaldehyde-
Species LLA/RLC Fixed for
FRRF PAM FRRF PAM DNA TEM
Trilobatus sacculifer 17 4 10 2 4 3
Globigerinoides elongatus 11
Globigerinodes ruber white 15 14 6 8 26
Globigerinoides ruber pink 46 23 12 8 32
Globigerinella siphonifera 31 14 3 2 10
Globigerinella calida 15 2 15 1
Orbulina universa 33 44 6 29 31 5
Globoturborotalita rubescens 19 4 15
Globoturborotalita tenella 9 6 15 1
Hastigerina pelagica 23 21 1
Hastigerinella digitata 5 2 4
Beella digitata 2 1
Globigerina bulloides 7 1 7
Neogloboquadrina dutertrei 9 5 1 5 1
Pulleniatina obliquiloculata 2 2
Globorotalia inflata 2
Globorotalia menardii 185 188 34 46 135 117
Globorotalia scitula 78 16 2
Globorotalia crassaformis 18 10 5 11
Globorotalia hirsuta 2 1 1 1
Globigerinita glutinata 27 2 15 14
Globigerinita uvula 1 1
Candeina nitida 26 16 6
Tenuitella fleisheri 13 10 6
Table 5.3: Summary of species and specimens of planktonic foraminifera analyzed for symbiont photophysiology (FRR and PAM fluorometers) and fixed for TEM and DNA analysis.
Fig. 5.10: Examples of fluorescence induction curves obtained by FRRF measurement of photosymbiotic planktonic foraminifera (left:
G. menardii from Stn. 22402, 80–60m depth / right: C. nitida from plankton pump, 4m depth).
Cacodylate buffer for electron microscopy, Morphisto GmbH). In total, 596 specimens of 23 spe- cies were investigated by FRR fluorometry (total number of measurement 2035), 308 specimens of 11 species by PAM fluorometry, 374 specimens of 20 species were collected for DNA analysis and 184 specimens of 16 species were fixed for TEM (Table 5.3).
5.2.2.6 Plankton filtration
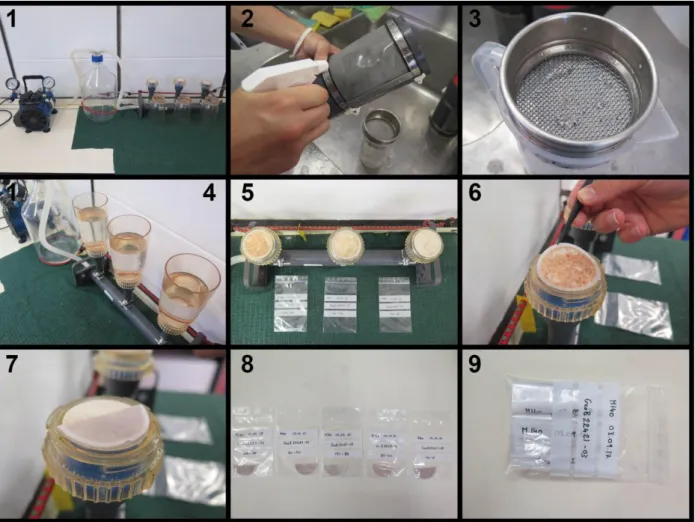
5.2.2.6.1 Sampling for plankton environmental genomics (Raphaël Morard and Paul Debray)
The filtration system used to concentrate the content of plankton net samples consisted of 3 funnels of 500 ml mounted in series on a filtration ramp and connected to a pump and a vacuum bottle (Fig. 5.11 1). Before each collection, all parts of the filtration system in contact with the sample were washed using 96% ethanol and MilliQ water to eliminate potential contaminants. After clean- ing, a cellulose filtration membrane with 47 mm diameter and 12 µm pore size was placed on the gasket using sterile tweezers and the funnel was screwed on top. At every daily station, one entire MPS cast was dedicated to sampling for metagenomics analysis. The sampling was done at the intervals of 500-300, 300-150, 150-80, 80-40 and 40-0 meters. After the MPS recovery the con- tents of the cod-ends were transferred into a 1-liter beaker through a 2-mm sieve to remove large zooplankton particles that would clog the filter (Fig. 5.11 2-3). The particle above 2 mm were
Figure 5.11: Workflow of the filtration for metagenomics during M140. (1) Filtration setup (2) rinsing of the cod- end mesh (3) large plankton particles retained in the sieve (4) samples ready for filtration (5) plankton concentrated on the filters (6-7) folding of the filter (8) individual sampling bags (9) final collection per station.