GEOMAR REPORT
SALTAX: Geomorphology and geophysics of submarine salt flows in the Red Sea Rift
Limassol (Cyprus) – Safaga (Egypt) 27.08. – 21.09.2018
Berichte aus dem GEOMAR
Helmholtz-Zentrum für Ozeanforschung Kiel
Nr. 50 (N. Ser.)
May 2019
Cruise Report 64PE-445
SALTAX: Geomorphology and geophysics of submarine salt flows in the Red Sea Rift
Limassol (Cyprus) – Safaga (Egypt) 27.08. – 21.09.2018
Berichte aus dem GEOMAR
Helmholtz-Zentrum für Ozeanforschung Kiel
Nr. 50 (N. Ser.)
May 2019
Cruise Report 64PE-445
Herausgeber / Editors:
Nico Augustin, Neil C. Mitchell, Froukje M. van der Zwan & Scientific Shipboard Party GEOMAR Report
ISSN Nr.. 2193-8113, DOI 10.3289/GEOMAR_REP_NS_50_2019
Helmholtz-Zentrum für Ozeanforschung Kiel / Helmholtz Centre for Ocean Research Kiel GEOMAR
Dienstgebäude Westufer / West Shore Building Düsternbrooker Weg 20
D-24105 Kiel Germany
Helmholtz-Zentrum für Ozeanforschung Kiel / Helmholtz Centre for Ocean Research Kiel GEOMAR
Dienstgebäude Ostufer / East Shore Building Wischhofstr. 1-3
D-24148 Kiel Germany
Tel.: +49 431 600-0 Fax: +49 431 600-2805 www.geomar.de
Table of Contents
1 SUMMARY ... 3
2 PARTICIPANTS ... 4
2.1 SCIENTIFIC CREW ... 4
2.2 AFFILIATIONS ... 5
2.3 SHIP’S CREW ... 5
3 RESEARCH PROGRAMME ... 6
3.1 SCIENTIFIC QUESTIONS AND GOALS ... 6
3.1.1 Tectonics and Volcanism of the Red Sea Rift ... 6
3.1.2 Halokinetic deformation in the Red Sea ... 7
3.1.3 Aims of Expedition 64PE-445 SALTAX ... 9
3.1.4 References (Research Programme) ... 10
3.2 SCIENTIFIC OPERATIONS ... 12
3.3 MEASURES OF RESPONSIBLE CONDUCT OF MARINE RESEARCH ... 12
4 NARRATIVE OF THE CRUISE ... 13
5 PRELIMINARY RESULTS ... 19
5.1 BATHYMETRY AND GEOMORPHOLOGY ... 19
5.1.1 Multibeam Operations ... 19
5.1.2 Preliminary results ... 21
5.2 EK500 HIGH-FREQUENCY ECHOSOUNDER ... 23
5.3 GEOPHYSICS ... 24
5.3.1 Seismic Measurements ... 24
5.3.2 Magnetic measurements ... 33
5.4 CTDMEASUREMENTS AND SAMPLING ... 35
5.5 SEAFLOOR SAMPLING ... 36
5.5.1 Sediment Sampling, Gravity Coring ... 36
6 STATION LIST ... 37
7 DATA AND SAMPLE STORAGE AND AVAILABILITY ... 40
7.1 GEOLOGICAL SAMPLES ... 40
7.2 HYDROACOUSTIC AND SEISMIC DATA ... 40
7.3 GEOPHYSICAL DATA ... 40
8 ACKNOWLEDGEMENTS ... 40
9 APPENDIX – ADDITIONAL CORING INFORMATION ... 41
1 Summary (N. Augustin)
Large parts of the Red Sea rift valley are, in contrast to most other mid-ocean rifts worldwide, covered by flows of submarine salt and sediment, which makes direct observation of volcanism and ocean floor formation impossible for many parts of the Red Sea. The tectonic structures outside the axial valley floors are almost all covered by salt. Indirect observations are only possible if the characteristics of the salt glaciers are understood, but they are poorly studied.
Therefore, expedition 64PE-445 SaltAx aimed to map these submarine salt flows in the Red Sea in high resolution and to investigate their internal structure by sparker-seismic and magnetics. A large amount of time was invested in seafloor mapping with the ship's own multibeam echo sounder and in seismic surveys. These data will be combined with magnetic measurements to identify lithological variations within the salt glaciers and the rift structure beneath them. For the correct interpretation of the mapped structures, ground truthing by seafloor sampling with gravity corer and geological rock dredges was carried out.
With the investigation of the sediment and salt glaciers´ subsurface structure, the morphology of the uppermost salt reflector, structures in the overlaying sediments and potential imaging of volcanic intrusions or buried hydrothermal deposits, the scientists on board RV Pelagia aim to better understand the kinematics of salt flowage into the Red Sea rift valley and thus the history of a young, volcanically and hydrothermally active mid-ocean rift. These studies will help to understand geological processes in other young, salt-filled ocean basins such as the so-called Aptian Salt Basin at its time of formation. That basin grew over 125 million years to form the South Atlantic with large oil and gas fields at its margins.
The project is funded from GEOMAR Helmholtz Centre for Ocean Research Kiel, the German Science Foundation (DFG) as well as the Royal Society International Exchanges Programme (UK) and is carried out in the framework of the European OFEG Barter system. Researchers from GEOMAR, the University of Manchester (UK), University of Hamburg and the Red Sea University in Port Sudan participated in the expedition.
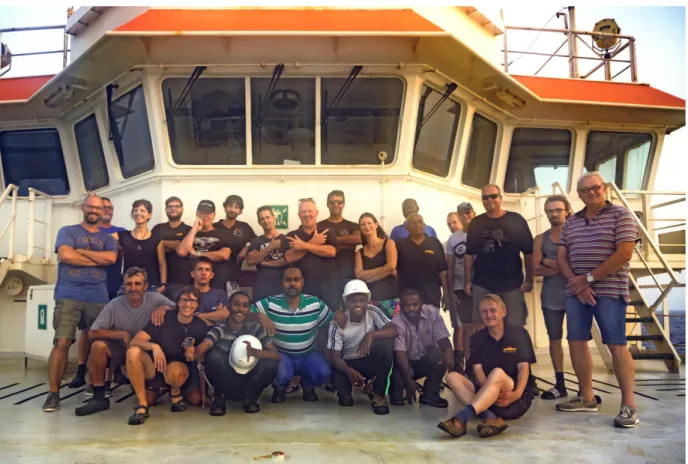
Figure 2.1 Scientific and ship´s crew of RV Pelagia Expedition 64PE-445 SaltAx in front of the bridge.
2 Participants 2.1 Scientific Crew
01. Dr. Nico Augustin Chief Scientist GEOMAR
02. Dr. Neil C. Mitchell Geophysics UMAN
03. Dr. Froukje M. van der Zwan Petrology GEOMAR
04. Dr. Anne-Cathrin Wölfl Bathymetry GEOMAR
05. Dr. Izzeldin Ahmed Yousif Nasr Geophysics IMR-RSU
06. Dr. Mudather Abdo Mohamed Osman Sedimentology IMR-RSU
07. Jonas Preine Geophysics UHAM
08. Martin Schade Bathymetry GEOMAR
09. Husameldin Osman Ahmed Ismail Sedimentology IMR-RSU
10. Abubaker Mahmuod Mohammed Yousif Geophysics GRAS
11. Mudathir Abdalla Mohammed Abd Alla Marine Geology GRAS
12. Sofian Abdelsamad Observer Port Sudan
2.2 Affiliations
GEOMAR
Helmholtz Zentrum für Ozeanforschung Kiel FB4 Dynamik des Meeresbodens
Wischhofstraße 1-3, 24149 Kiel Germany
UHAM, University of Hamburg Fachbereich Geowissenschaften Marine Seismik und Hydroakustik Bundesstraße 33, 20146 Hamburg Germany
UMAN, University of Manchester
School of Earth and Environmental Sciences The University of Manchester
Oxford Rd, Manchester M13 9PL United Kingdom
IMR-RSU, Institute for Marine Research Red Sea University Port Sudan
P. O. Box 24, Port Sudan Sudan
GRAS, Geological Research Authority of Sudan Ministry of Minerals
Khartoum Sudan
2.3 Ship’s Crew
01. John Ellen Master
02. Noortje Loonen Chief Officer
03. Peter Lucassen 2nd Officer
04. Bert Hogewerf Chief Engeneer
05. Inno Meyer 2nd Engeneer
06. Cor Stevens Bosun
07. Martin de Vries AB1
08. Norberto dos Santos AB2
09. Peter van Maurik AB3
10. Iwan den Breejen Cook
11. Vitalijs Maksimovs Stewart
12. Jan Boskemper Electrician
13. Sven Wolffers Technical Support
14. Barry Boersen Technical Support
3 Research Programme
(N. Augustin, F.M. van der Zwan, N.C. Mitchell)
3.1 Scientific Questions and Goals
3.1.1 Tectonics and Volcanism of the Red Sea Rift
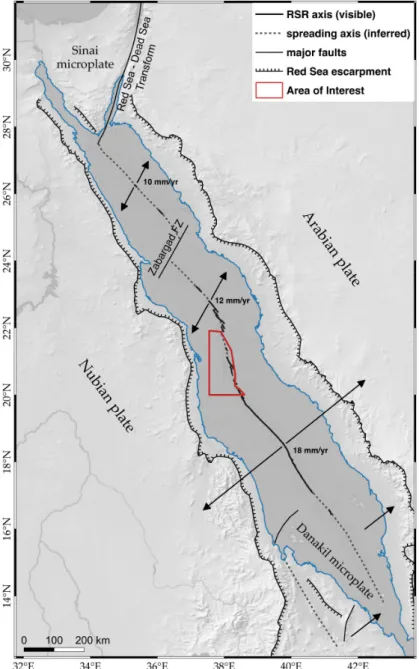
The Red Sea is a young ocean with a <60 km wide axial trough and a maximum depth of 2,860 m that is opening due to the on-going separation of the Nubian and Arabian plates (see Figure 3.1;
e.g. Rasul et al., 2015). Current spreading rates increase southwards from <10 in the northern Red Sea to ≈18 mm/yr at 18°N (Chu and Gordon, 1998). Hence the Red Sea Rift (RSR) can be classified as an ultra-slow spreading ridge (cf. Dick et al., 2003). South of 18°N spreading rates decrease due to the eastward movement of the Danakil block together with the Arabian plate (Eagles et al., 2002). The oldest (~5 Ma) basaltic seafloor present in the axial trough occurs at 17°N (e.g.
Courtillot, 1982; Cochran, 1983), but seafloor spreading may have begun much earlier at 8-12 Ma (Izzeldin, 1987; Augustin et al., 2014a; Augustin et al., 2016). This older crust is buried beneath thick blankets of Miocene evaporites ("salt") and younger hemipelagic sediments, which have flowed and slumped towards the axis from the basin margins (Mitchell et al., 2010; Augustin et al., 2014a; Mitchell and Augustin, 2017)
In the southern part of the Red Sea (south of 19.5°N) the axial valley is continuously exposed and well developed with rift-parallel normal faulting and extensive volcanism (e.g. Roeser, 1975;
van der Zwan et al., 2013; Augustin et al., 2016). Between 19.5°N and 23.5°N basalt occurs in wide troughs and basins, the so-called Red Sea “Deeps” (e.g. Pautot, 1983; Bonatti, 1985; Ligi et al, 2012). The seafloor in the central Red Sea Deeps is in general more tectonized than that found in the southern Red Sea, although abundant evidence for volcanism is still present, including the local occurrence of large (8-11 km diameter) axial volcanic highs and dome volcanoes in the Thetis, Hatiba and Aswad Deeps indicating robust magmatism over long periods (Ligi et al. 2012;
Metz et al., 2013; van der Zwan et al., 2015; Augustin et al., 2014a, 2016). In addition to the axial domes, the bathymetry of the volcanic troughs features the typical morphology of ultra-slow spreading rifts, such as a well-defined rift valley with clear normal fault scarps and overlapping volcanic ridges and have typical MOR basalts, thus making the RSR a typical continuous ultra-slow spreading ridge (cf. Michael et al., 2003; Searle and Escartin, 2004; van der Zwan et al., 2015;
Augustin et al., 2016; 2019). Only oceanic core complexes, common features at slow and ultra- slow spreading rifts elsewhere on Earth, which expose mantle and/or lower crustal rocks at the seafloor have not been found in the RSR so far, but can be explained by the proximity of the Afar Plume and generally higher mantle temperature beneath the Red Sea, which have led to more extensive mantle melting (Girdler and Evans, 1977; Augustin et al., 2016).
The Red Sea Deeps are separated by shallower Inter-Trough Zones (ITZ), where the sediment sequences from the flanks cover the axial trough (Augustin et al., 2014a). At these locations craters (volcanic explosion features) and volcanoes, visible in bathymetry and multibeam backscatter underneath the evaporites, suggest interaction between salt and volcanism (van der Zwan et al., 2013; Augustin et al., 2014a, Augustin et al., 2016).
Figure 3.1 General tectonic overview of the Red Sea. Spreading velocities and directions are given by the arrows. The working area within the Sudanese EEZ is indicated by the red polygon.
North of 23.5°N and the Zabargad fracture zone the Deeps are more isolated and basalt has been found only in Mabahiss and Shaban Deeps so far (Bonatti et al., 1984; Pautot et al., 1984;
Guennoc et al., 1988; Fig 2). Due to a lack of systematic, high resolution bathymetric, seismic and gravimetric surveys as well as seafloor sampling in the northern Red Sea, the extent of basaltic occurrences and the presence and exact location of the rift axis and its continuation to the central Red Sea remain unclear.
3.1.2 Halokinetic deformation in the Red Sea
Wide-spread thick evaporite deposits, similar as found in the Red Sea ("salt giants", Mitchell et al., 2015) are associated with major commercially important oil and gas provinces, in particular, those in the South Atlantic including the Santos Basin, and those in the Gulf of Mexico, areas in which many European oil and gas companies are working. However, at these locations, the early evolutions of the original evaporite deposits (when the salt potentially flowed over synrift clastic
deposits and influenced their thermal and fluid-seal histories) are now obscured by thick overlying terrigenous sediments and by extensive halite mobilization (Hudec and Jackson, 2007).
Halokinetic movements cause local steepening of slopes, so marine evaporate deposits form potential geohazards by slope failure that threaten submarine cables, pipelines and other installations, as well as marine ecosystems.
The unique environment of the Red Sea has a tremendous potential for studying the early evolution of salt giants, because the evaporites there are very young and were deposited until around the end of the Miocene (Orszag-Sperber et al., 1998; Whitmarsh et al., 1974; Hughes and Beydoun, 1992). Unlike in the Mediterranean, where evaporite displacement has also been identified in similarly young deposits (Gradmann et al., 2005; Reiche et al., 2014), in the Red Sea the evaporites have formed a series of spectacular flow-like features that are invading the spreading center (Augustin et al., 2014a, 2016; Mitchell, 2010; Feldens and Mitchell, 2015; Feldens et al., 2016). Locally around Thetis Deep at 22.5°N, RSR, flowage appears to be most advanced where seismic refraction and gravity data suggest that the underlying basement is deeper (Mitchell and Park, 2014), so the thickness of the flows or their temperature appears to affect their rates of movement. The latter would be compatible with results of rock deformation experiments, which show that strain rate of halite increases with temperature (Feldens and Mitchell, 2015).
However, those experiments also show that pressure solution creep occurs rapidly in the presence of traces of pore waters; they can explain rapid deformation rates of extruded terrestrial salt deposits (Schléder and Urai, 2007) but seem at odds with the Red Sea deposits, which appear to be moving more slowly at rates comparable to seafloor spreading rates in the northern and central Red Sea of about 12 mm/yr (Chu and Gordon, 1998). If they were moving faster, the spreading centers would have been entirely inundated.
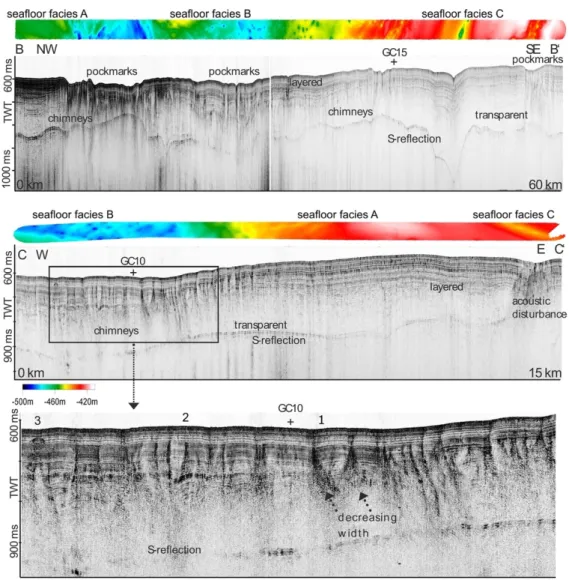
Seismic reflection data collected in various parts of the Red Sea reveal the character of the top of the evaporites (e.g., Mitchell et al., 2010; Ehrhardt and Hübscher, 2015, Feldens et al., 2016).
The example in Figure 3.2 shows that reflection S (marking the top of the evaporites) has revealed some surface roughness potentially indicating erosion by penetrating fluids or representing the surface expressions of faulting and salt movements. Some areas of the evaporite surfaces show more relief than others but an overall picture is not available yet. Furthermore, the data show a varied stratigraphy in overlying sediments.
These varying morphologies suggest that the evaporites have not been moving at steady rates over time, though more seismic data are needed to show whether this is true more generally in the Red Sea. Unsteady movements present a challenge for our current understanding of the stresses driving evaporite deformation and the varying boundary conditions to the evaporite deposits.
Another open question is how the oceanic rift formation, normal faulting, block rotation and the emplacement of large volcanic edifices and ridges influences interacts with the destabilized salt.
Thus, further seismic data with higher spatial resolution are needed to resolve the three- dimensional character of unconformities, which commonly occur at reflection S, to explain their origin as e.g. erosion and land sliding and connect them with other data on evaporite movements.
Evidently, there is still much to learn about how salt giants develop in their early stages and detailed morphological and structural studies are the key to understand the kinematics of salt giants in the Red Sea.
Figure 3.2 Seismic imaging of sedimentary layers and the upper salt layer (S-reflection) collected with sparker seismic on the eastern rift shoulders at 20°N, (Fig. 1) from RV Pelagia in 2012 (Feldens et al., 2016). Bathymetric data (1000 m wide) of the recorded seismic profile are displayed on top of the seismic data. The profiles show that sparker seismic can record both the S-reflector as well as internal layering of overlying sediments.
3.1.3 Aims of Expedition 64PE-445 SALTAX
The SALTAX project aimed to investigate the surface morphology and sub-seafloor structure of volcanic basement and giant salt flows in the Red Sea to locate the oceanic basement and to study the oceanic crust and evaporates that are intimately linked in their evolution. In detail the following questions were addressed:
What is the extent of oceanic crust underneath the salt giants?
The presence and with that, the location of oceanic crust below the salt and sediment glaciers in the Red Sea is still under debate. Detailed morphological analyses of multibeam data will help to identify the continuation of the volcanic structures and oceanic basement off the deeps. If buried under salt, high resolution bathymetry can be used to identify the approximate position of large boundary faults by tracing of salt flows. Whenever the salt cover is thin enough and close to the salt flow fronts, sparker seismic data can help to identify buried structures underneath the salt and sediments and help to identify shallow off-axis basement. Additionally, we investigated some unmapped areas to identify possible basement outcrops. Any information on the nature of the crust
beneath the salt glaciers in the northern Red Sea will have large implications for the complete geological model of the Red Sea and for modes of ocean spreading in general.
What is t h e structure of “salt giants” in the Red Sea and how did they evolve?
High-resolution bathymetric data will be used to identify the locations, sizes and flow direction of salt flows (geomorphologically indicated by flow-parallel ridges and valleys). This will be used to determine how large the root zones of the salt flows are and how much salt volume was mobilized. For this, a detailed multibeam survey behind the advancing salt glaciers and sparker seismic surveys to identify S-layer depth was performed. To look further into the salt and image the boundary to the basement was a challenge but possible where the salt cover was not too thick.
Bathymetric and seismic data give information about sub-seafloor structures, sediment thickness, salt surface geometry, internal layering and therefore allow detailed discussions on salt flow kinetics and the change of kinetics in time (by means of the layering of overlying sediments).
3.1.4 References (Research Programme)
Almogi-Labin, A., Luz, B., Duplessy, J.C. (1986) Quaternary Paleo-Oceanography, Pteropod Preservation and Stable- Isotope Record of the Red-Sea. Palaeogeogr., Palaeoclim., Palaeoecol. 57, 195–211.
Augustin N., Devey C.W., van der Zwan F.M., Feldens P., Bantan R.A., Kwasnitschka T. (2014a) The Rifting to Spreading Transition in the Red Sea. Earth Planet. Sci. Lett. 395, 217-230.
Augustin, N., Schmidt, M., Devey, C.W., Al-Aidaroos, A.M., Kürten, B., Eisenhauer, A., Brückmann, W., Dengler, M., van der Zwan, F.M., Feldens, P. et al., 2014. The Jeddah Transect Project: Extensive mapping of the Red Sea Rift. InterRidge News 22, 68–73.
Augustin, N., van der Zwan, F.M., Devey, C.W., Ligi, M., Kwasnitschka, T., Feldens, P., Bantan, R.A., Basaham, A.S. (2016): Geomorphology of the Central Red Sea Rift: Determining Spreading Processes. Geomorphology 274, 162-179. doi: 10.1016/j.geomorph.2016.08.028
Augustin, N., Devey, C. W. & van der Zwan, F. M. (2019) A Modern View on the Red Sea Rift: Tectonics, Volcanism and Salt Blankets, in Geological Setting, Palaeoenvironment and Archaeology of the Red Sea (eds. Rasul, N. &
Stewart, I.C.F.) 37–52, Springer Nature, 2019. doi:10.1007/978-3-319-99408-6_3
Bonatti E. (1985) Punctiform initiation of seafloor spreading in the Red Sea during transition from a continental to an oceanic rift. Nature 316, 33-37.Chu D., Gordon R.G. (1998) Current plate motions across the Red Sea. Geophys.
J. Int. 135, 313-328.
Chu, D., Gordon, R., 1998. Current plate motions across the Red Sea. Geophys J Int 135, 313–328. Cochran, J.R., Karner, G.D., 2007. Constraints on the deformation and rupturing of continental lithosphere of the Red Sea: the transition from rifting to drifting. Geological Society, London, Special Publications 282, 265–289.
Courtillot V. (1982) Propagating rifts and continental breakup. Tectonics 1, 239-250.Dick H.J.B., Lin J., Schouten H. (2003) An ultraslow-spreading class of ocean ridge. Nature 426, 405-412.
Dick, H.J.B., Lin, J., Schouten, H., 2003. An ultraslow-spreading class of ocean ridge. Nature 426, 405–412.
doi:10.1038/nature02128
Eagles G., Gloaguen R., Ebinger C. (2002) Kinematics of the Danakil microplate. Earth Planet. Sci. Lett. 203, 607- 620.
Ehrhardt, A., Hübscher, C. (2015) The formation, morphology, oceanography and environment of a young ocean basin.
In: Rasul, N.M.A., Stewart, I.C. (Eds.) The Red Sea. pp. 99-121. Springer
Feldens, P., Mitchell, N.C. (2015) Salt Flows in the Central Red Sea. In: Rasul, N.M.A., Stewart, I.C. (Eds.) The Red Sea. pp. 205-218. Springer
Feldens, P., Schmidt, M., Mücke, I., Augustin, N., Al-Farawati, R., Orif, M., Faber, E. (2016): Expelled subsalt fluids form a pockmark field in the eastern Red Sea. Geo-Marine Letters 36, 339-352. doi: 10.1007/s00367-016-0451-9 Girdler R.W., Evans T.R. (1977) Red Sea heat flow. Geophys. J. Int. 51, 245-251.
Izzeldin A.Y. (1987) Seismic, gravity and magnetic surveys in the central part of the Red Sea: their interpretation and implications for the structure and evolution of the Red Sea. Tectonophysics 143, 269-306.
Gradmann, S., Hübscher, C., Ben-Avraham, Z., Gajewski, D., Netzeband, G., (2005) Salt tectonics off northern Israel. Marine and Petroleum Geology 22, 597–611.
Guennoc P., Pautot G., Coutelle A. (1988) Surficial structures of the northern Red Sea axial valley from 23 N to 28 N:
Time and space evolution of neo-oceanic structures. Tectonophysics 153, 1-23.
Hudec, M.R., Jackson, M.P.A. (2007) Terra infirma: Understanding salt tectonics. Earth-Science Reviews 82, 1-28.
Hughes, G.W., Beydoun, Z.R. (1992) The Red Sea - Gulf of Aden: biostratigraphy, lithostratigraphy and palaeoenvironments. J. Petrol. Geol. 15, 135-156.
Izzeldin, A.Y. (1987) Seismic, Gravity and Magnetic Surveys in the Central Part of the Red-Sea – Their Interpretation and Implications for the Structure and Evolution of the Red-Sea. Tectonophysics 143, 269–306.
Ligi M., Bonatti E., Bortoluzzi G., Cipriani A., Cocchi L., Caratori Tontini F., Carminati E., Ottolini L., Schettino A. (2012) Birth of an ocean in the Red Sea: Initial pangs. Geochem. Geophys. Geosyst. 13, Q08009.
Marshak, S., Bonatti, E., Brueckner, H., Paulsen, T. (1992) Fracture-zone tectonics at Zabargad Island, Red Sea (Egypt). Tectonophysics 216, 379-385.
McKenzie, D.P., Davies, D., Molnar, P., 1970. Plate tectonics of the Red Sea and East Africa. Nature 226, 243–248.
Metz D., Augustin N., van der Zwan F.M., Bantan R.A., Al-Aidaroos A.M. (2013) Mabahiss Mons, 25.5° N Red Sea Rift: Tectonics and Volcanism of a Large Submarine Dome Volcano. EGU General Assembly Conference Abstracts 15, 10487.
Michael P., Langmuir C., Dick H., Snow J., Goldstein S., Graham D., Lehnert K., Kurras G., Jokat W., Mühe R. (2003) Magmatic and amagmatic seafloor generation at the ultraslow-spreading Gakkel ridge, Arctic Ocean. Nature 423, 956-961.
Mitchell N.C., Ligi M., Ferrante V., Bonatti E., Rutter E. (2010) Submarine salt flows in the central Red Sea. Geol.
Soc. Am. Bull. 122, 701-713.
Mitchell, N.C., Park, Y. (2014) Nature of crust in the central Red Sea. Tectonophysics 628, 123–139.
Mitchell, N. C., Ligi, M., Feldens, P., Hübscher, C. (2015), Deformation of a young salt giant: regional topography of the Red Sea Miocene evaporites. Basin Res.
Mitchell, N., Augustin, N. (subm.) Halokinetics and other features of GLORIA long-range side-scan sonar data from the Red Sea. submitted to Petroleum Geology
Orszag-Sperber, F.,Harwood, G., Kendall, A., Purser, B.H. (1998) A review of the evaporites of the Red Sea - Gulf of Suez rift. In, Purser, B.H., Bosence, D.W.J. (Eds.), Sedimentation and Tectonics in Rift Basins: Red Sea-Gulf of Aden. Chapman and Hall, London, p. 409-426.
Pautot G. (1983) Les fosses de la Mer Rouge: approche géomorphologique d'un stade initial d'ouverture océanique réalisée à l'aide du Seabeam. Oceanolog. Acta 6, 235-244.
Pautot G., Guennoc P., Coutelle A., Lyberis N. (1984) Discovery of a large brine deep in the northern Red Sea. Nature 310, 133-136.
Rasul N.M., Stewart I.C., Nawab Z.A. (2015) Introduction to the Red Sea: Its Origin, Structure, and Environment, in The Red Sea (eds. N.M.A. Rasul, I.C.F. Stewart). Springer, 1-28.
Reiche, S., Hübscher, C., Beitz, M. (2014) Fault-controlled evaporite deformation in the Levant Basin, Eastern Mediterranean. Marine Geology 354, 53–68.
Roeser H.A. (1975) A detailed magnetic survey of the southern Red Sea. Geol. Jahrb. 13, 131-153. Rohling, E.J., Grant, K., Bolshaw, M., Roberts, A.P., Siddall, M., Hemleben, C., Kucera, M. (2009). Antarctic temperature and global sea level closely coupled over the past five glacial cycles. Nature Geoscience 2, 500–504.
Ross, D.A., Schlee, J. (1973) Shallow structure and geologic development of the southern Red Sea. Geol. Soc. Am.
Bull. 84, 3827-3848.
Schléder, Z., Urai, J.L. (2007) Deformation and recrystallization mechanisms in mylonitic shear zones in naturally deformed extrusive Eocene-Oligocene rocksalt from Eyvanekey plateau and Garmsar hills (central Iran). J. Struct.
Geol. 29, 241-255.
Schott, F., Pollehne, F., Quadfasel, D., Stramma, L., Wiesner, M., Zeitschel, B. (1995) Arabian Sea 1995 Cruise No.
32, Meteor-Berichte 95-6, Letstelle Meteor, University of Hamburg, 163pp
Searle R., Escartin J. (2004) The rheology and morphology of oceanic lithosphere and mid-ocean ridges, in Mid- Ocean Ridges. Geophys. Monogr. Ser. 148, (eds. C.R. German, J. Lin, L.M. Parson), 63-93.
Sultan, M., Becker, R., Arvidson, R.E., Shore, P., Stern, R.J., Alfy, El, Z., Guinness, E.A., 1992. Nature of the Red Sea crust: A controversy revisited. Geol 20, 593
Talbot, C., Augustin, N. (2016): Submarine Salt Karst Terrains. AIMS Geosciences 2(2), 182–200.
doi:10.3934/geosci.2016.2.182
Taylor, B., Goodliffe, A., Martinez, F., Hey, R., 1995. Continental rifting and initial sea-floor spreading in the Woodlark basin. Nature 374, 534–537.
van der Zwan F.M., Augustin N., Devey C.W., Bantan R., Kwasnitschka T. (2013) New insights into volcanism and tectonics in the Red Sea Rift. EGU General Assembly Conference Abstracts 15, 7188.
van der Zwan, F.M., Devey, C.W., Augustin, N., Almeev, R.R., Bantan, R.A., Basaham, A. (2015): Hydrothermal activity at the ultraslow- to slow-spreading Red Sea Rift traced by chlorine in basalt. Chemical Geology 405, 63–
81. doi:10.1016/j.chemgeo.2015.04.001
Whitmarsh, R. B., Weser, O. E., Ross, D. A. (1974) Initial Reports of the Deep Sea Drilling Project, 23B. (U. S.
Government Printing Office).
3.2 Scientific Operations
In addition to the scientific goals listed above, secondary original research questions related to the location of a buried rift axis in the northern Red Sea and the expedition was planned to occur in the Northern Red Sea in Saudi Arabia waters. An application for work permission was submitted to the Saudi Arabian authorities in cooperation with the Saudi Geological Survey. Unfortunately, no research permission for Saudi Arabian waters was available when RV Pelagia entered the Red Sea nor was it given later during the cruise. Nevertheless, the primary scientific goals of this expedition (volcanic activity and oceanic basement underneath the salt, internal structures of salt giants) could be achieved nearly everywhere in the Red Sea basin and thus as a backup, a request for work permission in Sudanese waters was made and permission granted at short notice and the working area was shifted into the central Red Sea in the Sudanese EEZ.
To achieve the scientific aims described above we mainly combined high resolution multibeam surveys, magnetic field measurements, seismic profiles and some minor seafloor sampling (gravity coring, hard rock dredging). The ship's multibeam system was of significant importance for the expedition. The bathymetric surveys where carried out with the ship's own EM302 multibeam echo-sounder system. Two magnetometers were towed as a gradiometer during the larger bathymetric surveys to collect information about magnetic field anomalies in the working area.
The seismic was the second important geophysical tool during this expedition. A delta sparker seismic system was used to collect high-resolution seismic data along predefined survey lines - based on multibeam data - to examine the sub-sedimentary structures, the depth of the evaporites and sub-salt structures and thus provide the base for extensive post-cruise modelling of the salt flows. Swath mapping of seafloor morphology, magnetics and seismic data collection was done in real-time, which enabled a quick adaption of mapping lines and a very fast (basic) identification of subsurface features. A detailed processing and interpretation of the collected data will be carried out in the home labs. For limited locations, hard rock sampling was planned with geological rock dredges during this expedition. Unfortunately, one dredge was lost including an amount of cable early during the expedition, which made further dredging activities impossible. Some gravity cores where taken instead to recover sediment samples within some areas of interest (e.g. some crater structures in the Poseidon-Erba ITZ and within Discovery Deep).
3.3 Measures of Responsible Conduct of Marine Research
The scientific work performed during Expedition 64PE-445 strictly adhered to the Code of Conduct for Responsible Marine Research in the Deep Seas and High Seas of the OSPAR Maritime Area. Sampling and acoustic measurements were restricted solely to methods and areas being essential to conduct the research outlined above, and the number of sampling stations has been reduced to the necessary minimum. Acoustic measurements were performed in a way to minimize the impact on marine mammals by activating the mammal protection system of the Kongsberg multibeam echo-sounder and a slow start of the sparker-seismic system accompanied with lookouts for marine mammals from the bridge. Our close cooperation with international scientists, organizations, and authorities as well as public domain data bases and web sites ensured that our activities did not disturbed experiments of other scientists. That also ensures the fullest possible use of all samples and data as well as comprehensive data-sharing.
4 Narrative of the Cruise (N. Augustin)
RV Pelagia arrived in the port of Limassol, Cyprus on August 25, 2018. One day later 7 scientists of the SaltAx expedition team boarded the vessel and received a warm welcome from the ship’s crew. Four more scientists boarded the vessel at a later stage in Port Sudan, Sudan. Since a few things needed to be organized on the working deck still, we started to unload parts of the expedition equipment and begun to setup the labs, mainly in the hydroacoustics/CTD lab and in the decks- lab. In the afternoon of August 26, RV Pelagia left port for about three hours to do needed maintenance measurements and tests of the ship´s diesel-electric aggregator, which ended successful.
On August 27, the working deck was completely free for our scientific equipment. The winch for the magnetometer tows was placed on the working deck and we continued with the setup of the computer lab for seismic and magnetic measurements. A first scientific meeting was held for the participating scientists to introduce everybody to the planned work but before that we were familiarized with the rules and facilities on board and obtained the obligatory safety instructions.
The pilot came at 17:30 local time and we finally left the port of Limassol heading towards the Suez Canal.
The following day started with a safety drill in the morning to train crew and scientists for an emergency case and in the safety rules. In the afternoon of August 28, we reached the Suez Canal and anchored at our waiting position by 14:30 in the afternoon. During the following night and day, we made our way through the Suez Canal, just interrupted by an ≈8 hours waiting slot in the Bitter Lakes. We left the Suez Canal on the evening of August 29.
We had a few interruptions of the internet communication on the vessel during these last days but somehow these short interruptions became a complete breakdown of internet communication on August 30, which got only solved several days later.
Until we arrived Port Sudan in the morning of on September 02, we built up all electronic equipment for the sparker seismic system and the magnetic measurements and prepared the labs for the forthcoming days of scientific activities. It turned out that some problems with the sparker system, that were described in the cruise report from expedition 64PE-350 in 2011, could affect us too because the temperature in the container (where the energy supply was supposed to be placed) reached up to 40°C. The solution was to place the power supply in the airconditioned dry- lab instead. During the transit to Port Sudan we also reached the western border of our working area. Here, we stopped the vessel in the evening hours of September 01, to do a short test of the magnetic potentiometer system. This test initially failed due to a communication error with one of the sensors but could be fixed by modifying software parameters.
On the morning of September 02, we reached Port Sudan to take on board 4 Sudanese colleagues from the Institute of Marine Research (IMR) of the Red Sea University (2), from the Sudanese Ministry of Minerals (2) and, in addition to the original planning one Sudanese Safety Observer.
The port operations went smooth for RV Pelagia but the immigration and costumes procedures took longer than expected. However, the 5 guests boarded RV Pelagia at 15:00 in the afternoon.
A short meet & greet on deck with the vice-chancellor of the Red Sea University and some representatives could be arranged as well and we left Port Sudan at 16:00, heading towards the working area, which we reached in the early morning hours of September 03.
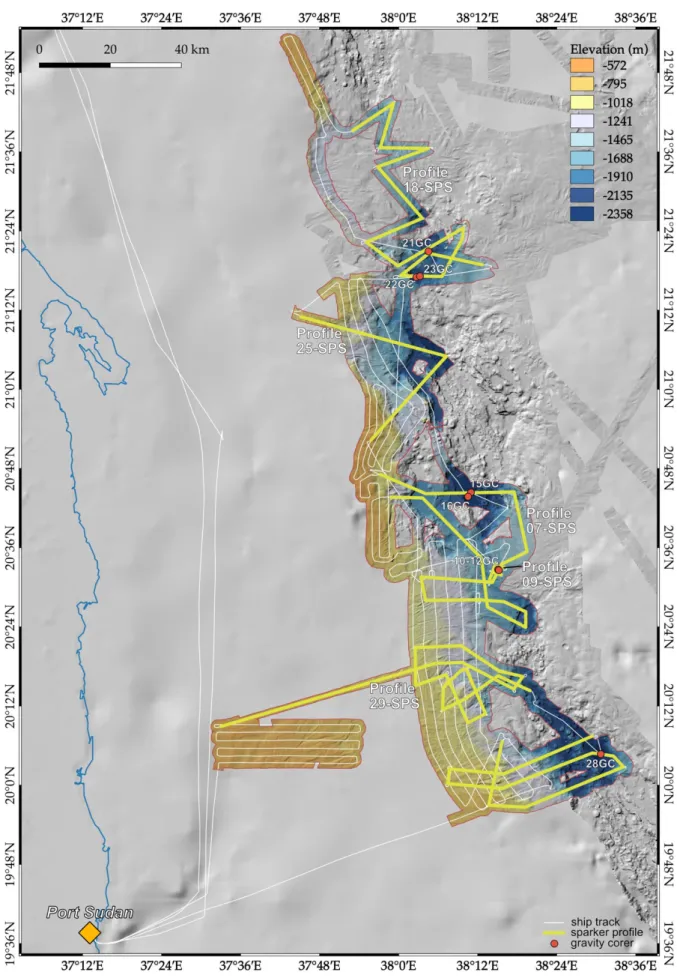
Fig. 4.1 Overview map of the cruise track, bathymetric mappings, sparker seismic profiles and gravity coring stations during expedition 64PE-445 SaltAx. For more details on the station works and preliminary results see text.
We reached the southern border of the working area at 01:30 h. Station work began with the deployment of the magnetometers to perform a coupled multibeam/magnetometer survey (station
#01 MB/MAG) of the salt flows at the western rift flank at the Port Sudan Deep area up to the Erba-Poseidon ITZ, which was not mapped during RV Pelagia expedition 64PE-350/51 in 2012.
The multibeam/magnetic survey was paused for a CTD cast (station #02 CTD) to obtain a new sound velocity profile. In addition, 24 water samples from the bottom depth of 2,550 m up to the surface water were taken for the IMR. Unfortunately, one of the magnetometers was giving out invalid data and needed to be exchanged during this stop. In addition, we spent three hours for a detailed test run of the sparker seismic system (Station #03 SPS-Test). After tuning the buoyancy of the streamer, this test worked very well and gave promising first results. The multibeam/magnetometer survey was continued (Station #04 MB/MAG) until the noon hours of September 04, which gave a very good picture of the salt flows west of the Red Sea Rift at 19°58’N and 20°35’N and a solid base to plan the first sparker profile (Station #05 SPS).
The first, long SPS profile was started in the afternoon of September 04 and crossed the Erba- Poseidon ITZ, some salt flow blocking volcanic highs, the rift valley at Erba Deep, uplifted and sedimented terraces west of Erba Deep and again went over the salt flows. Unfortunately, a software failure in the seismic acquisition software caused a crash and the SEGY-file was corrupted. It seems that the acquired data were still accessible but when reading it with the seismic processing software, the data are not sorted in the right order. This issue might be fixed after the cruise. However, since this profile crossed the ITZ and some other important morphological features we decided to repeat the profile to be sure to have a functional dataset. The file format was changed to SEGD, which has the advantage that one file is created for each shot to avoid a possible loss of data with another software crash.
Before we started the new SPS line in the evening of September 05, we mapped out some parts of the inflowing salt on the rift flank shoulders (station #06 MB). The following SPS line (station
#07 SPS) combined the first profile (station #05 SPS) and a second planned profile that was designed to image the terraces west of Erba perpendicular to the first profile, some loose sediment blocks at the suture in the Erba-Poseidon IZT, covered volcanoes at Poseidon deep and the salt flows strains into Poseidon deep (Figures 4.1 and 4.2).
The ≈100 km long profile took about 30 hours in total and was finished in the early morning hours of September 07. The first, roughly filtered seismic data look amazing. We see very diverse sedimentary structures that overlay the upper salt reflector (S-reflector) and we can follow the S- reflector in many profiles. In some areas we even see reflectors within or under the salt, which is at this moment still speculative but may be a glimpse of the underlaying volcanic basement in some cases.
Since we had some distance to transit to the beginning of the following SPS station we did some mapping during transit (#08 MB) to close gaps in our datasets.
As the crater structure in the Erba-Poseidon ITZ is an important indication for volcanism within the salt and sediment covered ITZ, we decided to do crossing sparker seismic profiles (station #09 SPS; Figures 4.1 and 4.2) over that structure with a lower speed of 2 knots to achieve a best possible resolution. After this we took two gravity cores in the center of the crater (stations #10GC,
#11 GC) and one at the rim (#12GC). None of the cores could penetrate deeper than 100 cm and recovered pelagic sediments with some harder pebbles and carbonates.
During the night from September 07 to September 08, we started with a small dredging program to sample some structures with volcanic appearance in between the salt flows. The first dredge tow (station #13 GC) did not show any higher activity on the tension-meter and returned empty.
Unfortunately, the second dredge (station #14 GC) got anchored very badly, which resulted in the loss of the dredge and a part of cable after several hours of recovery efforts. Even though a second dredge was available, the loss of the cable prevented us from any further dredging activities.
Therefore, we proceeded with the work program and took two GCs in Erba deep which retrieved one 1.5 m (station #15 GC) and one >5 m core (station #16 GC). The second core penetrated too deep, resulting in that the top sediments could not recovered but correlation with the shorter core might be possible. In contrast to Pelagia expedition 64PE-350 we were able to sample metalliferous sediments in Erba Deep with both cores.
After coring we started mapping at the western flank of the Shagara-Aswad-Erba trough, where Expedition 64PE-350/351 could not mapped the salt flow fronts back in 2012. The bathymetric survey (station #17 MB/MAG) started in the evening of September 08 including towed magnetometers. In contrast to the first working week, the weather became significantly poorer with high winds and significant wave heights of up to 2 m. Since the forecast indicated a slightly better weather window, which is primary important for good quality of sparker data, we started one long sparker seismic survey in the deeps area at 21.3°N and the adjacent ITZ north of it.
This profile (station #18 SPS) began in the morning of September 09 and took until the late evening of September 10. We did seismic lines across DSDP drill sites 226 and 227 for eventually correlation of the seismic data with the DSDP core descriptions. Further we surveyed some more salt and sediment flows and the 21.5°N ITZ including volcanic structures.
After finishing the profile in the late evening of September 10, a short mapping survey (station
#19 MB) was followed by a CTD cast for a new SVP profile in the northern part of the working area (station #20 CTD) and coring activities in the Red Sea Rift at 21.3°N. One gravity core at 21°20.920’N, 38°04.548’E recovered 5 m of metalliferous mud (station #21 GC, see station list).
A first core in Discovery Deep that was targeting a crater structure within the deep – not visible in the data from P408 or 64PE350/51 (2011, 2012 respectively) – recovered only some small chips of basaltic material and clay fragments (station #22 GC). A clear indication for volcanic activity in Discovery Deep. Gravity coring further east of the crater in Discovery Deep recovered then 5 m of material including metalliferous muds and sandy, grainy layers (station #23 GC). This was followed by another bathymetry survey (station #24 MB) including transit to the next sparker profile at the western flank of Shagara-Aswad-Erba trough.
Profile #25 SPS started in the morning of September 11 and contained two long lines and aimed on salt and sediment structures further away from the rift valley than the SPS profiles before. It crossed the large tilted blocks/terraces at the western rim of the rift and crossed volcanic terrain (Figures 4.1 and 4.2). The profile was finished in the later evening of the same day and was followed by a transit (including mapping, station #26 MB) towards the southern border of the working area, where another long sparker seismic survey was planned to investigate the western rift shoulders in the Port Sudan Deep area. There complicated seabed morphologies especially a large land slide structure were the target of seismic survey #27 SPS that started in the morning of September 12 and was finished at noon time of September 14 in the close vicinity of Port Sudan Deep (Figures 4.1 and 4.2).
After collecting the sparker system back on deck we took one sediment core within Port Sudan Deep, which recovered 5 m of pelagic and metalliferous sediments (station #28 GC). The last long sparker survey was planned for the salt structures NW of Port Sudan deep, where some bathymetric evidence was given for subseafloor structures that may redirect the salt flows. The survey #29 SPS started in the evening of September 14 and was designed to leave the closer vicinity of the rift valley towards the African coast.
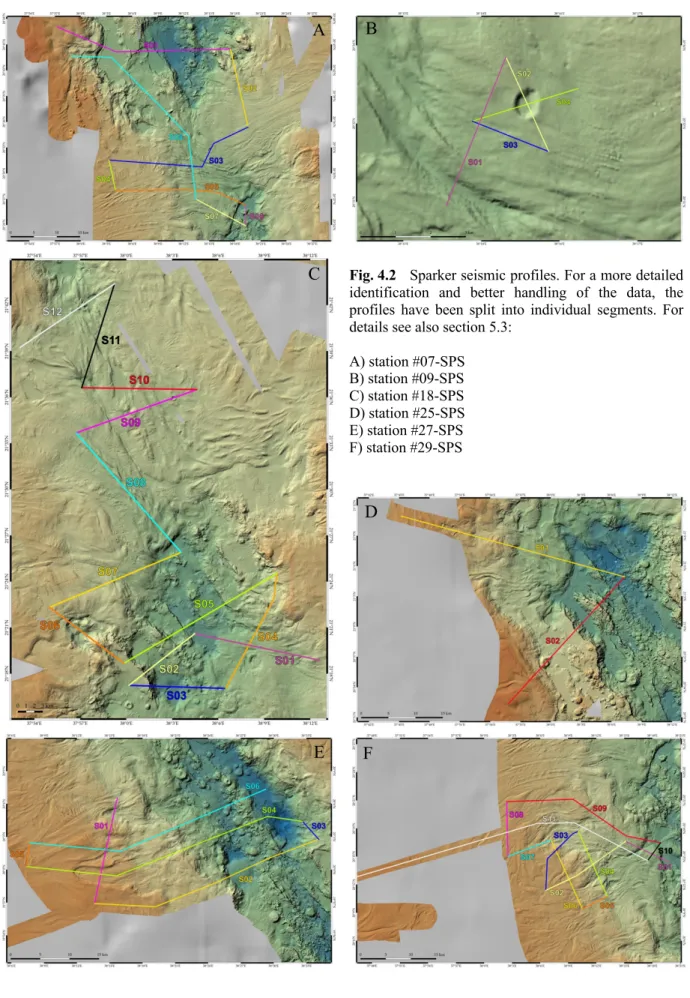
Fig. 4.2 Sparker seismic profiles. For a more detailed identification and better handling of the data, the profiles have been split into individual segments. For details see also section 5.3:
A) station #07-SPS B) station #09-SPS C) station #18-SPS D) station #25-SPS E) station #27-SPS F) station #29-SPS
A B
C
D
E F
The aim of the long line, off the rift valley, was to survey the salt and sediment layers far off the rift that may be less disturbed than the flows closer to the rift. This was already indicated in the profiles of station #25 SPS but only to a small extend. Thus, we decided to do a longer survey off the rift valley, which was finished during the late morning of September 16. Before we needed to leave the working area, we did some more multibeam mapping of the sedimentary structures in the SW of the working area. One of the aims was to identify changing morphological patterns in the seafloor that may give hints where the salt and sediment movement into the rift starts. In addition, we looked for the occurrence of pockmarks that occur often in water depths <700 m in the Red Sea. We left the working area in the late evening and reached Port Sudan in the morning of September 17.
In Port Sudan our Sudanese guests left the ship and RV Pelagia needed to bunker diesel and proviant in Port Sudan, which made a longer stay of several hours necessary. Thus, the scientific party followed an invitation of the Red Sea University (RSU) in Port Sudan to present some preliminary results of the cruise in a public lecture at the RSU main campus. This was followed by a small program to visit the aquarium of the Institute for Marine Sciences and a talk to the vice- chancellor of the RSU. We were back on RV Pelagia in the early afternoon and left port in the evening.
After three more days of sailing we reached Safaga in the early morning hours of September 21, one day later than planned during the cruise preparation. RV Pelagia was not going into port and we left the vessel in the morning via a tug boat. Most of the crew and all of the science party left the vessel in Safaga and started their travels home. This marks the end of expedition 64PE- 445. We like to thank the Master and the complete crew of RV Pelagia for their excellent support during the expedition!
5 Preliminary Results
5.1 Bathymetry and Geomorphology (A. Wölfl, M. Schade)
5.1.1 Multibeam Operations
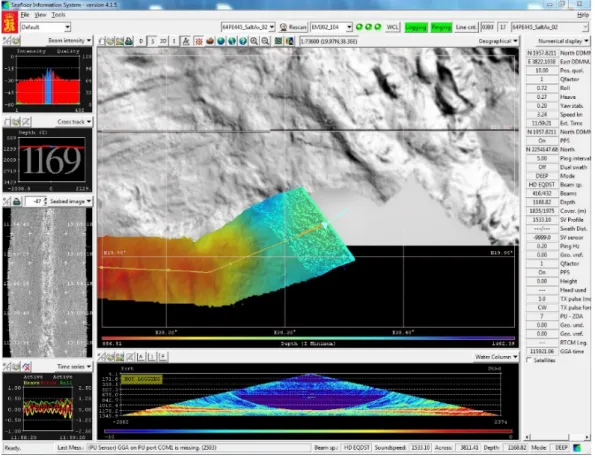
During RV Pelagia expedition 64PE-445, about 96 hours (4 days) of exclusive multibeam surveys resulted in a bathymetric dataset of approximately 5,980 km2 in the Sudanese Exclusive Economic Zone (EEZ) in the Red Sea, including the inter trough zone between Erba Deep and Poseidon Deep as well as the salt flows west of Port Sudan, Poseidon and Erba Deep in the southern working area. The northern working area consists the Deeps and salt flows at around 21°25’N, 38°E. Multibeam data was acquired using the hull-mounted EM302 echo sounder system provided by Kongsberg Maritim AS. The EM302 multibeam system collects bathymetric, corrected backscatter and water column imaging (WCI) deep water data via a wide swath with maximum excess of 150 degrees (2 x 75°). The installed configuration on board of RV Pelagia operates with a frequency of 30 kHz at water depth of up to 7000 m. It has an across-ship swath width of up to 5.5 times the water depth, to approximately 8 km with 288 beams and 32 soundings per swath. In addition, the EM302 is equipped with a function to reduce the transmission power to avoid hurting marine mammals if they are close by. Data acquisition has been done using the Kongsberg Seafloor Information System (SIS) Version 4.1.5, running in a Microsoft Windows 7 environment (Fig. 5.1). The average ship speed during the mapping operations was 7 knots.
Fig. 5.1 User interface of the Seafloor Information System (SIS) during the EM302 bathymetric survey west of Volcano and Port Sudan Deep. The grey background image shows the bathymetry collected during the Jeddah Transect Project and the colorized track the newly gathered bathymetric record.
The beam angle in SIS mostly ran on 60° to 65° but was manually corrected if necessary (e.g. if too small angles caused less overlap of the mapped track lines or during daily bad weather
conditions). The ping mode was set to automatic as well as the coverage mode. For bottom search the gates were set manually to 10 m minimum depth and 3000 m maximum depth.
CTD measurements were performed in every working area to calculate sound velocity profiles that were used to correct the hydroacoustic signals (see also section 5.4). The bathymetric record was edited directly after its collection. The data editing was made with Qimera (QPS Software) including an 3D-Editor with an outlier’s tool to filter overhanging and underlying pings (Fig. 5.2).
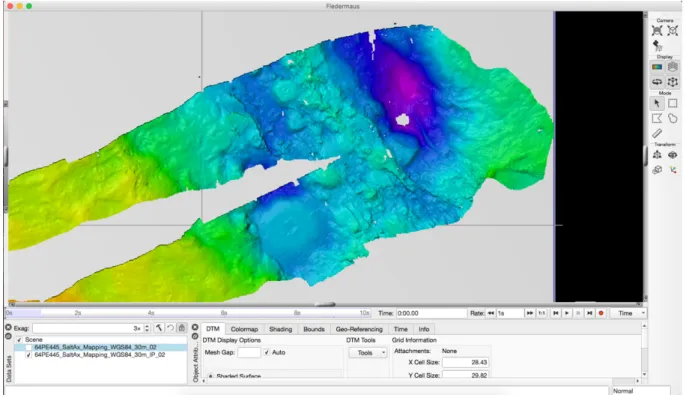
Further editing was done manually within the 3D-Editor. The final edits were exported as an .xyz file for gridding the bathymetric record using the FledermausTM module (Fig. 5.3). Due to good sea conditions, the data could be gridded with a cell size resolution of 30 m. Backscatter data, providing information about the reflectivity of the seafloor, were visualized using FMGT (QPS Software). Backscatter geotiffs were also created with a resolution of 30 m.
Fig. 5.2 User interface of the QPS software Qimera (left). Coloured area show the newly collected bathymetric record compared to the multi beam data gathered in 2011/2012 during the Jedda-Transect-Project. The figure on the right shows the interface of the 3D-Editor of Qimera with the outliers tool.
Fig. 5.3 The user interface of Fledermaus shows the bathymetric record of the Port Sudan Deep after post processing i.e. the removal of false soundings. The multibeam data was gridded and interpolated in QPS Fledermaus with a cell size of 30 m.
5.1.2 Preliminary results
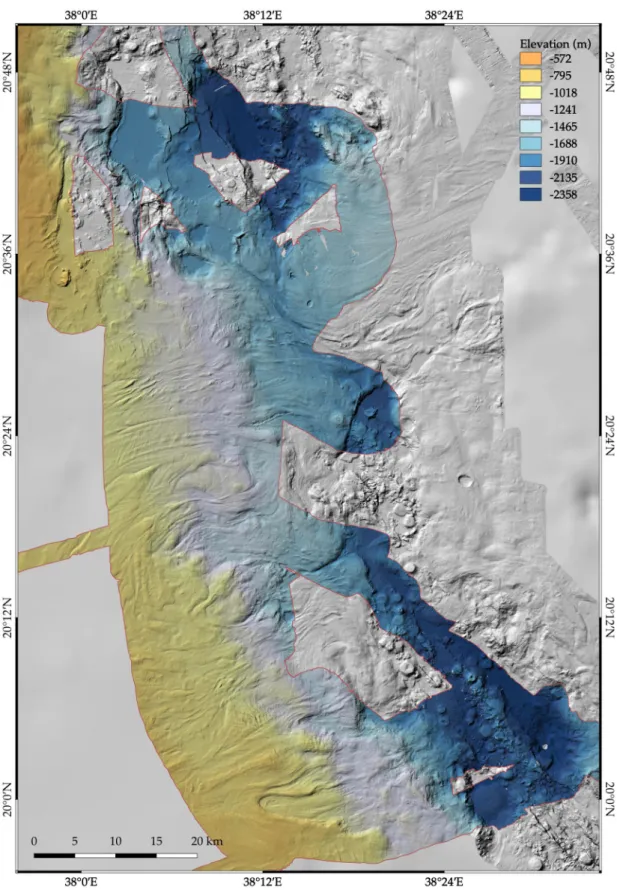
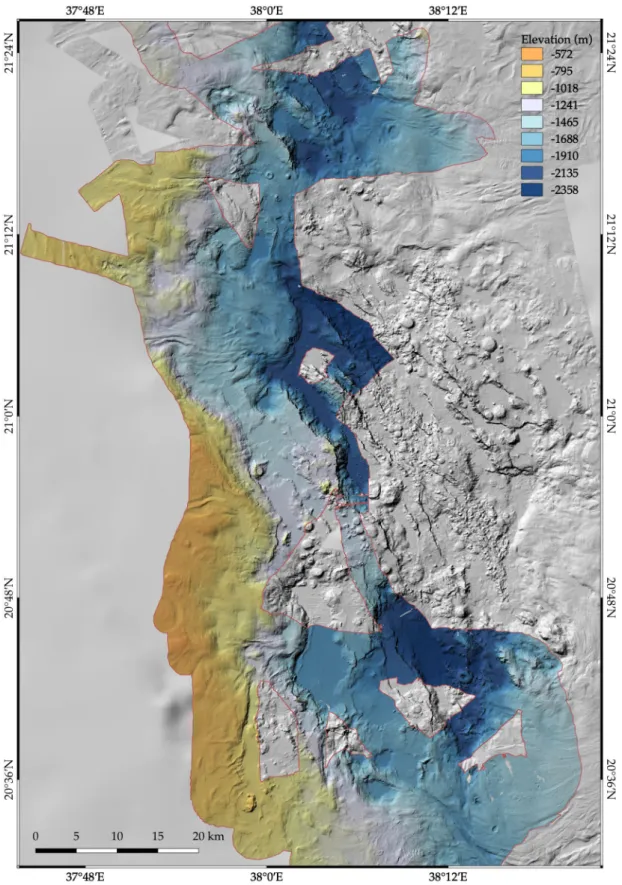
Fig. 5.4 The majority of the newly mapped area was in the southern part of the working area. The map shows the processed bathymetry (30 m grid cell size) of this area, revealing massive salt glacier flows into the Red Sea rift axis. High resolution data shown in grey are from expeditions POS408 and 64PE445 in 2011 and 2012, respectively.
Fig. 5.5 The map shows the processed bathymetry (30 m grid cell size) of the northern parts of the working area, with salt glacier flows and large terraces. High resolution data shown in grey are from expeditions POS408 and 64PE445 in 2011 and 2012, respectively.
The mapping area stretched from approximately 19.892°N to 21.903°N and 37.507°E and 38.594°E and is mainly located westward of the Red Sea rift axis. Water depths ranged from -560 m to -2730 m.
Sedimented salt glacier features have been mapped out covering escarpments, salt flows as well as glacier front lobes flowing downwards towards the rift axis (Figures 5.4 and 5.5). Generally, the sediment-salt flows appear to be much more dynamic than on the eastern side of the rift axis.
Small volcanic features were occasionally found with maximum extensions of 3,000 m, mainly flat-topped volcanoes, but also few that show a caldera in the center. A pockmark chain was detected near Poseidon Deep in a northeast to southwest stretching approximately along a 4,000 m long elongated depression. The pockmarks reveal a circular to oval shape and are situated in water depth ranging from approximately 1,500 to 1,700 m. Based on the geomorphology of the individual features, it cannot be assessed, if this is still an active pockmark field.
5.2 EK500 high-frequency echosounder (N. Mitchell)
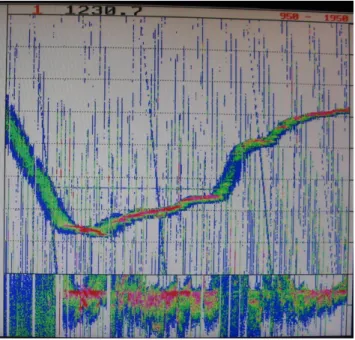
A Kongsberg EK500 hull-mounted 38 kHz sonar was run largely to provide an independent seabed topographic profile. Although this sonar is designed primarily for measuring acoustic backscatter from fish, we recorded some reflections from brine surfaces using it. The data may be useful for recording their depths for comparisons with records from other years. Due to the high frequency, the data are unlikely to be useful for sub-bottom reflections (some very shallow apparent reflections were noted but it was unclear if they were due to out of plane reflections produced by uneven seabed topography rather than genuine sub-bottom reflections). The system records a measure of backscatter strength of the bottom echo though this might be noisy due to detections of noise instead of the true bottom (Fig. 5.6).
The echo data (backscatter versus time) were continuously recorded using “Echolog 500” to files in an “*.ek5” telegram format of Kongsberg. A format statement is available in the Kongsberg EK500 manual. Ping interval was set to 4 seconds. A new sound velocity profile was not entered, but the values left from previous users were as follows: profile type mean, upper depth 3 m, lower depth 60 m, upper velocity 1507 m/s, lower velocity 1520 m/s. It is unclear how the system uses these values to calculate depths (extrapolation or continuation of lower velocity?). Note also that we varied the recording window and digitisation rate a number of times, hence data resolution varies.
Fig. 5.6 Example brine layer in Valdavia Deep (screen photograph; reflection forming horizontal line in the image). Lower profile shows expanded the bottom echoes (recorded from 10 m above bottom to 50 m range). Hydrothermal sediments within the deeps typically produced a prominent echo.
5.3 Geophysics
(J. Preine, N.C. Mitchell, I.Y.A. Nasr) 5.3.1 Seismic Measurements
Introduction
Acquisition system - Multichannel reflection seismic data was acquired during 64PE-445-SaltAx- cruise using a Delta spark array and a 24 Channel Microeel-streamer. The aim of the seismic measurements was to examine the sub-sedimentary structures, the depth of the evaporates and salt internal structures.
The Sparker system is comprised of a power supply (capacitor charging unit) capable of discharging 6 kJ, a metallic frame with 6 electrodes that is towed behind the ship and a deck-cable for power supply. When the sparker is immersed in water, the electrical energy is switched into the sparker. Between the two neighbouring sparker tips and the frame a plasma bubble develops which produces a high intensity sound pulse. The sound pulse is reflected off the different layers of sediment/seabed and received by the hydrophones which are streamed in the water some distance from the sparker. The hydrophones used for this expedition were organized in a 100 m long polyurethane tube with a distance of 4 meters.
The streamer was powered using a self-build battery pack that ensured an operation of at least 3 days. The signals from the hydrophones were digitized using a Geometrics Geode. The digitized data was then processed using the seismic controller software by geometrics, which was run on a Panasonic Toughbook. In addition to that, another workstation was set up in the hydroacoustic-lab to process the acquired data using the VISTA software provided by Schlumberger.
Acquisition onboard RV Pelagia
Acquisition of seismic data was carried out together with multibeam. Both systems did not show any sign of interference. The sparker was deployed on the starboard side using a crane and was towed in a distance of 5 m from the ship. The streamer was deployed by hand on portside. The offset of the first channel towards the ship was 44.5 m. All seismic data was referenced to the ships antenna which was positioned over the bridge. Figure 5.7. illustrates the geometry of the seismic acquisition onboard RV Pelagia.
The streamer was deployed as far away from the ship as possible to avoid interference with the ship's noise. In contrast, the sparker was kept closer to the ship to achieve a larger offset between the source and the first channel. It was connected to the capacitor charging unit (CSP-S) with a 50 m long deck-cable. Because the temperatures on deck reached over 40 degrees, the CSP-S was not placed in the container. Instead, the ship’s dry lab was used as a storage room. Here, the air- condition ensured the stable operation of the CSP-S without overheating.
Because the CSP-S contained lethal voltages, it was earthed to the ship. In addition, the whole crew was informed about the risks and the room was kept closed. In agreement with the bridge, the power cable for the sparker was only connected to the CSP-S once the sparker was immersed in water. This procedure was always communicated and double-checked with the crew.
Fig. 5.7 Seismic acquisition geometry.
There is concern in recent times that marine mammals may be harmed or their behavior changed by seismic activity. The sound pulses from sparkers are much lower in amplitude and higher in frequency than air guns, which are typically used for seismic surveys. However, a visual marine mammal observation 30 minutes before starting the discharge was initialized was performed. In addition, the sparker was soft-started so that the energy was increased slowly over approximately 15-30 minutes. After the end of each line the sparker was turned off and the high-voltage cable was disconnected. When the sparker was on deck, the electrode-tips were trimmed in order to keep them within the isolating plastic.
The data were collected with a sampling interval of 0.250 ms ensuring that frequencies up to 2000 Hz were recoverable without temporal aliasing. The trigger impulse for the sparker was induced every 10 seconds. A smaller interval was not possible, because the capacitors of the CSP- S took approximately 9 seconds to charge. During acquisition the ship speed was mostly 3 knots through the water. Only during the investigation of a possible crater (Station 64PE-445-09-SPS) we decreased the ship speed to 2 kn in order to improve the data quality. Therefore, the shot interval was approx. mostly 15 m and 10 m during the slow acquisition. Because the distance between the channels was very low (4 m) the distance between each CMP was also very small (2 m). This of course decreased the signal-to-noise ratio, but also increased lateral resolution. This of course can be changed during the processing and binning of the data. Figure 5.8. shows a screenshot of the acquisition software during operation. The software allowed to study common shot gathers of different channels in real time, which was very important, because it was always possible to see if certain parts of the streamer were to close or too deep in the water. In addition to that, a shot-gather was shown for each shot focusing on the direct wave. Here, the watch-keepers were able to detect variations in the source intensity.
Fig. 5.8 Screenshot of the acquisition software during operation.
Because the maximum depth during acquisition never extended significantly more than 2000 m, the recording time was set to 4 seconds without a delay. Only during acquisition of profile 64PE- 445-29-SPS the recording delay was set to 500 ms, because depths up to approx. 2900 m/ 3.8 s TWT were expected. The first profile was recorded in SEG-Y format, but a crash of the acquisition software occurred and the file was corrupted afterwards. Therefore we changed the recording format to SEG-D. The SEG-D format has the advantage of storing each shot-file separately ensuring that one corrupted file would not mess up the whole acquisition. Another advantage of the SEG-D format was that the files could be copied to hard-drives in dense intervals while the acquisition was still running so that the data were saved on a back-up disk and were while the line was still being acquired. This ensured that a quality control and a first geological interpretation were possible shortly after each profile was finished. Table 5.1 shows an overview of all the collected seismic lines.
Results
Tests of the towing depths - The goal of the first station 64PE-445-03-SPS was to adjust the streamer and sparker depth. In general, the lower the depth of both the less the acquisition is influenced by noise caused by the wave motion. On the other hand, the interference of both source and receiver ghost reflections is stronger, the deeper the towing depth. Therefore, it is necessary to find a compromise for the towing depth.
The depth of the sparker was adjustable by changing the length between the steel-frame and the buoys. The deepest possible towing depth was 1 m. Based on the weather forecast, we expected the condition of the sea to change during the seismic acquisition. Although the weather was forecasted fine for the first days, we decided to keep the streamer in the deepest position. Changes in between the acquisition are strongly undesired because it will mean that the processing of the
data has to be changed later on as well. Especially for techniques as for example deconvolution, which need a lot of testing, a change in the sparker depth and therefore in the source signature would mean a strong increase in processing time.
Fig. 5.9 The sparker in operation (left) and the MicroEel streamer on deck (right). The black and yellow tapes indicate the positions of the lead weights.
Setting the streamer depth was not so straight forward. The MicroEel is a streamer that is designed for shallow water depth. Its buoyancy keeps it several centimetres from the water surface, but with wave motion the streamer can easily reach the surface, which means a significant decrease in signal quality. In order to avoid this, we attached lead plates in regular distances around the streamer. We made sure that they were placed right in the middle between the neighboring hydrophones. In addition to the lead plates we also used fishing lead that was taped on the streamer.
Figure 5.9. shows the streamer on deck and the position of the lead weights.
Table 5.1 Overview of the seismic lines collected during expedition 64PE-445. Note that line #03SPS was a very short test line and station #05SPS had some software issues that lead to an inaccessibility of most of the profile data (for details see text).
Station-
Number Length
[km/nM] # Shots # Profiles Speed
[kn] Recording
delay [ms] Weather condition 64PE-445-
03-SPS 2.4 / 1.3 328 1 3 0 fine
64PE-445- 05-SPS
13.8 / 7.45 805+? 2 3 0 fine
64PE-445-
07-SPS 188.3 / 101.6 11220 9 3 0 fine
64PE-445- 09-SPS
13.0 / 7.0 1.538 4 2 0 fine
64PE-445-
18-SPS 178.4 / 96.3 11.901 12 3 0 ruff
64PE-445- 25 SPS
74.2 / 40.1 4643 2 3 0 fine
64PE-445-
27-SPS 158.0 / 85.3 9575 6 3 500 intermediate
64PE-445- 29-SPS
221.5 / 119.6 11.802 11 3 0 intermediate
Total 849.6 / 458.7 51.007 47 / / /
The first test at station 64PE-445-03-SPS was performed with the lead attached at the front of the streamer as well as the middle and the end. Figure 5.10. and 5.11. show the autocorrelation function of two shot gathers that were recorded during this first test. The autocorrelation function
is very useful to detect multiple reflections. The source and receiver ghost are phase reversed signals that are created when the acoustic signals are reflected back from the water surface. When the signal is first reflected at the sea surface and then at the subsurface, it is called a source ghost.
The opposite case is called receiver ghost.
Fig. 5.10 Autocorrelation function of a shot gather with little weight applied to the streamer.
Fig. 5.11 Autocorrelation function of a shot gather after setting the streamer to the desired depth.
The autocorrelation function in figure 5.10. shows that the receiver ghost and the source ghost have a different arrival time at the first channels but interfere at the distant channels. Because the source depth is stationary, we can interfere that the streamer depth is deeper at the front and gets shallower towards the end. The optimum position of the streamer is as straight as possible and slightly lower than the source. Therefore, we increased the weight on the streamer and placed lead between every channel. The result is shown in figure 5.11. Here, the source ghost and the receiver ghost have a different arrival time which stays approximately constant for all channels. There might be slight offsets between channels, but they are negligible especially when swell is present.
Another observation in the autocorrelation function is the presence of a strong secondary pulse approximately 15 seconds after the primary pulse. This pulse is well known in sparker surveys.
When the CSP-S is set to full power, a secondary so-called bubble signal is generated. The