Changing epidemiology of COVID-19
Veränderte Epidemiologie von COVID-19
Abstract
Background:We analyzed the epidemiology of COVID-19 in Regensburg after the first wave ended in June 2020 and compared it with patients’
characteristics and symptoms in late summer/early autumn 2020.
Benedikt M.J. Lampl
1,2Bernd Salzberger
3Methods:Retrospective analysis of epidemiological data from Regens-
burg (city/county) on age and initial symptoms as reported during case 1 Public Health Department Regensburg, Germany investigation for containment. Observed periods: March 7, 2020 to June
6, 2020 and August 12, 2020 to October 9, 2020. 2 University of Regensburg, Germany
Results:The proportion of asymptomatic persons who tested positive for SARS-COV-2 in the second period was 55% (286 of 520 cases),
3 Department of Infection Control and Infectious whereas during the first wave from March to June 2020 this percentage
was 14.4% (169 of 1,170 cases). A comparison of typical symptoms Disease, University of Regensburg, Germany shows that the most common symptoms of COVID-19 in the first wave
(cough, fever and generally feeling ill) were less often reported in the second period: cough 14% vs. 42%, fever 17% vs. 38%, general signs of illness 14% vs. 22% in the second vs. first period, respectively overall cases were younger in the second period, the median age of asympto- matic cases was comparable in both periods. The case fatality rate for the first period was 2.1%, in the second it was 0.2%.
Discussion:The epidemiological situation in the second period is differ- ent from that during the first wave. We observed a considerable propor- tion of questionable cases in August/September 2020 (asymptomatic cases, high ct values, often only detection of one gene). False positive cases/non-contagious cases have to be taken into account for this period. On-demand or free-of-charge testing for asymptomatic persons will lower the positive predictive value of tests and place a high burden on finite capacities.
Keywords:COVID-19, epidemiology, PCR, asymptomatic cases, testing strategies
Zusammenfassung
Hintergrund:Es wurden Patientencharakteristika und Symptome von COVID-19 in Regensburg in der ersten Welle und nach dem Ende der ersten Welle verglichen.
Methoden:Retrospektive Analyse epidemiologischer Daten aus Regens- burg (Stadt/Landkreis) zu Alter und Symptomen bei Erstmeldung des Falls; beobachtete Zeiträume 07.03.2020 bis 06.06.2020 und 12.08.2020 bis 09.10.2020.
Ergebnisse:Der Anteil asymptomatischer Personen, von denen nicht mindestens ein Symptom einer akuten Infektion angegeben wurde, die jedoch positiv auf SARS-COV-2 getestet wurden, betrug im zweiten Zeitraum 55% (286 von 520 Fällen), während dieser Prozentsatz wäh- rend der ersten Welle von März bis Juni 2020 bei 14,4% lag (169 von 1.170 Fällen). Ein Vergleich typischer Symptome zeigt, dass die häufigs- ten Symptome von COVID-19 in der ersten Phase (Husten, Fieber und allgemeines Krankheitsgefühl) in der zweiten Periode auffällig seltener berichtet wurden: Husten 14% vs. 42%, Fieber 17% vs. 38 %, allgemeine Anzeichen einer Krankheit 14% gegenüber 22%. Insgesamt waren die Betroffenen in der zweiten Periode jünger, das Durchschnittsalter der asymptomatischen Fälle war in beiden Perioden vergleichbar. Die
Sterblichkeitsrate (case fatality rate, CFR) für den ersten Zeitraum betrug 2,1%, für den zweiten 0,2%.
Diskussion:Die epidemiologische Situation im zweiten Beobachtungs- zeitraum ist nicht mit der ersten Welle vergleichbar. Im August/Septem- ber 2020 konnte ein erheblicher Anteil fraglicher Konstellationen beob- achtet werden (asymptomatische Fälle, hohe ct-Werte, oft nur Nachweis eines Gens). Falsch positive Fälle/nicht ansteckende Fälle müssen für diesen Zeitraum angenommen werden. Anlasslose Tests bei asympto- matischen Personen senken den positiven Vorhersagewert und belasten die vorhandenen Kapazitäten.
Schlüsselwörter:COVID-19, Epidemiologie, PCR, Asymptomatische Fälle, Teststrategien
Background
COVID-19 has rapidly spread all over the world [1]. During a first high incidence period (“first wave”) from March to May 2020 it affected many countries severely [2]. As symptoms are non-specific and typical for respiratory in- fections and the clinical spectrum of COVID-19 ranges from asymptomatic to severe or even fatal, disease con- tainment is necessary, albeit difficult [3]. Thus, strategies to control its spread had to be established.
In Bavaria, a liberal strategy of PCR testing was imple- mented at the end of the summer holidays; tests were offered free of charge even to asymptomatic citizens, and testing of travelers from risk areas was obligatory [4], [5].
During the first wave, a high number of undiagnosed cases (under-reporting) probably existed, in addition to a comparably high number of confirmed severe and fatal cases. The number of these undetected cases was calcu- lated with different mathematical models for different countries [6]. In contrast, in the second (current) wave, a lower proportion of severe cases has been observed so far. Furthermore, it was conspicuous that the Public Health Department had to deal with very heterogenous laboratory results: a considerable number of samples showed only one positive gene (usually the two-step test detects two genes: e-gene, n-gene or RdRP-gene [7]) and threshold cycle (ct) values above 35, representing a low viral load, if any.
In order to correlate these findings with clinical severity, we analyzed cases of the first wave from March 7, 2020 to June 6, 2020 (first wave) and cases from August 12, 2020 (when numbers of cases began to increase after a low prevalence in June/July) to October 9, 2020 in Re- gensburg (city/county) in terms of asymptomatic cases and distribution of symptoms in symptomatic cases.
Methods
Epidemiological data from Regensburg (city/county) on initial symptoms as reported during case investigation for laboratory confirmed (SARS-CoV-2 PCR: positive) cases
to the National Center of Infectious Disease Control (Robert Koch-Institut, RKI). Case definitions were applied according to the RKI [8]. An epidemic curve depicts all reported cases from March 7, 2020 (first reported case in Regensburg). Our database (Äsculab21, accessed Oc- tober 10, 2020) was searched for cases and one of the following symptoms/conditions at the time of case investigation: cough, fever, general signs of illness, sore throat, rhinitis, dyspnoea, diarrhoea, taste disorder, hypo- geusia, pneumonia, tachycardia, tachypnoea, ARDS, pneumonia requiring ventilation.
Statistical analysis: Microsoft Excel 2016 and a web- based calculator for the Wilcoxon rank-sum test were used [9].
Results
In the first period, a total of 1,170 cases were reported (epidemic curve, Figure 1) with a mean incidence of 4.1/100,000/day. As of mid-August, an increase in case numbers was obvious after a phase of low numbers in June and July; this increase was associated with the end of the summer holidays and the implementation of the Bavarian testing strategy (wide availability of testing and obligatory testing for travelers from risk areas). From 12/08/2020 until 09/10/2020, 520 cases were report- ed, with a mean incidence of 2.6/100,000.
The proportion of asymptomatic persons not reporting at least one symptom (Figure 2) who tested positive for SARS-COV-2 in the second period was 55% (286 of 520 cases), whereas during the first wave from March to June 2020, this percentage was 14.4% (169 of 1,170 cases).
The median age of all cases in the first period was 41 years (0–119), and in autumn it was 28 years (0–90;
p<0.001; Figure 3). Comparing the median age of asymptomatic cases, there is no statistically significant difference: median age 27 years (0–119) in spring versus 30 years (0–90) in autumn (p=0.26270).
Figure 1: Epidemic curve, mean incidences calculated for the periods: March 7, 2020 to June 6, 2020 and August 12, 2020 to October 9, 2020
Figure 2: Percentage of initially asymptomatic cases in comparison
Figure 3: Age range of all cases and asymptomatic cases in the two periods
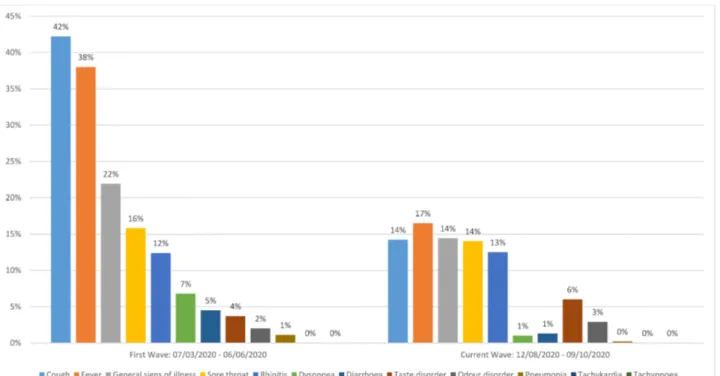
Figure 4: Proportion of reported symptoms during case investigation
A comparison of symptoms (Figure 4) shows that the most common symptoms of COVID-19 in the first phase (cough, fever and general feeling ill) were less often reported in the second wave: cough 14% vs. 42%, fever 17% vs. 38%, general feeling of illness 14% vs. 22%. Pneumonia was reported in only one case out of 520 in the second period, whereas in spring, 13 cases initially exhibited pneumonia (1%). The case fatality rate was 0.2% for the second period compared to 2.1% in spring.
Discussion
Our analysis of the two periods demonstrates a change in epidemiological characteristics. The proportion of asymptomatic cases in the second period is large, not only in comparison to the first wave in Regensburg, but also in comparison to other studies [10], [11]. The rate of overall positive PCR results has decreased from around 10% during the first wave to below 1% for the second period in Germany, during which the total number of performed tests has multiplied [12]. In our collective, the median age of all cases is lower in the second period, but the age of asymptomatic cases is not different. It can be concluded that more people of younger age have be- come infected. Moreover, it can be assumed that a higher percentage of real infections is detected compared to the first wave (less under-reporting). A different age distribution among the infected together with a lower number of unknown infections might be the cause of the lower CFR during the second period to date.
On the other hand, fever and cough were the leading
toms are reported in such a low proportion in the second period.
One possible explanation is that the high number of asymptomatic cases reflects a relevant proportion of uninfected or non-contagious persons, respectively. Ac- cordingly, from August onwards, possible false-positive test results (with high ct values above 35 or only one amplified gene) in asymptomatic tested persons have been recognized more often. This problem might be par- tially due to testing in a population with a low pre-test probability, high test volumes, and heterogeneous labo- ratory standards. Thus, the public health authorities are confronted with varying result quality, complicating effec- tive containment. Without clinical information on symp- toms, it is more difficult to evaluate the relevance of borderline PCR findings.
Our analysis is limited by the preliminary nature of data, the retrospective design, and a record of symptoms repor- ted by the cases themselves (interview/recall bias).
In conclusion, the epidemiology in the second period is different from the first wave. We observed a high propor- tion of asymptomatic cases with a considerable proportion of high ct values in PCR tests. It is difficult to decide whether these results represent infections in the later period that were previously missed or false positive re- sults, and sheds doubt on strategies of high-volume testing in populations with low pre-test probability. Testing should be prioritized for indications with adequate pre- test probability, such as symptomatic cases, close contact persons and outbreak examinations. Pool-testing and targeted testing strategies should be evaluated. Testing strategies with on-demand or free-of-charge tests of
Notes
Competing interests
The authors declare that they have no competing in- terests.
References
1. Johns Hopkins University; Center for Systems Science and Engineering. COVID-19 Dashboard by the Center for Systems Science and Engineering (CSSE) at Johns Hopkins University (JHU). [last accessed 2020 Oct 10]. Available from:
https://gisanddata.maps.arcgis.com/apps/opsdashboard/
index.html#/bda7594740fd40299423467b48e9ecf6 2. WHO. Coronavirus disease (COVID-19) Situation Report – 125
Data as received by WHO from national authorities by 10:00 CEST, 24 May 2020. Geneva: WHO; 2020. Available from: https:/
/www.who.int/docs/default-source/coronaviruse/situation- reports/20200524-covid-19-sitrep-125.pdf?sfvrsn=80e7d7f0_
2
3. Baj J, Karakuła-Juchnowicz H, Teresiński G, Buszewicz G, Ciesielka M, Sitarz E, Forma A, Karakuła K, Flieger W, Portincasa P, Maciejewski R. COVID-19: Specific and Non-Specific Clinical Manifestations and Symptoms: The Current State of Knowledge.
J Clin Med. 2020 Jun 5;9(6):1753. DOI: 10.3390/jcm9061753 4. Staatsministerium für Gesundheit und Pflege: Bayerische
Teststrategie. [last accessed 2020 Oct 09]. Available from:
https://www.stmgp.bayern.de/coronavirus/bayerische- teststrategie
5. RKI. Informationen zur Ausweisung internationaler Risikogebiete durch das Auswärtige Amt, BMG und BMI. Stand 07/10/2020.
2020 [last accessed 2020 Oct 11]. Available from: https://
www.rki.de/DE/Content/InfAZ/N/Neuartiges_Coronavirus/
Risikogebiete_neu.html Stand 07/10/2020
6. Salzberger B, Buder F, Lampl B, Ehrenstein B, Hitzenbichler F, Holzmann T, Schmidt B, Hanses F. Epidemiology of SARS-CoV-2.
Infection. 2020 Oct 8;1-7. DOI: 10.1007/s15010-020-01531- 3
7. Corman VM, Landt O, Kaiser M, Molenkamp R, Meijer A, Chu DK, Bleicker T, Brünink S, Schneider J, Schmidt ML, Mulders DG, Haagmans BL, van der Veer B, van den Brink S, Wijsman L, Goderski G, Romette JL, Ellis J, Zambon M, Peiris M, Goossens H, Reusken C, Koopmans MP, Drosten C. Detection of 2019 novel coronavirus (2019-nCoV) by real-time RT-PCR. Euro Surveill.
2020 Jan;25(3):2000045. DOI: 10.2807/1560- 7917.ES.2020.25.3.2000045
8. RKI. Falldefinition Coronavirus-Krankheit-2019 (COVID-19) (SARS- CoV-2). [last accessed 2020 Oct 10]. Available from: https://
www.rki.de/DE/Content/InfAZ/N/Neuartiges_Coronavirus/
Falldefinition.pdf?__blob=publicationFile
9. Mann-Whitney U Test Calculator. In: Statology. 2018 Dec 21 [last accessed 2020 Oct 14]. Available from: https://
www.statology.org/mann-whitney-u-test-calculator
10. Buitrago-Garcia DC, Egli-Gany D, Counotte MJ, Hossmann S, Imeri H, Ipekci AM, Salanti G, Low N. Asymptomatic SARS-CoV-2 infections: a living systematic review and meta-analysis [Preprint].
medRxiv. 2020 Apr 25. DOI: 10.1101/2020.04.25.20079103 11. Oran DP, Topol EJ. Prevalence of Asymptomatic SARS-CoV-2
Infection: A Narrative Review. Ann Intern Med. 2020 Sep;173(5):362-367. DOI: 10.7326/M20-3012
12. Seifried J, Böttcher S, Albrecht S, Stern D, Willrich N, Zacher B, Mielke M, Rexroth U, Hamouda O. Erfassung der SARS-CoV-2- Testzahlen in Deutschland (Stand 16.9.2020). Epid Bull.
2020;38:15-8. DOI: 10.25646/7137
Corresponding author:
Dr. Benedikt M.J. Lampl
Gesundheitsamt Regensburg, Division of Infection Control, Altmühlstr. 3, 93059 Regensburg, Germany, Phone: +49 941 4009 523
benedikt.lampl@lra-regensburg.de
Please cite as
Lampl BMJ, Salzberger B. Changing epidemiology of COVID-19 . GMS Hyg Infect Control. 2020;15:Doc27.
DOI: 10.3205/dgkh000362, URN: urn:nbn:de:0183-dgkh0003628
This article is freely available from
https://www.egms.de/en/journals/dgkh/2020-15/dgkh000362.shtml Published:2020-11-06
Copyright
©2020 Lampl et al. This is an Open Access article distributed under the terms of the Creative Commons Attribution 4.0 License. See license information at http://creativecommons.org/licenses/by/4.0/.