1
Connecting Countries by Electric Roads
Methodology for Feasibility Analysis of a Transnational ERS Corridor
Authors
Julius Jöhrens, Hinrich Helms, Udo Lambrecht & Felix Spathelf | ifeu – Institute for Energy and Environmental Research Heidelberg Moritz Mottschall & Florian Hacker | Oeko-Institut
Darijan Jelica, Hampus Alfredsson & Martin G. H. Gustavsson | RISE Research Institutes of Sweden
Gregor Nebauer & Markus Schubert | Intraplan Consult GmbH Philip Almestrand Linné & Lina Nordin |
Swedish National Road and Transport Research Institute (VTI) Maria Taljegård | Chalmers University of Technology
10 March 2021
Swedish-German research collaboration
on Electric Road Systems
2
The research collaboration “CollERS” consists of the core members from the Swedish Research and Innovation Platform for Electric Roads and the two national German research projects Roadmap OH-Lkw and StratON:
• German research partners - Oeko-Institut e.V.
- ifeu – Institut für Energie- und Umweltforschung Heidelberg - Fraunhofer IEE – Fraunhofer Institute for Energy Economics and
Energy System Technology
- Heilbronn University of Applied Sciences - Intraplan Consult GmbH
• Swedish research partners
- RISE Research Institutes of Sweden - Chalmers University of Technology - KTH Royal Institute of Technology
- Swedish National Road and Transport Research Institute (VTI) - Trafikverket – Swedish Transport Administration
• Funding agencies
- German Federal Ministry for the Environment, Nature Conservation and Nuclear Safety (BMU)
- Trafikverket – Swedish Transport Administration
Additional information and resources can be found on the web:
www.electricroads.org
The pictures on the front page are courtesy of Region Gävleborg, eRoadArlanda, and Electreon, respectively.
Editor: Martin G. H. Gustavsson, RISE Research Institutes of Sweden
3
Content
Content ... 3
Executive Summary ... 4
List of Abbreviations ... 6
1 Scope ... 7
2 Feasibility criteria for a case study ... 8
3 Summary of assessment ... 11
4 Conclusions and recommendations ... 15
5 References ... 18
6 Annex ... 21
4
Executive Summary
The present study aims at discussing relevant aspects for a potential roll-out of Electric Road Systems (ERS) on transnational corridors, as well as generally for ERS introduction in Europe.
Feasibility criteria have thus been developed in order to assess the following topics for specific potential ERS corridor projects:
• Technical aspects: Which technical prerequisites exist for ERS corridors and to which extent can they expected to be met?
• Environmental aspects: Which effects can be expected on key environmental indicators?
• Economic aspects: Can an ERS corridor pose a business case? Could it contribute to the improvement of ERS economy in general?
• Political aspects: Would an ERS corridor implementation make sense from a political point of view?
The developed criteria may serve as a toolbox for scrutinizing future transnational ERS corridor projects. In order to illustrate their application, we used them to analyse a potential roll-out of an Electric Road System on a selected highway corridor (424 km) connecting Sweden and Germany, but mainly located on Danish territory. Based on traffic flows and patterns along the corridor route, it was found:
• A considerable part of the total truck mileage on the corridor is done by vehicles with a rather limited driving distance for pre- and post-haul, assuming the corridor is realized as a stand-alone project, and
• the CO2 emissions (well-to-wheel) of truck traffic along the corridor route can be significantly reduced if electric trucks are powered by the national electricity mixes expected for the year 2030, and even more if it would be powered purely renewable.
Although a continuous ERS on the complete corridor route would not be
economically feasible under current conditions, the analysis pinpoints sections along the route where the traffic volumes with a sufficient share of operation on a
potential ERS are significantly higher. These sections are located in the metropolitan areas of Malmö, Copenhagen and Hamburg. For implementation, peculiarities of the local markets and regulation should be considered, as well as country-specific priorities on decarbonizing road freight transport. Additionally, the identified ERS potential for medium distances will depend on the technical and cost development of battery trucks.
5
Our analysis also sheds some light on the role of first transnational corridors within a European roll-out strategy for ERS. Such corridor projects could help to
• proof the principal strengths of ERS,
• trigger strategic coordination between the participating countries,
• foster national ERS roll-out due to synergy effects with the corridor and
• pave the way for integration of ERS into EU legislation (e.g. AFID, TEN-T planning)
6
List of Abbreviations
ADT Average daily traffic
DE Germany
DK Denmark
ERS Electric Road System
ERS-BEV Battery Vehicle able to connect to ERS ERS-HEV Hybrid Vehicle able to connect to ERS
FI Finland
GHG Greenhouse Gases
HGV Heavy Goods Vehicle
ICEV Internal Combustion Engine Vehicle
NO Norway
OD Origin-Destination
SE Sweden
SGEC Swedish-German ERS corridor TCO Total Cost of Ownership VAT Value Added Tax
7
1 Scope
In recent years, the urgent need for action in climate policy has become increasingly apparent. The focus has shifted in particular to freight transport, whose greenhouse gas (GHG) emissions continue to rise due to rising transport volumes; from 1990 until 2018, transport-related GHG emissions in EU-281 have increased by 20 % from 794 million tonnes to 950 million tonnes CO2 equivalents per year [1]. Electric Road Systems (ERS) are therefore attracting growing attention as a climate protection technology, especially for long-haul heavy freight transport which faces severe hurdles for electrification via battery vehicles.
In Sweden and Germany, there have been various research and development activities relating to ERS in recent years. Since 2017, there is a declaration of intent between the two countries regarding joint ERS research and innovation [2].
Previous research has mainly focused on a better understanding of the individual aspects of ERS (technical system, standardisation, cost estimates, etc.). Now the first field trials are in operation and at least in Sweden a roadmap for implementation has been developed [3]. At the same time, the importance of a transnational approach to ERS is often stressed, as many transports are international and generally, there is a strong integration in the European market.
This study has developed feasibility criteria mainly based on transport flows and vehicle usage patterns along an international freight corridor, and thereby getting an understanding for the potential of electrification of heavy-duty road freight.
Technical, economic, environmental, but also political-strategic aspects will play a role in an assessment of the usefulness of establishing an ERS transport corridor.
The aim is to highlight the challenges of a transnational ERS and to discuss implementation strategies by the involvement of relevant stakeholders of the countries that are concerned.
In order to illustrate the developed criteria, we apply certain aspects to a Swedish- German corridor route. However, this study is not meant as a comprehensive feasibility analysis, but rather as a methodological contribution to research on a possible international ERS roll-out.
This report first explains the developed feasibility criteria (Section 2). Subsequently, the results of their exemplary application to corridor route between Scandinavia and Germany are summarized (Section 3). Based on these results, we finally draw some conclusions and give recommendations for future assessment of transnational ERS projects (Section 4). This also includes the question of what role such a corridor could play in the introduction of ERS in Europe. For details of the exemplary corridor assessment, the reader may refer to an extensive annex.
Readers in need of a state-of-the-art description of ERS, should refer to the CollERS report “Overview of ERS concepts and complementary technologies” [4]
1 The 27 present EU Member States and the United Kingdom.
8
2 Feasibility criteria for a case study
The present study aims at discussing all aspects that could be relevant for analysing the feasibility of a transnational ERS corridor, as well as for a study of ERS
introduction in Europe. Relevant aspects can be classified into four groups:
• Technical aspects: Which technical prerequisites exist for the ERS corridor and to which extent can they expected to be met?
• Environmental aspects: Which effects can be expected on key environmental indicators?
• Economic aspects: Can an ERS corridor pose a business case? Could it contribute to the improvement of ERS economy in general?
• Political aspects: Would an ERS corridor implementation make sense from a political point of view?
In the following scheme, we explain the individual parameters in each category which are the basis for the assessment.
# Parameter What goes into it? Why is it important?
1 Technical
1.1 Electric mileage Traffic flow analysis, technically possible electric pre- and post- haul distances for the chosen ERS vehicles
An ERS only makes sense if it enables vehicles to operate on electricity, thus saving fossil fuel. This parameter is also an input for other criteria such as GHG emission reduction and improvement of air quality.
1.2 Availability of electricity supply
Electricity demand and production in the affected regions, capacity of distribution grid, renewable energy targets
In order to reach massive GHG emission reductions, a high share of renewables in the electricity mix for ERS is crucial. Moreover, expansion of electricity grids for ERS can yield high costs.
1.3 Interoperability Definitions of common interfaces, maturity and availability of standards
Differing technical (and possibly administrative) standards between the participating countries can significantly increase necessary efforts for a cross- border ERS.
9
# Parameter What goes into it? Why is it important?
2 Environmental 2.1 Reduction of climate
gas emissions
Suitable traffic volumes, energy consumption, emission factors
The need for decarbonisation of road freight traffic constitutes the primary political driver for the introduction of ERS.
2.2 Improvement of air quality
Suitable traffic volumes, emission classes of affected traffic, air quality figures along the corridor
NOx limit values are currently exceeded in many densely populated areas in the EU. If ERS can alleviate this situation, this could be a major driver for system introduction.
2.3 Reduction of noise emissions
Acoustic measurements from other projects, expected vehicle speed, population density along the corridor
Noise from road traffic has several negative effects (i.e. health issues, depreciation of real estate),
especially in urban areas. Introduction of electric drive systems can in principle reduce noise emissions.
3 Economic
3.1 TCO advantage of operators
Vehicle prices and expected development, share of operation on ERS corridor, energy prices
An ERS corridor will only be widely used if operation of ERS vehicles leads to a cost reduction for haulage- companies or at least does not imply a financial disadvantage.
3.2 Expected investment and infrastructure operating costs (compared to other public investments in the same or
neighbouring sectors)
Cost estimations from ongoing studies and field tests, extrapolation due to scale-up
Building an ERS corridor will require significant investments for which the payback time is difficult to foresee. Most stakeholders seek to reach climate goals with minimum input of financial resources. Low GHG abatement costs thus increase the likelihood of ERS realization.
3.3 Contribution to creating a substantial vehicle market
Tipping points of vehicle numbers as
communicated by manufacturers
Economies of scale can help to drive down the price for ERS technology, which can in turn increase its market penetration. Thus, growing the ERS vehicle market may be an argument for an ERS corridor implementation in an early market phase.
3.4 Committing logistical and industrial
stakeholders (carriers, shippers, vehicle manufacturers)
Stakeholder interviews Successful ERS introduction needs a simultaneous commitment of different stakeholder groups. If an ERS corridor can foster such commitment, that could be an argument for its realization.
10
# Parameter What goes into it? Why is it important?
4 Political 4.1 Contribution to
(technical and
political) cross-border strategy for large scale implementation
Stakeholder interviews
Implementation of a transnational ERS corridor in an early phase of ERS introduction is not likely to take place solely driven by market mechanisms. It requires significant political effort. Consequently, there need to be considerable advantages of such a project also on a political level. These are investigated here.
4.2 Bridging the gap between
demonstration and infrastructure scale- up
Stakeholder interviews
4.3 Ensuring credibility of decarbonization efforts
Stakeholder interviews
4.4 Lighthouse effect for ERS: raise stakeholder awareness, increase confidence in the ERS- technology and its feasibility
Stakeholder interviews
11
3 Summary of assessment
The criteria presented in the previous section may serve as a toolbox for scrutinizing future transnational ERS corridor projects. In order to illustrate their application, we used them to analyse a potential roll-out of an Electric Road System on a selected highway corridor (424 km) connecting Sweden and Germany, but mainly located on Danish territory. The following scheme summarizes key results from each assessment criterion that was applied in the analysis.
# Parameter Main findings Conclusions for feasibility
1 Technical
1.1 Electric mileage • 45 % of total HGV mileage on the corridor have a pre- and post-haul less than 250 km.
• The above HGV have routes with 22 % mileage on the corridor
+ considerable share of routes on the corridor, and part of these could be suitable for ERS.
- rather low relative mileage on the corridor
1.2 Availability of electricity supply
• The high voltage grid has already been reinforced due to high RE generation along the corridor route
• Power demand from the corridor could in some cases alleviate peak RE feed-in situations
+ It seems unlikely that the high voltage grid needs to be reinforced considerably for ERS.
Dedicated medium voltage grids need to be installed to connect the ERS to the HV grid
1.3 Interoperability • Multiple dimensions of
interoperability may play a role for the corridor (international, inter- and intra-system)
• Standardization regarding certain ERS components is on the way at European level (CENELEC)
- There are yet no standardized solutions ready for application.
12
# Parameter Main findings Conclusions for feasibility
2 Environmental 2.1 Reduction of climate
gas emissions
• CO2 reduction for total HDV traffic on the corridor is estimated at 33 % if all suitable trips would be done by hybrid ERS vehicles.
• Presence of national ERS networks could increase CO2 savings to about 50 %
+ ERS corridor enables deep CO2
reductions per vehicle due to favourable electricity production in the Scandinavian countries.
2.2 Improvement of air quality
• In Hamburg, Copenhagen and Malmö, there are considerable challenges regarding NOx in the air.
• Only a small fraction of NOx originates from vehicles on the corridor route
- Air quality impact of electric drive on the corridor is expected to be rather low in the affected urban regions.
+ If ERS vehicles would operate purely electric also in pre- and post-haul, positive effects on air quality could be considerably higher.
2.3 Reduction of noise emissions
• Reduction in noise emissions due to electric drive are only relevant for low speeds of up to 30 km/h.
• There are most likely differences in noise emissions between ERS technologies.
- Noise reduction by ERS in free-flowing motorway situations cannot be expected.
+ ERS vehicles can lower noise emissions in congested areas and in urban pre- and post-haul if this is done in electric mode.
13
# Parameter Main findings Conclusions for feasibility
3 Economic
3.1 TCO advantage of operators
• With current ERS vehicle prices, a significant TCO advantage cannot be expected for any of the considered countries.
• If a market for ERS vehicles is established and scale effects can be taken advantage of, a TCO advantage will probably emerge.
• The German HDV road toll is an effective means for supporting market entry of ERS vehicles.
- In the beginning, ERS vehicles are likely to need fiscal support measures.
+ With market scale-up, an economic operation is likely, particularly in Sweden with its comparably low electricity price.
3.2 Expected investment and infrastructure operating cost
• Electrification of the whole ERS corridor will yield annual overall system costs of about 100 M€
• By selecting most suitable sections of the corridor, the cost balance can be significantly improved, yielding CO2 abatements costs of well below 200 €/tonne CO2.
Electrification of the whole corridor is not likely to pay off under the current regulatory framework.
However, electrifying only suitable parts of the corridor can pose a competitive CO2 mitigation option.
3.3 Contribution to creating a substantial vehicle market
• The ERS-suitable traffic flows on the corridor correspond to around 12 000 ERS vehicles
+ OEMs would likely scale their
production processes to mass-market in this case
3.4 Committing logistical stakeholders and industrial
stakeholders
• Decisions of haulage companies depend mostly on economic aspects; ERS vehicles have to pay off
• Intermodal transport often has advantages in terms of operational aspects (repose period for drivers)
Intermodal transport will continue to play a role even with the Fehmarn Belt Fixed Link.
Future autonomous trucks would make a Swedish-German ERS corridor much more attractive
14
# Parameter Main findings Conclusions for feasibility
4 Political
4.1 Contribution to cross- border strategy for large scale
implementation
• A corridor requires trans-national standardization
• Considerable dependencies with national ERS roll-out can be expected
A corridor project could
+ trigger strategic coordination between the participating countries
+ foster national ERS roll-out due to synergy effects
+ raise awareness for ERS at EU level (regulation like AFID, TEN-T planning, …) 4.2 Bridging the gap
between
demonstration and infrastructure scale- up
• Corridor project could be an intermediate step between introduction phase and large-scale implementation
+ There are several potential public funds for a trans-national corridor project.
- Implementation would be significantly easier when national ERS networks are already (partly) present.
4.3 Ensuring credibility of decarbonization efforts
• International coordination is often mentioned as vital for successful ERS roll-out
• A trans-national ERS corridor bears notable political challenges
+ Successful implementation of a trans- national ERS corridor would probably be perceived as a strong political statement regarding importance of ERS technology.
4.4 Lighthouse effect for ERS
• ERS corridor would expose a large number of people to ERS
technology
• Attraction of considerable media attention is likely
+ considerable impact as a showcase project is likely
15
4 Conclusions and recommendations
Electrifying the 424 km long traffic corridor between Hamburg and Helsingborg with ERS technology will require an exceptional effort from a variety of stakeholders and industrial sectors. At the same time there is potential to decarbonize heavy-duty transportation across national borders for the German-Scandinavian region. Traffic data shows that a high number (45 %) of current heavy-duty traffic on the corridor have trips with pre- and post-haul distances of less than 250 km, based on the start and stop destinations of transportation routes in this region. Simultaneously, the data also shows that there are some adjoining routes to the corridor with substantial traffic flows, for example north of Helsingborg, road E47 westward in Denmark, and south of Hamburg that could act as national ERS-networks which would amplify the desired effects and outcomes of ERS implementation in the EU.
In the course of the project, it has been determined that the optimal way to provide the ERS-corridor with electricity should be through a connection to the high voltage level of the electric grid, with a medium voltage wayside grid that runs parallel to the road. Initial assessments indicate that such connections can be made without further investment in the capacity of the high voltage grid, nor additional electricity
generation facilities for the entire extension of the corridor through all three countries.
Assuming this design, preliminary estimates put the total investment cost of ERS infrastructure (including technology-specific- and auxiliary road infrastructure) to about 1 billion €2019 for the entire ERS corridor. Furthermore, additional costs to manufacture trucks capable of connecting to the ERS will play an important role particularly in the first phase of system introduction and will need to be at least partly covered by appropriate public grants. It is estimated that the construction of an ERS corridor in the considered scale is likely to also spur a large-scale production of ERS-trucks, which will bring down vehicle costs and will likely facilitate the general implementation and scaling-up of ERS technology, both within and outside this current case study. Current economic models predict a net-positive economic effect of ERS once a substantial ERS-network is present (about 2000 kilometres). As the corridor is only 424 kilometres long, it should be viewed as a steppingstone toward a long-term international ERS network roll-out that is likely to be more profitable than an isolated corridor. An important factor will also be to coordinate the construction of international ERS deployments with national ERS activities, i.e. sync the
construction of international corridors with the national ERS roadmaps and construction plans for the bordering countries.
Whether the ERS corridor will become a viable economic business or not, will eventually depend on the adoption of the technology within the logistics sector and the future development of competing technologies offering fossil-free operation such as pure battery trucks for long-haul applications or fuel cell trucks. In turn, ERS technology adoption and achievable economic advantages for operators will largely depend on a stringent public climate policy (e.g. in terms of CO2 price) and on a predictable infrastructure roll-out which requires a corresponding commitment on the part of responsible public authorities. In general, hauliers are currently positive about alternative drive technologies and mindful of their carbon footprint. However, this would not be reason enough to electrify their vehicle fleet since the logistics
16
sector is characterized by intense competition. Thus, a crucial aspect in catalysing the logistics sector to adopt ERS technology would be to set up a system where, through ERS, they reach a lower (or at least not higher) total cost for vehicle ownership and operation compared to what the current system, or other fossil-free systems such as battery electric or fuel cell power systems, can offer for a particular application.
The utilization of an ERS corridor will depend on the future development of HDV traffic patterns, particularly the relevancy of intermodal transportation flows. If railway infrastructure can be successfully expanded, leading to a large-scale shift of long-haul road-freight transport to railways, ERS could be a feasible option
particularly for feeder traffic in intermodal transports. This should be considered for infrastructure planning. On the other hand, autonomous driving for trucks could potentially raise attractiveness of long-haul road transports compared to intermodal transports using ferry links which currently act as resting opportunities for truck drivers.
If all the traffic with pre- and post-haul trips of less than 250 km were electrified through ERS using hybrid vehicles that will run on electricity while on the ERS, around a third of all CO2 emitted from heavy transportation on the analysed corridor could be mitigated. The amount of mitigated CO2 on the corridor is dependent on the source of electricity in the country which the corridor passes, making electric drive favourable in this region based on a high current share of renewables in the
electricity mix in the Scandinavian countries, which is also projected to increase in all three countries in coming years.
Even though there are issues with air quality in all three major cities along the corridor (Malmö, Copenhagen and Hamburg), the HDV traffic on the corridor is only contributing to this in a marginal way. Thus, installing an ERS would not automatically imply a substantial improvement of urban air quality along the corridor. However, if the vehicles are designed to also use their electric drive outside the ERS corridor (e.g.
if they are equipped with a larger battery), a considerable positive effect on air quality would be possible.
Although substituting an internal combustion engine with an electric motor comes with an expected lowering of noise generated by the vehicle, this effect is only significant when the vehicle is driving 30 km/h or less. Thus, introducing an ERS would only positively affect noise levels in urban low-speed environments or congested areas, which does not align with the characteristics of the proposed ERS- corridor as it is meant to be built on highways. As for air quality, a significant
decrease in noise emissions might be due to electric drive of ERS vehicles in pre- and post-haul in urban areas.
Realizing an ERS of this magnitude would require transnational political support, standardization efforts and strategic coordination between not only the governing bodies of the countries involved but also a number of stakeholders from key industries (vehicle manufacturing, electrical utility, hauliers etc.). Such efforts have started to take form to a certain degree on an EU level, for example standardisation efforts of ERS technology through CENELEC. It will probably prove a considerable challenge to successfully scale-up ERS technology out of the current testing phase in many different regards (technical, legal, economical etc.). On the other hand, it
17
would signal a serious effort to electrify the transportation sector from both the public and private sector and may serve as an important example for others to follow in regard to ever more stringent climate goals and urgency for sustainable societies.
An international cooperation of this scale would also probably spur the construction of national and more localized ERS-networks, not only in the three countries affected in the current corridor case study but also other countries within the EU as well as globally. There is also merit to the notion that construction of the analysed ERS corridor would require (or at least greatly benefit from) a parallel construction of national ERS-networks in the affected countries. A project of this size would most probably also expose a lot of people to ERS technology in particular, but also electrification/decarbonization efforts in general and may thus act as both a public and professional catalyst in future sustainability efforts.
The findings in this case study so far point toward implementing a rollout strategy for the ERS corridor in a series of stages as opposed to electrifying the entire corridor in one go. The proposed rollout strategy will initially focus on the ends of the corridor (Hamburg-Lübeck and Helsingborg-Malmö), which are characterized by shorter stretches that are heavily trafficked and could simultaneously serve as the foundation for the construction of national ERS-networks in both Sweden and Germany. Next, the section through Denmark (particularly the northern part
between Copenhagen and Køge) should be considered for electrification. This section is comparably long, characterized by high traffic flows and will thus play a crucial part in mitigating large amounts of CO2. The remaining section between Lübeck and Rödby is currently characterized by the lowest traffic flows on the corridor; however, this might change with the introduction of new road infrastructure (Fehmarn Belt Fixed Link).
The roll-out strategy described above assumes that also regional transports with total distances of less than 200 km would potentially benefit from an ERS. However, for such trips, we can expect that pure battery electric trucks will become more suitable also for medium distances if battery costs would continue to decrease. Generally speaking, there will be a trade-off between costs for the vehicle-side ERS
components, costs for additional battery capacity, and the cost of using ERS compared with the cost of using stationary charging. Future research needs to further investigate under which conditions regional and long-distance freight traffic could benefit from lower operating costs by using an existing ERS. This could significantly influence roll-out strategies for ERS.
This study about a potential Scandinavian-German ERS corridor yielded a number of results which can be used as input for general studies of international ERS corridors in Europe. This is true especially for the general requirements for implementation as well as for the role an international ERS corridor may play within a larger
implementation of ERS in Europe. The criteria set developed in this study may be used to assess further potential international ERS corridor routes, but need further development to accurately estimate the potential. It could serve as a basis for the development of a toolkit designed to explore European implementation pathways for ERS.
18
5 References
[1] European Environment Agency, “EEA greenhouse gas - data viewer,” 2 June 2020. [Online]. Available:
https://www.eea.europa.eu/data-and-maps/data/data-viewers/greenhouse-gases-viewer.
[2] The Federal Government of Germany & the Government of Sweden, “Innovation and cooperation for a sustainable future,” 1 April 2019. [Online]. Available:
https://www.regeringen.se/495ae2/contentassets/a67c825666d6461da5bcc2e72a620c0d/joint- declaration-of-intent-between-germany-and-sweden.pdf.
[3] Trafikverket, “National roadmap for electric road systems,” Swedish Transport Administration, 2017.
[4] M. G. Gustavsson, F. Hacker and H. Helms, “Overview of ERS concepts and complementary
technologies,” Swedish-German research collaboration on Electric Road Systems (CollERS), 2019.
[5] Intraplan & BVU, “Verkehrsprognose für eine Feste Fehmarnbeltquerung 2014 – Aktualisierung der FTC- Studie von 2002,” 2016.
[6] BVU, Intraplan, IVV, & Planco Consulting, “Verkehrsverflechtungsprognose 2030,” 2014.
[7] Öko-Institut, Heilbronn University of Applied Sciences, Fraunhofer IAO, & Intraplan, “StratON:
Bewertung und Einführungsstrategien für oberleitungsgebundene schwere Nutzfahrzeuge,”
2020.
[8] Trafikverket, “Prognos för godstransporter 2040 – Trafikverkets Basprognoser 2018,” 2018b.
[9] European Commission, “TENtec Interactive Map Viewer,” 2020. [Online]. Available:
https://ec.europa.eu/transport/infrastructure/tentec/tentec-portal/map/maps.html.
[10] D. Jelica, M. Taljegård, L. Thorson and F. Johnsson, “Hourly electricity demand from an electric road system – A Swedish case study,” Applied Energy, vol. 228, pp. 141-148, 2018.
[11] M. Taljegard, L. Thorson, M. Odenberger and F. Johnsson, “Large-scale implementation of electric road systems: Associated costs and the impact on CO2 emissions,” International Journal of
Sustainable Transportation, vol. 14, pp. 606-619, 2020.
[12] Trafikverket, “Nationell plan för transportsystemet 2018–2029,” 2018a. [Online]. Available:
https://www.trafikverket.se/for-dig-i-branschen/Planera-och-utreda/Planer-och- beslutsunderlag/Nationell-planering/nationell-transportplan-2018-2029/.
[13] Trafikverket, “National road data base,” 27 May 2015. [Online]. Available: https://www.nvdb.se/en.
[14] F. Johnsson, M. Taljegård, J. Olofsson, M. von Bonin and N. Gerhardt, “Electricity supply to electric road systems: Impacts on the energy system and environment,” Swedish-German research
collaboration on Electric Road Systems (CollERS), 2020.
19
[15] P. A. Linné, “Standardisation of Electric Road Systems: Report from workshop at FIRM19,” Swedish- German Research Collaboration on Electric Road Systems (CollERS), 2020.
[16] Umweltbundesamt, “Erneuerbare Energien in Deutschland Daten zur Entwicklung im Jahr 2018,” 2019.
[17] M. Taljegard, L. Göransson, M. Odenberger and F. Johnsson, “Impacts of electric vehicles on the electricity generation portfolio – A Scandinavian-German case study,” Applied Energy, vol. 235, pp. 1637-1650, 2019.
[18] Bundesministerium für Wirtschaft und Energie (BMWi), “Kommission "Wachstum, Strukturwandel und Beschäftigung",” 2019.
[19] European Union, “Directive (EU) 2018/2001 of the European Parliament and of the Council of 11
December 2018 on the promotion of the use of energy from renewable sources,” Official Journal of the European Union, vol. 61, no. L 328, p. 82, 2018.
[20] J. Giuntoli, “Advanced biofuel policies in select EU member states: 2018 update,” International Council on Clean Transportation (ICCT), 2018.
[21] J. P. M. Schulte, “Smarta steg på väg mot hållbara transporter?: Snabbladdningsinfrastruktur och elvägar ur ett strategiskt livscykelperspektiv,” Linnéuniversitetet, 2015.
[22] J. Nylander, “Elväg - E16, delrapport 8P,” Region Gävleborg, 2018.
[23] B. Berglund, S. Hörnfeldt, N. Granzell, G. Asplund, H. Dahlström, F. Wrede, M. Hellgren and N. Honeth,
“Sammanfattning av erfarenheter hittills,” eRoad Arlanda, 2018.
[24] Mineralölwirtschaftsverband e.V., “Statistiken: Tankstellenbestand,” 2019. [Online]. Available:
https://www.mwv.de/statistiken/tankstellenbestand/. [Accessed 16 January 2020].
[25] Bundesverband Güterkraftverkehr Logistik und Entsorgung (BGL) e.V, “Dieselpreis-Information (ab Tankstelle),” [Online]. Available: http://www.bgl-
ev.de/images/downloads/dieselpreisinformation_tankstelle.pdf. [Accessed 16 January 2020].
[26] Riksförbundet M Sverige, “Genomsnittspriser Europa 2019-08-16,” [Online]. Available:
https://msverige.se/library/3726/2019-08-16.pdf. [Accessed 2019].
[27] Forsyningstilsynet, “Elprisstatistik 3. kvartal 2019”.
[28] Konsumenternas Energimarknadsbyrå, “Normal elförbrukning och elkostnad för villa,” [Online].
Available: https://www.energimarknadsbyran.se/el/dina-avtal-och-
kostnader/elkostnader/elforbrukning/normal-elforbrukning-och-elkostnad-for-villa/. [Accessed 29 January 2020].
[29] Volvo Technology AB, “Slide In-teknik för kontinuerlig överföring av energi till elektriska fordon, Fas2,”
2018.
20
[30] E. den Boer, S. Aarnink, F. Kleiner and J. Pagenkopf, “Zero emissions trucks: An overview of state-of-the- art technologies and their potential,” The International Council for Clean Transportation (ICCT)., 2013.
[31] M. Grahn, M. Taljegard and S. Brynolf, “Electricity as an Energy Carrier in Transport: Cost and Efficiency Comparison of Different Pathways,” in EVS 31 & EVTeC 2018, 2018.
[32] European Commission Decision C(2020)6320, Smart, green and integrated transport, 2020.
[33] European Commission, “Connecting Europe Facility,” 26 October 2020. [Online]. Available:
https://ec.europa.eu/transport/themes/infrastructure/cef_en.
[34] Scandria, [Online]. Available: https://www.scandria-corridor.eu/index.php/en/.
[35] J. Jöhrens, J. Rücker, H. Helms, W. Schade and J. Hartwig, “Roadmap OH-Lkw: Hemmnisanalyse,” ifeu, 2018.
[36] RISE Research institutes of Sweden, Öko-Institut, ifeu, “Overview of ERS concepts and complementary technologies,” 2019.
[37] Bundesministerium für Umwelt, Naturschutz, Bau und Reaktorsicherheit (BMUB), “Klimaschutzplan 2050. Klimaschutzpolitische Grundsätze und Ziele der Bundesregierung,” Berlin, 2016.
[38] Naturvårdsverket, “Fördjupad analys av svensk klimatstatistik 2017,” Stockholm, 2017.
21
6 Annex
6.1 Freight transport between Scandinavia and Germany
Status quo of transports
A feasibility analysis of a potential Swedish-German ERS corridor will be focused on landside road freight transport. Nevertheless, rail transports are included in the following description of transport flows in the study area between Sweden and Germany because there is a possible competition situation between railway and road traffic. Freight traffic with trucks via the different ferry lines across the Baltic Sea, the Kattegat and the Skagerrak plays an important role for goods transports between Germany and the Scandinavian countries – these traffics are counted to road freight transport, because the main mode for transporting the goods from origin to
destination is the truck transportation, the ferries are only used to a shorter or longer distance in between. Pure maritime freight transports are not listed because they are not relevant for ERS, but feeder traffic to and from the ports with landside transport modes is included in the description. One important data source for transport and traffic flows in the CollERS study area is the Fehmarn Belt Forecast 2014 [5], more and detailed information about data sources, data collection and data processing can be found there.
6.1.1.1 Transport flows
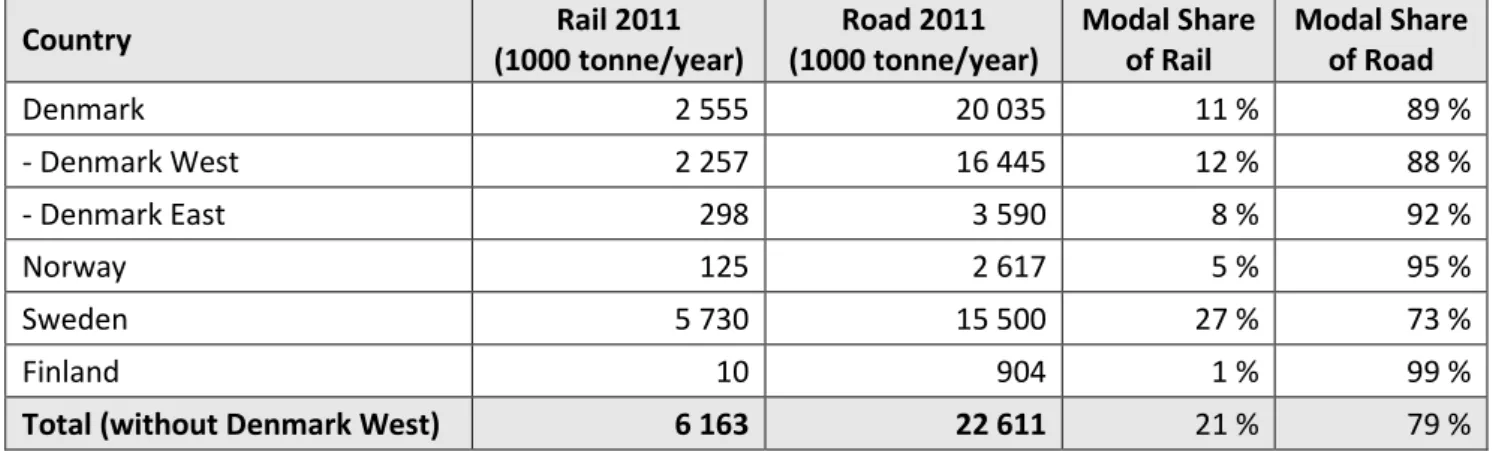
Table 1 shows the transport flows between the Scandinavian countries and Germany per mode for 2011. Transport flows to and from Denmark are separated into
Denmark West and Denmark East. The first ones are of minor importance for an ERS corridor because they follow the road and motorway network from Hamburg northwards to the Danish border in Jutland and might strike the possible ERS- corridor2 only on short stretches between Hamburg and Lübeck.
Within the study area, road transport has a market share of nearly 80 % in total, including Denmark West it is 82 %, even higher for transports with Denmark, Norway and Finland, but lower for transports to and from Sweden (about 73 %). Neglecting the transport flows to Western Denmark, Sweden is the most important country in Scandinavia concerning transport flows with Germany.
Table 1: Origin-destination transport flows between Scandinavian countries and Germany (including transit traffic via Germany) per mode in 2011. Data Source: Fehmarn Belt Forecast 2014
Country Rail 2011
(1000 tonne/year)
Road 2011 (1000 tonne/year)
Modal Share of Rail
Modal Share of Road
Denmark 2 555 20 035 11 % 89 %
- Denmark West 2 257 16 445 12 % 88 %
- Denmark East 298 3 590 8 % 92 %
Norway 125 2 617 5 % 95 %
Sweden 5 730 15 500 27 % 73 %
Finland 10 904 1 % 99 %
Total (without Denmark West) 6 163 22 611 21 % 79 %
2 See Sec. 6.2.1.
22
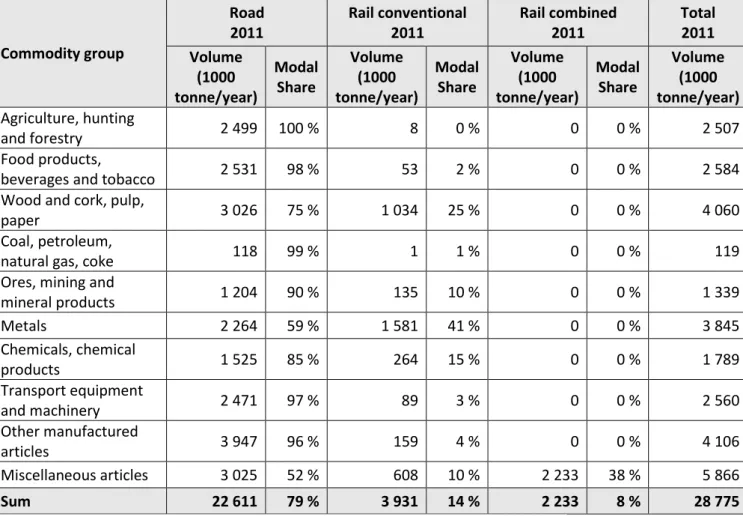
As shown in Table 2, most of the transported goods between Scandinavia and Germany are related to “miscellaneous articles”, followed by “other manufactured articles” and “metals”. “Miscellaneous articles” are transported in containers to a large extent, therefore the high share of combined rail/road transports. On rail only selected commodity groups are transported, but all commodity groups are
transported by road as well – the modal share of road transport is over 50 % for all commodity groups.
Table 2: Traffic volume between Scandinavia and Continental Europe by commodity groups and transport modes in 2011 (without Denmark West). Data Source: Fehmarn Belt Forecast 2014
Commodity group
Road 2011
Rail conventional 2011
Rail combined 2011
Total 2011 Volume
(1000 tonne/year)
Modal Share
Volume (1000 tonne/year)
Modal Share
Volume (1000 tonne/year)
Modal Share
Volume (1000 tonne/year) Agriculture, hunting
and forestry 2 499 100 % 8 0 % 0 0 % 2 507
Food products,
beverages and tobacco 2 531 98 % 53 2 % 0 0 % 2 584
Wood and cork, pulp,
paper 3 026 75 % 1 034 25 % 0 0 % 4 060
Coal, petroleum,
natural gas, coke 118 99 % 1 1 % 0 0 % 119
Ores, mining and
mineral products 1 204 90 % 135 10 % 0 0 % 1 339
Metals 2 264 59 % 1 581 41 % 0 0 % 3 845
Chemicals, chemical
products 1 525 85 % 264 15 % 0 0 % 1 789
Transport equipment
and machinery 2 471 97 % 89 3 % 0 0 % 2 560
Other manufactured
articles 3 947 96 % 159 4 % 0 0 % 4 106
Miscellaneous articles 3 025 52 % 608 10 % 2 233 38 % 5 866
Sum 22 611 79 % 3 931 14 % 2 233 8 % 28 775
Transport flows between Scandinavia and Continental Europe are almost symmetric:
in 2011 goods transported from Scandinavia to Continental Europe amounted to 14 127 tonnes, whereas from Continental Europe to Scandinavia 14 647 tonnes were transported.
6.1.1.2 Road freight traffic flows
Development of road freight traffic flows between Continental Europe and Scandinavian countries since 1995 is demonstrated in the following figures using average trucks per year as a unit. They all show that total road traffic flows in the study area have more than doubled on the displayed sections between 1995 and
23
2018, which means average annual growth rates of more than 3 % per year3, interrupted by declines due to the worldwide economic crisis beginning in 2008.
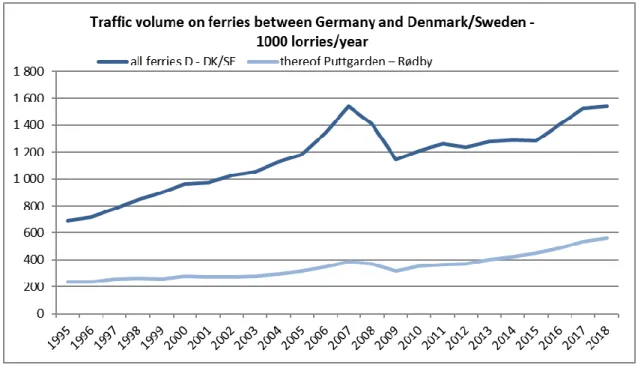
Meanwhile, the level of traffic flows has reached the levels before the crisis, between Denmark and Sweden the level is now even higher than ever before. In Denmark and Sweden, ferry links lost market shares after opening of Great Belt Bridge in 1998 and Øresund Bridge in 2000, both bridges did not only gain traffic flows from ferries but also led to further economic integration of the linked regions and therefore to increasing traffic flows.
Figure 1: Development of traffic volumes on ferries between Germany and Denmark/Sweden from 1995 to 2018 - in 1.000 lorries per year. Data sources: Danmarks Statistik (statbank.dk), Trafikanalys (trafa.se)
3 Average annual growth rate for trucks from 1995 to 2018 is at 3.6 % in sum of all ferries between Germany and Denmark/Sweden, at 3.3 % in sum of ferries in Denmark and Great Belt Bridge and at 3.8 % in sum of ferries between Denmark and Sweden and on Øresund Bridge.
24
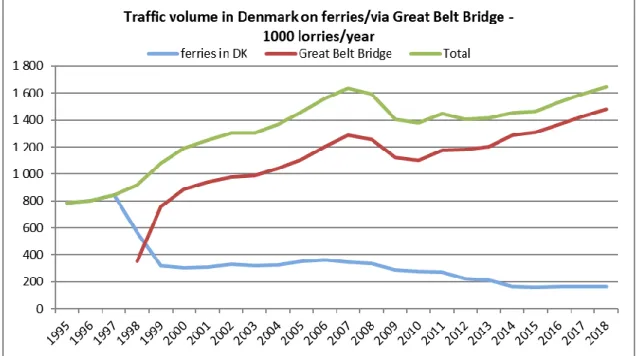
Figure 2: Development of traffic volumes in Denmark from 1995 to 2018 – in 1 000 trucks per year.
Data sources: Danmarks Statistik (statbank.dk), Storebaelt.dk
Figure 3: Development of traffic volumes between Denmark and Sweden from 1995 to 2018 – in 1 000 trucks per year. Data sources: Danmarks Statistik (statbank.dk), Oresundsbron.com
Expected developments
Future development of freight transport flows in the study area depends to a large extent on the development of trade volumes – of domestic trade volumes in the countries of Germany, Denmark and Sweden on the one hand and of foreign trade volumes between the Scandinavian countries and the European continent on the other hand. Development of foreign trade volumes until 2030 under consideration of
25
expansion of road and rail infrastructure4 in the study area could be adopted from the Fehmarn Belt Forecast of 2014 [5], see the following three tables describing the development of freight transport volumes in thousand tonnes per year and per country (Table 3), per mode (Table 4) and per commodity group (Table 5).
Table 3: Forecasted transport flows between Scandinavian countries and Germany (including transit traffic via Germany) per country from 2011 to 2030. Data Source: Fehmarn Belt Forecast 2014
Country
2011 2030 (Case B)
Yearly Growth 2011–2030 Volume
(1000 tonne/year) Share Volume
(1000 tonne/year) Share
Denmark East 3 888 14 % 5 834 13 % 2.2 %
Norway 2 742 10 % 4 111 9 % 2.2 %
Sweden 21 230 74 % 34 435 75 % 2.6 %
Finland 913 3 % 1 386 3 % 2.2 %
Sum 28 774 100 % 45 766 100 % 2.5 %
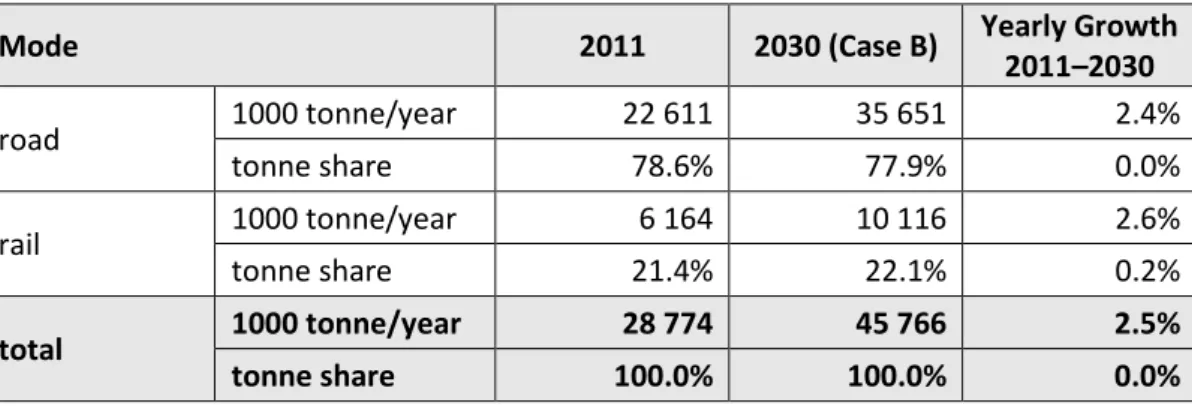
Table 4: Forecasted road and rail transport flows between Scandinavian countries and Germany (including transit traffic via Germany) from 2011 to 2030. Data Source: Fehmarn Belt Forecast 2014
Mode 2011 2030 (Case B) Yearly Growth
2011–2030
road 1000 tonne/year 22 611 35 651 2.4%
tonne share 78.6% 77.9% 0.0%
rail 1000 tonne/year 6 164 10 116 2.6%
tonne share 21.4% 22.1% 0.2%
total 1000 tonne/year 28 774 45 766 2.5%
tonne share 100.0% 100.0% 0.0%
4 Fehmarn Belt Fixed Link with road- and rail-infrastructure replaces ferry link Puttgarden – Rødby, completed motorway network in Germany with A 39 Lüneburg – Wolfsburg, A 14 Schwerin – Magdeburg and A 20 northern bypass of Hamburg with Elbe-crossing amongst others.
26
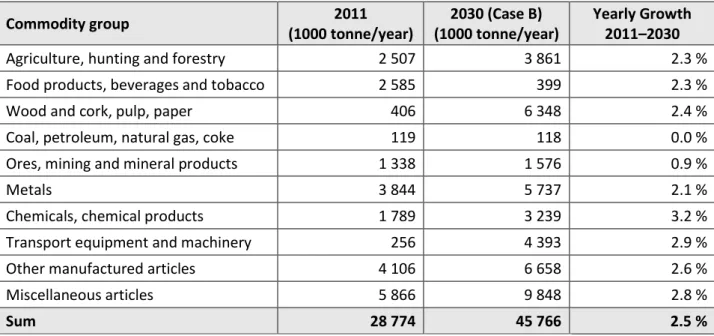
Table 5: Forecasted transport flows between Scandinavian countries and Germany (including transit traffic via Germany) per commodity group from 2011 to 2030. Data Source: Fehmarn Belt Forecast 2014
Commodity group 2011
(1000 tonne/year)
2030 (Case B) (1000 tonne/year)
Yearly Growth 2011–2030
Agriculture, hunting and forestry 2 507 3 861 2.3 %
Food products, beverages and tobacco 2 585 399 2.3 %
Wood and cork, pulp, paper 406 6 348 2.4 %
Coal, petroleum, natural gas, coke 119 118 0.0 %
Ores, mining and mineral products 1 338 1 576 0.9 %
Metals 3 844 5 737 2.1 %
Chemicals, chemical products 1 789 3 239 3.2 %
Transport equipment and machinery 256 4 393 2.9 %
Other manufactured articles 4 106 6 658 2.6 %
Miscellaneous articles 5 866 9 848 2.8 %
Sum 28 774 45 766 2.5 %
In total transport flows between the Scandinavian countries and Continental Europe are expected to grow by 2.5 % per year between 2011 and 2030, for road freight transport a little bit lower with 2.4 % per year and for rail traffic a little bit more with 2.6 % per year. Modal share of rail transports will increase slightly from 21.4 % in 2011 to 22.1 % in 2030.
Although ferry line Puttgarden – Rødby is assumed to be replaced by the Fehmarn Belt Fixed Link, transport routes between Sweden and Germany via alternative ferry links still will play an important role then.
Not all relevant transport flows for the present CollERS study are covered by the Fehmarn Belt Forecast of 2014, the traffic forecast for 2030 [6], and the forecast 2050 for the German StratON-project [7], so development of the remaining flows had to be forecasted on basis of other sources and information. Table 6 contains an overview per origin-destination (OD) pair on level of countries about the used data sources for the forecasts of the freight traffic flows for 2030 and 2050 and on the expected growth of traffic volumes from 2011 to 2030 and 2050. Section 6.2.2 contains further details on the traffic flows particularly on the chosen corridor route.
Table 6: Assumed development of transport flows per origin-destination (OD) until 2030 and 2050 - growth in % compared to 2010 (=100) and used data sources
OD-pair 2011 2030 2050 Base/Data-Source
DE – Scandinavia 100 157 197 Fehmarn Belt Forecast 2014 / Traffic Forecast 2030 / StratON 2050
DK – DK 100 135 171 No official forecasts for Denmark available, growth rates derived from development until DK – NO, FI 100 143 196
27
DK – SE 100 155 239 2018 and comparison with development in neighbouring countries
SE – SE 100 136 179 Swedish Transport Administration forecast for freight transport 2040 [8]
SE – NO, FI 100 143 196
Derived from Swedish Transport
Administration forecast for freight transport 2040
In general, there are two trends visible:
• growth rates in the future are expected to be lower than the observed ones in the past5 which have been over 3 % per year – between 2011 and 2030 freight traffic between Germany and the Scandinavian countries has the highest forecasted annual growth rate with 2.4 %, from 2011 to 2050 its between Denmark and Sweden with 2.3 %, and
• international freight traffic flows are expected to increase stronger than domestic flows due to stronger growth of foreign trade.
Femern A/S, responsible for construction and operation of the Fehmarn Belt Fixed Link, expects opening of the link from today’s point of view in 20286. It will then offer purely landbound and direct connections on road and rail between Hamburg and Copenhagen/Malmö. Especially rail freight traffic between Germany and Scandinavia is expected to shift to a large extent to this new link which will be considerably shorter than the alternative route via the Great Belt. For road freight traffic the new link will also offer improved connections, but not in that extent as in rail traffic and therefore share of transports via the route over Puttgarden – Rødby will increase only slightly.
Limitation of traffic flows due to missing capacities in infrastructure, rail and road, play a minor role on most parts of the corridor today and in the future, but of course traffic flows (in freight and in passenger traffic) are more dense in the metropolitan regions of Hamburg, Copenhagen and Malmö, congestions are delays are more frequent there.
5 This is due to more conservative assumptions regarding growth of GDP.
6 https://femern.com/en/Tunnel/Project-status/Milestones-for-the-project
28
6.2 Description of Exemplary Corridor Route
Selection of corridor route
Looking at traffic flows between Continental Europe resp. Germany and Scandinavia, three main transport corridors for land-bound traffic can be identified:
a) from Hamburg via Flensburg and the Great Belt crossing the Öresund;
b) from Hamburg via Lübeck, crossing the Fehmarn Belt between Puttgarden and Rødby and over the Öresund; and
c) from Hamburg/Berlin to Rostock, via the Baltic sea to Gedser and crossing the Öresund;
in combination with several ferry lines which offer alternative transport routes crossing the Baltic sea like Lübeck – Malmö/Trelleborg, Rostock – Trelleborg, Kiel – Gothenburg, Helsingør – Helsingborg and more.
Route b) via the Fehmarn Belt using the ferry link is already very important today and it will become even more important in the future after realisation of the Fehmarn Belt Fixed Link. Then it will offer a purely landbound and direct motorway and railway connection between the metropolitan areas of Hamburg, Copenhagen, Malmö, Gothenburg and Stockholm and thus it will be the most meaningful corridor for a possible ERS-connection between Sweden and Germany7.
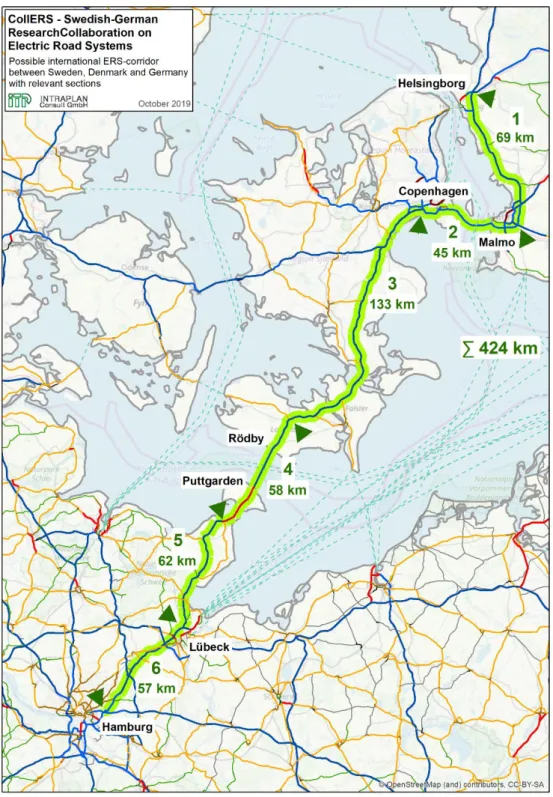
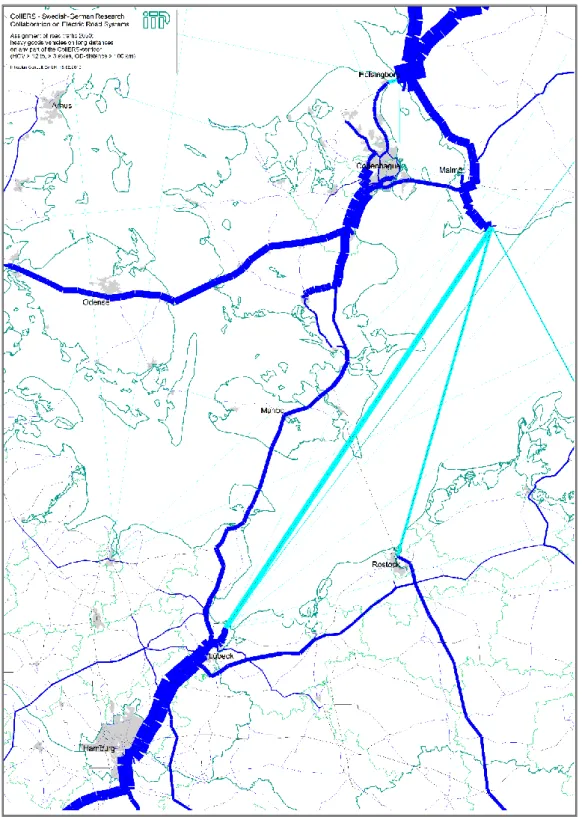
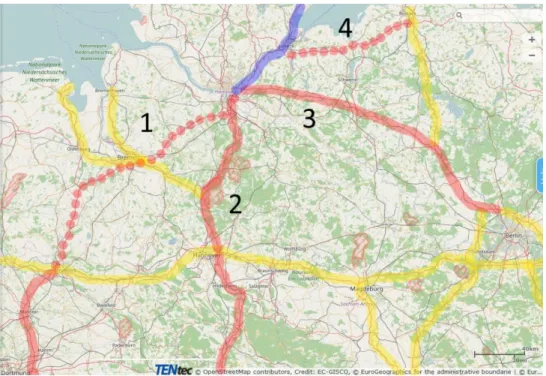
The potential ERS-corridor examined in detail in this study is shown in Figure 4. It starts at Helsingborg in Sweden following the route E6 south to Malmö, crossing the Öresund via the fixed link to Copenhagen and following the route E47 via Køge, Rødby, the Fehmarn Belt Fixed Link, Puttgarden to Lübeck and via the route E22 to Hamburg. Helsingborg and Hamburg were chosen as starting and ending points because there are important motorway junctions where traffic flows spread to different directions. The total length of the corridor is 424 km and it was divided into six sections under the following aspects:
• important motorway interchanges or junctions as starting or ending points of the sections;
• separation of sections with importance for mainly national or international traffic;
• homogenous traffic flows, junctions to alternative routes (via ferry lines) at starting or ending points of the sections.
Section 1 with a length of 69 km starts in Helsingborg at the junction of Trafikplats Kropp to Malmö West, Trafikplats Fredriksberg, section 2 has a length of 45 km and ends in Copenhagen at the junction of Motorvejskryds Avedøre, section 3 is the longest one with 133 km and ends on the Island of Lolland at junction Maribo, section 4 with a length of 58 km crosses the Fehmarn Belt to junction Heiligenhafen Ost, junction Dreieck Bad Schwartau separates section 5 with 62 km from section 6 which ends after 57 km at junction Kreuz Hamburg Ost.
7 See Sec. 6.2.2 with the results of the traffic flow analysis and the share of road freight transports between Sweden and Germany via the corridor.
29
Figure 4: Possible international ERS-corridor between Sweden, Denmark and Germany with relevant segments (source: own work Intraplan).
30 Traffic flows on the corridor route
An overview of the methodology and steps of traffic flows analysis is shown in Figure 5, the individual steps are described below.
Figure 5: Methodology of traffic flows analysis – Overview of steps (source: own work Intraplan)
Data collection
Traffic flows analysis started with data collection and data comparison – which data concerning transport flows and traffic flows are available in the study area of the potential ERS-corridor? Since the three countries Sweden, Denmark and Germany are concerned by the corridor it was not only necessary to analyse the official statistics of these three countries but furthermore to look for more data concerning traffic flows, e.g. over bridges and via ferry lines to get a picture as full as possible of the transport and traffic flows in the corridor region.
Data consolidation
These data had to be harmonised with regard to base year, zonal levels, vehicle types and commodity groups. Gaps in the collected data were identified and filled up to provide a consistent database of traffic flows for heavy goods vehicles (HGV) per origin-destination pairs (OD on level of NUTS3-zones in Sweden, Denmark, Norway;
more detailed in Germany) in the wider study area for the base year 2011.
Table 7 shows the most important data sources used for modelling the traffic flows in the study.
31
Table 7: Most important transport and traffic flow data
Main source Traffic flows Units Remarks
Fehmarn 20148 DE, EU – DK East, SE, NO, FI, per commodity group
tonnes, vehicles
analysis 2011 and forecast 2030 BVWP 20309
DE – DE,
DE – international, transit traffic,
per commodity group and NUTS 3
tonnes, vehicles
analysis 2010 and forecast 2030
StratON10
DE – DE,
DE – international, transit traffic,
per commodity group and NUTS 3
tonnes, vehicles
forecast 2030 and 2050, based on BVWP 2030
Danmarks Statistik (statbank.dk)
Domestic traffic flows in DK between provinces per rough commodity group,
international traffic between countries
tonnes, vehicles
Yearly,
detailed and reliable, no forecast available
Trafikanalys (trafa.se)
Domestic traffic flows in SE between län, international traffic between countries
tonnes, vehicles per county, but no OD- matrix
Yearly,
detailed and reliable, processing necessary
Prognos för
godstransporter 204011
Domestic traffic in SE, international traffic
tonnes, vehicles per county, but no OD- matrix
analysis and forecast 2040 and 2060
The database for the study covers the following OD traffic-flows:
• International traffic
o between Germany and the rest of the countries on the Continent on the one side and the Eastern part of Denmark, Sweden, Norway and Finland on the other side12;
o also between Denmark and Sweden/Norway; and o between southern Sweden and Norway.
• Domestic traffic, in Germany with the region north and east of Hamburg, in Denmark east of the Great Belt and in Sweden with the Skåne län (regional traffic that stays within county Skåne is not included).
Table 8 demonstrates the used data sources in the study per country-based Origin- Destination pairs.
8 Intraplan & BVU. (2016). Verkehrsprognose für eine Feste Fehmarnbeltquerung 2014 – Aktualisierung der FTC-Studie von 2002.
9 BVU, Intraplan, IVV, & Planco Consulting. (2014). Verkehrsverflechtungsprognose 2030.
10 Öko-Institut, Heilbronn University of Applied Sciences, Fraunhofer IAO, & Intraplan. (2020).
StratON: Bewertung und Einführungsstrategien für oberleitungsgebundene schwere Nutzfahrzeuge.
11 Trafikverket. (2018). Prognos för godstransporter 2040 – Trafikverkets Basprognoser 2018.
12 This includes transit traffic through Germany, for example from Italy to Sweden.
32
Table 8: Used data sources per OD-pair
SE DE DK NO
SE Trafikanalys (SE) Fehmarn 2014/BVWP
2030 /StratON Danmarks Statistik Trafikanalys (SE) DE Fehmarn 2014/BVWP
2030 /StratON BVWP 2030 Fehmarn 2014/BVWP
2030 /StratON
Fehmarn 2014/BVWP 2030 /StratON DK Danmarks Statistik Fehmarn 2014/BVWP
2030 /StratON Danmarks Statistik Fehmarn 2014/BVWP 2030 /StratON NO Trafikanalys (SE) Fehmarn 2014/BVWP
2030 /StratON Danmarks Statistik not necessary
Road network model and Assignment of HGV traffic
For assigning the traffic flows to roads, a road network model was set up. It contains not only the important road network in the wider study area of the Scandinavian countries and Germany and its neighbouring countries on the continent, but also the ferry links in the corridor area crossing the Baltic Sea as well as the Kattegat and the Skagerrak. The road network model maps the situation in the base year 2011, as well as it considers future developments in road infrastructure until 2030 and 2050 as assumed in the German Federal Master Plan BVWP 2030 [6] or the study for the Fehmarn Belt Fixed Link [5]. For example, the ferry link over the Fehmarn Belt is assumed to be replaced by the Fehmarn Belt Fixed Link before 2030, the motorway network in Germany is assumed to be expanded further (amongst others A 39 Lüneburg – Wolfsburg, A 14 Schwerin – Magdeburg, A 20 northern bypass of Hamburg with Elbe-crossing).
The HGV traffic flows for the base year 2011 were assigned to the road network for the corresponding base year with a route choice model, taking into account the different characteristics and qualities of alternative routes like length, time and prices. Traffic volumes and chosen routes were calibrated with additional empirical data of ferry links and bridges.
Forecast 2030 and extrapolation 2050
After completion of the forecast traffic flow results for 2030 for the additional OD- pairs not covered by BVWP 2030 and Fehmarn Belt Forecast 2014, the traffic flows were assigned to the road network for 2030 in an intermediate step. In a second step, the traffic flow data for 2030 were extrapolated to 2050 under consideration of traffic growth rates per country OD-pairs derived from the above-mentioned data sources (see Table 7 and Table 8) and as well assigned to the future road network assumed for 2050 which of course also includes the alternative route options like ferry links.
Selected link analysis
The relevant traffic flows via the corridor were identified with a selected link analysis based on the sub-sections between every junction on the corridor. The selected link analysis is a special assignment method that allows not only to quantify the traffic loads on the sub-sections of the road network but also to identify origins and
33
destinations of all traffic flows using the sub-sections. HGV-demand (HGV with more than 12 tonnes and more than 3 axles)13 per OD-pairs was that way analysed for the whole corridor in total and for its six sections:
• for long-distance HGV (OD-trip-distance more than 100 km),
• thereof long-distance HGV with a trip distance on the corridor-infrastructure of more than 100 km and
• for regional HGV-traffic flows (OD-trip-distance less than 100 km) just as an additional potential for using a possible ERS-infrastructure along the corridor.
Classification of results
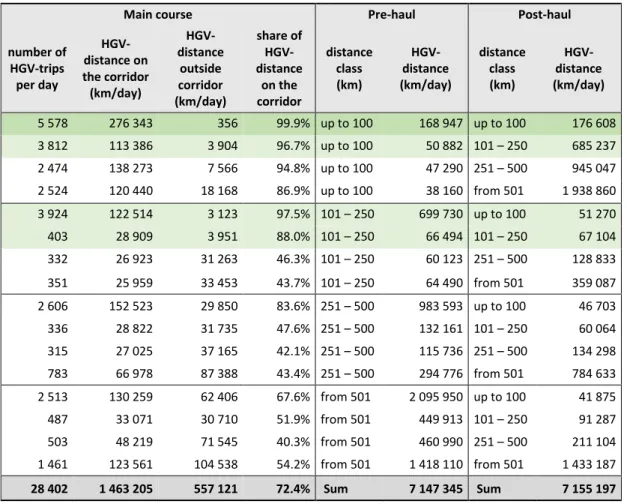
For each OD-pair via the ERS-corridor identified in the selected link analysis the following criteria and distances were identified and calculated:
• Distance on the road network from the origin of the OD-trip to the first interchange entering the corridor (Pre-haul-distance).
• Distance on the road network from the last interchange leaving the corridor to the final destination of the OD-trip (Post-haul-distance).
• Distances for the Main-course – the main-course is the part of the OD-trip between the first interchange entering the corridor and the last interchange leaving the corridor. As the analysis of the traffic flow assignment results and the selected link analysis showed there is a significant number of OD-trips where the corridor is left and re-entered again later by using alternative transport-routes like other roads or ferry links in between14. For a calculation of ERS-potentials it was therefore necessary to distinguish between main- course-distance on the corridor and main-course-distance outside the corridor.
The resulting OD-pairs of the selected-link-analysis were aggregated and classified per distance classes in pre-haul and distance classes in post-haul. On this basis, the suitability of the respective OD-pairs for Battery Electric ERS Vehicles (ERS-BEV) or Hybrid Electric ERS Vehicles (ERS-HEV) is estimated (see section 6.3.1.1).
Results traffic flow analysis for 2050
In the following, the results of the traffic flow analysis are explained for the selected link analysis of the whole corridor.
Table 9 shows the results of the traffic flow analysis for the whole corridor in detail – per distance classes in pre-haul and post-haul as described above.
13 The following descriptions of the results always refer to HGV with weight of more than 12 tonnes and more than 3 axles if not mentioned different.
14 For example, an OD-trip from Hamburg to Gothenburg can use the corridor from Hamburg to interchange AD-Lübeck-Bad Schwartau, using the ferry-link between Lübeck-Travemünde and Trelleborg outside the corridor, and re-enter the corridor at the interchange Malmö- Petersborg till Helsingborg.