Geophysical Journal International
Geophys. J. Int.(2015)203,776–791 doi: 10.1093/gji/ggv309
GJI Geodynamics and tectonics
Structure and tectonics of the central Chilean margin (31 ◦ –33 ◦ S):
implications for subduction erosion and shallow crustal seismicity
Eduardo Contreras-Reyes,
1Javier A. Ruiz,
1Juan Becerra,
2Heidrun Kopp,
3Christian Reichert,
4Andrei Maksymowicz
1and C´esar Arriagada
21Departamento de Geof´ısica, Facultad de Ciencias F´ısicas y Matem´aticas, Universidad de Chile, Blanco Encalada2002, Santiago, Chile.
E-mail:econtreras@dgf.uchile.cl
2Laboratorio de Tect´onica y Paleomagnetismo, Departamento de Geolog´ıa, Facultad de Ciencias F´ısicas y Matem´aticas, Santiago, Chile
3GEOMAR Helmholtz Zentrum f¨ur Ozeanforschung Kiel and Christian-Albrechts-Universit¨at zu Kiel, Kiel, Germany
4Bundesanstalt f¨ur Geowissenschaften und Rohstoffe (BGR), Hannover, Germany
Accepted 2015 July 22. Received 2015 June 23; in original form 2015 January 16
S U M M A R Y
The pre- and current collision of the Juan Fern´andez Ridge with the central Chilean margin at 31◦–33◦S is characterized by large-scale crustal thinning and long-term subsidence of the submarine forearc caused by subduction erosion processes. Here, we study the structure of the central Chilean margin in the ridge–trench collision zone by using wide-angle and multichannel seismic data. The transition from the upper to middle continental slope is defined by a trenchward dipping normal scarp with variable offsets of 500–2000 m height. Beneath the scarp, the 2-D velocity–depth models show a prominent lateral velocity contrast of>1 s−1 that propagates deep into the continental crust defining a major lateral seismic discontinuity.
The discontinuity is interpreted as the lithological contact between the subsided/collapsed outermost forearc (composed of eroded and highly fractured volcanic rocks) and the seaward part of the uplifted Coastal Cordillera (made of less fractured metamorphic/igneous rocks).
Extensional faults are abundant in the collapsed outermost forearc, however, landward of the continental slope scarp, both extensional and compressional structures are observed along the uplifted continental shelf that forms part of the Coastal Cordillera. Particularly, at the landward flank of the Valpara´ıso Forearc Basin (32◦–33.5◦S), shallow crustal seismicity has been recorded in 2008–2009 forming a dense cluster of thrust events ofMw4–5. The estimated hypocentres spatially correlate with the location of the fault scarp, and they highlight the upper part of the seismic crustal discontinuity.
Key words: Seismicity and tectonics; Subduction zone processes; Continental margins:
convergent; Neotectonics.
1 I N T R O D U C T I O N
Loss of marginal continental crust by subduction erosion occurs in at least 50 per cent of the convergent margins, and it occurs typi- cally in subduction zones with poorly sedimented trenches and high convergence rates (Clift & Vannucchi2004; Kukowski & Oncken 2006). These margins are characterized by a long-term arcward retreat of the trench, crustal thinning and subsidence of the outer forearc. Usually, the continental slope is steep and the front of the margin lacks a well-developed accretionary prism. This is the case of the north-central (NC) Chilean margin (20◦–34◦S), that is char- acterized by a poorly sedimented trench as a consequence of little sediment supply from the Andes to the trench offshore the extremely arid region of the Atacama desert. In addition, the Juan Fern´andez hotspot track or Juan Fern´andez Ridge (JFR) behaves as a barrier to trench sediment transport from the sediment-flooded southern
Chile trench to the north. Subduction erosion of the NC Chilean margin has also been inferred from the eastward migration of the volcanic arc since the Mesozoic (e.g. Rutland1971).
The first collision of the JFR with the Chilean margin occurred in the north (at ∼20◦S) at approximately 22 Ma, and it has mi- grated southward to the current collision zone offshore Valpara´ıso (∼32.5◦S) (Y´a˜nezet al.2001). Due to the little obliquity of the JFR and the∼N78◦E convergence direction of the Nazca plate, the current ridge-trench collision zone has remained stationary since
∼10 Ma. Basal erosion enhanced by the JFR subduction has most likely thinned the continental crust at large depths and increased the subsidence rate of the margin to form the Valpara´ıso Forearc Basin (VFB; Laursen et al. 2002). South of the ridge-trench collision zone, the continental margin is characterized by a broad continental shelf (upper and middle slope), and a relatively large 20–40 km wide accretionary prism that constitutes the lower part of the upper
776 CThe Authors 2015. Published by Oxford University Press on behalf of The Royal Astronomical Society.
at Leibniz-Institut fur Meereswissenschaften on September 10, 2015http://gji.oxfordjournals.org/Downloaded from
plate (Fluehet al.1998; Zelt1999; Contreras-Reyeset al.2013).
In contrast, in the pre- and current collision zone, the upper slope descends steeply from a narrow (5–10 km wide) uplifted shelf, and the toe of the margin is truncated by subduction erosion processes (von Hueneet al.1997;1999; Laursenet al.2002; Raneroet al.
2006).
Seismic investigations reveal that the frontal part of the margin off NC Chile (40–60 km) is composed of an outer forearc with velocities of 3.5–5.0 km s−1, which are typical for volcanic rocks (Koulakovet al.2011; Kopp2013; Contreras-Reyeset al.2014).
However, these seismic studies reveal the presence of prominent lat- eral velocity gradients suggesting a change in rock type and strong lateral variation in the direction of the dip. For instance, Contreras- Reyeset al.(2014) reported a strong lateral velocity contrast from
∼5 to∼6 km s−1at the middle-upper slope transition zone that was interpreted as the volcanic-metamorphic/igneous basement contact defining the transition from the subsided outermost forearc block to the uplifted seaward part of the Coastal Cordillera. The prolongation of this proposed crustal discontinuity southwards and northwards as well as its seismotectonic implications have been poorly explored along the NC Chilean margin. In this paper, we investigate the seis- mic structure off central Chile between 31◦S and 33◦S covering the zones of past and current collision between the JFR and the South American plate. We use wide angle seismic constraints comple- mented by high-resolution seismic reflection and bathymetric data to image the structure of the margin. Furthermore, we discuss the interplay between shallow intraplate seismicity recorded beneath the landward flank of the VFB and the structure of the submarine forearc.
2 T E C T O N I C S E T T I N G
Subduction erosion has been active in north and central Chile since at least the Jurassic (e.g. Rutland1971; von Huene et al.1999;
Kukowski & Oncken 2006; Ranero et al. 2006). This has been mainly inferred from the magmatic arc migration, which has mi- grated∼250 km to the East since ∼150 Ma, resulting in a land- ward trench migration rate of approximately 1.7 km Ma−1 (e.g.
Rutland1971). The lower continental slope is dominated by slump- ing and mass wasting filling the trench with debris material (von Hueneet al.1999; Raneroet al.2006). Subduction of high-relief horst-and-graben topography along the plate interface is coherent with pressurized fluids that may fracture the overlying continental basement, and the eroded material is then carried down hosted in grabens of the already fractured oceanic lithosphere in response to plate bending in the outer rise region (von Hueneet al.1999; Ranero et al.2006).
The age of the oceanic Nazca plate in NC Chile ranges from∼37 Ma to∼48 Ma (Muelleret al.1997). The oceanic plate presents a well-developed outer bulge or outer rise with remarkable bend- ing related faults striking approximately parallel to the trench axis (Ranero et al.2006; Contreras-Reyeset al.2013). The most re- markable bathymetric features on the oceanic plate near the central Chile trench are the O’Higgins guyot and O’Higgins seamount that form part of the easternmost portion of the JFR before subduc- tion (Fig. 1). Magnetic data provided evidence for subduction of a seamount (Papudo seamount) at∼72.5◦W/32.6◦S (Y´a˜nezet al.
2001) leaving a re-entrant at the trench. Landward of the trench, the bathymetric data show an uplifted surface called the Punta Salinas Ridge that has been suggested to be caused by the JFR subduction (von Huene et al.1997; Laursenet al.2002). The Punta Salinas
Ridge and Topocalma knoll are located at the northern and southern edges of the VFB, respectively. The Topocalma knoll corresponds to another uplifted part of the continental shelf that lies next to the San Antonio canyon (Fig.1c). Laursenet al.(2002) proposed that the tectonic evolution of the Topocalma knoll and the San Antonio Canyon was controlled by the impact of the San Antonio seamount.
These authors suggest that the collision of this seamount formed the San Antonio re-entrant and warped the middle slope along its landward advancing path (Fig.1c).
In addition to the subduction of high-relief of the horst-graben topography, basal erosion is likely enhanced by the JFR subduc- tion causing thinning of the continental crust at large depths and to increase the subsidence rate of the margin. This process has been suggested as a mechanism to form the large VFB with a subsi- dence rate of∼0.3–05 km Myr−1(Laursenet al.2002). In addition, the NE onshore projection of the JFR is traced by clustered inter- plate seismicity that extend>700 km inland of the trench and define the southern edge of central Chile flat-slab subduction (Pardoet al.
2002; Andersonet al.2007). Furthermore, the zone of the collision of the JFR with the central Chile trench is also coincident with the large thrust March 3, 1985 earthquake (Ms=7.8) that ruptured a historic seismic gap (Comteet al.1986). The epicentre of the 1985 event is located around the area of the Topocalma knoll (Fig.1c).
The Coastal Cordillera is a trench-parallel province that was formed by the exhumation of a Mesozoic paleomagmatic arc and it overlies the coupled zone of the Nazca-South American subduction interface (e.g. Charrieret al.2007; Herv´eet al.2007). The Coastal Cordillera in central Chile (30◦–34◦S) is composed of Palaeozoic intrusive rocks and metamorphosed remnants of a late Palaeozoic accretionary prism, as well as Jurassic-Triassic intrusive, sedimen- tary and volcanic rocks constituting the primary geologic basement unit of the central Chilean margin (SERNAGEOMIN 2003). Up- lift of the Coastal Cordillera is evidenced by geomorphic aspects as exposed marine terraces and abrasion platforms (e.g. Otaet al.
1995), dune formation and sand barred estuaries of major rivers (Heinze2003), river incision, and uplifted and tilted strandlines (e.g. Charrieret al.2007).
3 S E I S M I C S T RU C T U R E O F T H E C O N T I N E N T A L M A R G I N O F F L O S V I L O S , C E N T R A L C H I L E (∼3 2◦S ) 3.1 Seismic reflection data
Seismic reflection profile P2 was acquired offshore central Chile at
∼32◦S using R/V Sonne in 2000 (Reichertet al.2002). The signals for the seismic reflection experiment were generated by a tuned set of 20 air guns with a total volume of 51.2 L. The multichannel seismic reflection data were analysed using standard processing, including re-binning, normal move out correction, stacking, decon- volution, and post-stack time migration. A predictive deconvolution with two gates, one for the shallow sedimentary events and another for the deeper crustal events, was applied before the stack. A space and time variant frequency filter prior to a post-stack migration completed the processing flow (Reichertet al.2002). The seismic recording system is characterized by a record length of 14332 ms, a sampling rate of 4 ms, and a LC-Filter of 3 Hz. The shoots were triggered in time intervals of 60 s on full minutes UTC. At a speed of 5 knots that results in a shot point distance of 154 m. A constant hydrophone spacing of 25 m (108 channels) was chosen for the seismic processing, resulting in a common mid-point distance of
at Leibniz-Institut fur Meereswissenschaften on September 10, 2015http://gji.oxfordjournals.org/Downloaded from
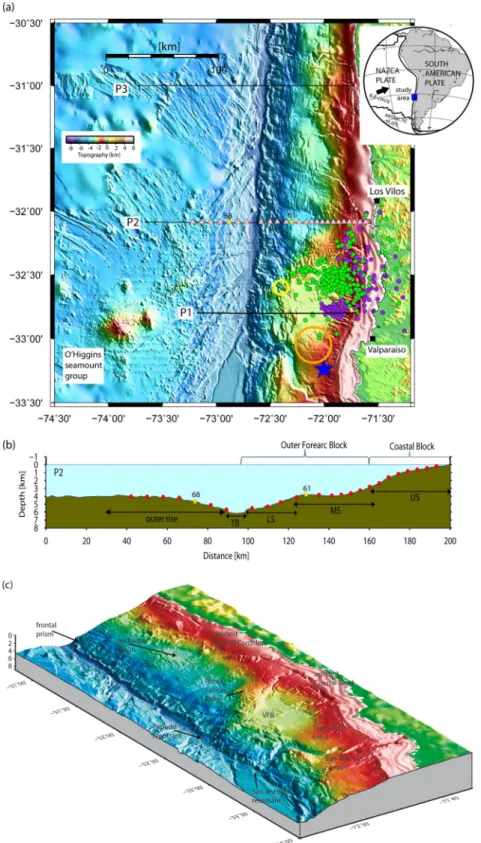
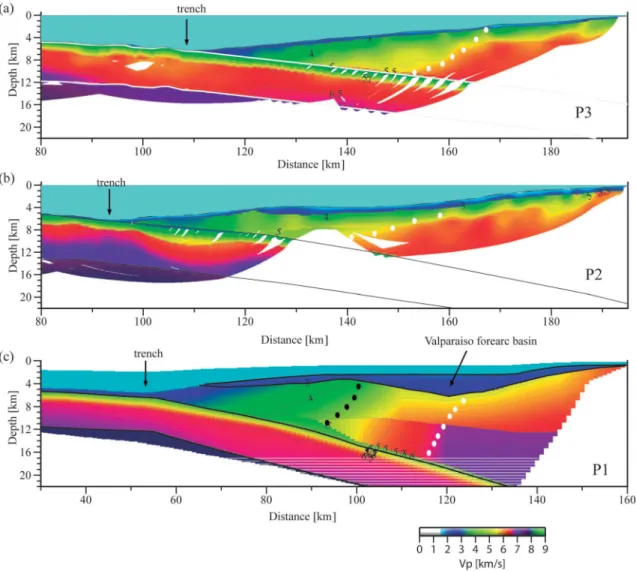
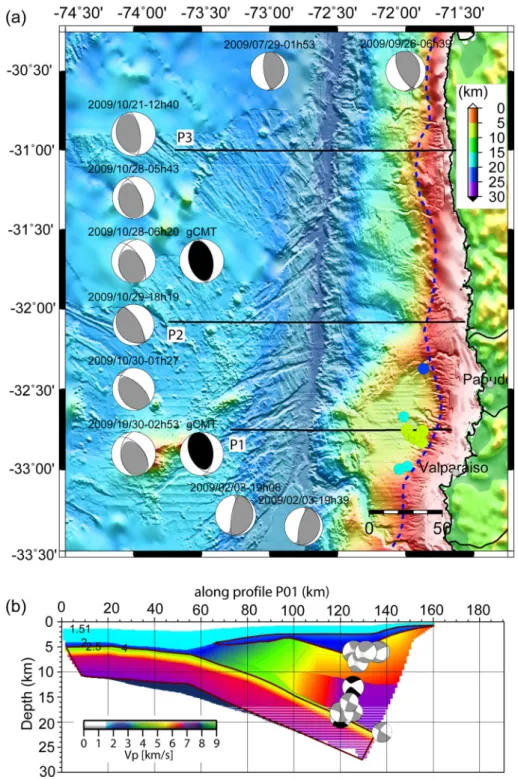
Figure 1.(a) Swath bathymetric image of the seafloor off central Chile. The O’Higgins guyot and seamount correspond to the easternmost portion of the Juan Fern´andez Ridge before the collision with continental South American plate. Black lines denote the wide-angle seismic profiles studied by Contreras-Reyes et al.(2014), P3; Fluehet al.(1998) and Zelt (1999), P1; and this work, P2. Pink triangles correspond to the OBH/S analysed in this study, while the yellow triangles indicate the two stations shown in Fig.4. Yellow and orange open circles denote the location of the subducted Papudo and San Antonio seamounts, respectively, according to the location of magnetic anomalies of Y´a˜nezet al.(2001). Blue star marks the epicentre location of the 1985Ms7.8 earthquake (Comteet al.1986). Green and purple solid circles correspond to the seismicity recorded by the Chilean Seismological Center-Universidad de Chile in December 2008 and March 2009, respectively. (b) Seismic profile P2 and locations of the 26 OBH/OBS stations used in the seismic modelling. TB: Trench Basin, LS: Lower slope, MS: Middle Slope, US: Upper Slope. The Coastal Block corresponds to the seaward part of the Coastal Cordillera. (c) Perspective view of shaded-relief bathymetry off central Chile. Note the high variability in morphology of the continental slope. The uplifted Punta Salinas Ridge is spatially coincident with the landward projection of the JFR. VFB: Valpara´ıso Forearc Basin. The upper slope is characterized by the uplifted continental shelf interpreted to be the seaward extension of the Coastal Cordillera.
at Leibniz-Institut fur Meereswissenschaften on September 10, 2015http://gji.oxfordjournals.org/Downloaded from
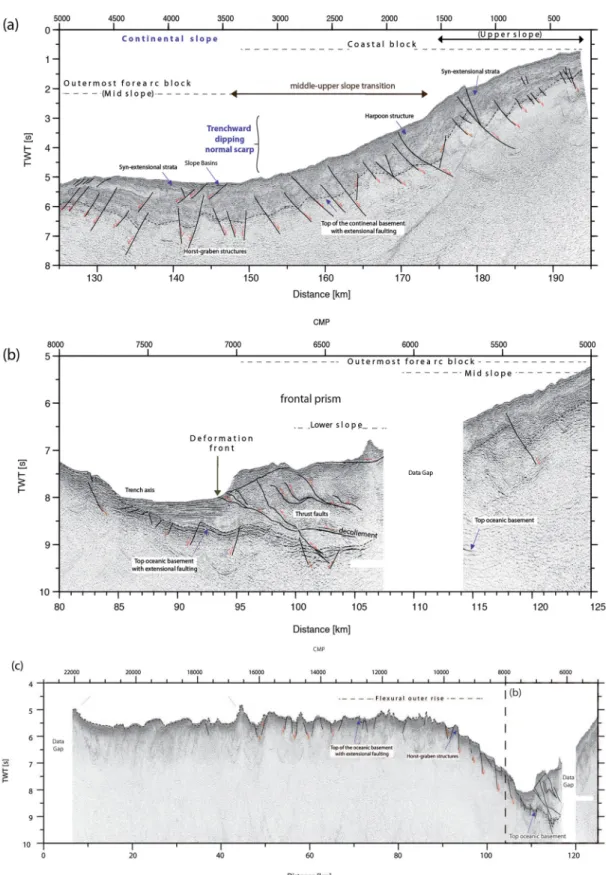
Figure 2. Post-stack time migration of seismic reflection profile P2. (a) Landward part of the overriding plate characterized by the subsidence of the outer forearc and uplift of the landward part of the continental shelf. (b) Trench, deformation front and lower continental slope zones. Thrust faulting is observed within the frontal prism. (c) Uppermost part of the oceanic crust and trench-outer rise areas. Extensional faults and horst-and-graben structures are identified on the rough and highly fractured seafloor.
at Leibniz-Institut fur Meereswissenschaften on September 10, 2015http://gji.oxfordjournals.org/Downloaded from
Figure 3.Post-stack time migration of seismic reflection lines P2 and P3 (see Fig.1a for map location). The deeply submerged lower and middle slope along profile P2 implies that a larger volume of continental rock on P2 has been removed by basal erosion than along P3. Seismic line P2 samples the margin structure near the zone of current ridge-trench collision. Please also note for both lines the uplifted continental shelf belonging to the seaward part of the Coastal Cordillera.
12.5 m and a maximum fold of 27 (Reichertet al.2002). Examples of the seismic reflection lines are shown in Figs2and3.
3.1.1 The upper and middle continental slope domain
The overriding plate is characterized by the presence of exten- sional faults into the slope debris/sediment layer and upper part of the continental crust (Fig.2a). The upper and middle continental slope domain is defined by water depths ranging from 0 to 1000 m, and it forms part of the seaward extension of the uplifted Coastal Cordillera (Contreras-Reyes et al. 2014). In this region, the in- version of several structures is observed. In particular, a Harpoon structure at∼172 km profile is observed and it may be induced by gravitational deformation (Becerraet al., private communication, 2015). Similar features have been observed along seismic reflec- tion profile P3 (see Fig.1for map location) located approximately 100 km to the north (Contreras-Reyeset al.2014). Trenchward of this Harpoon structure, the forearc is characterized by the gravita- tional collapse of the outermost forearc block. Consistently, several syn-extensional faults are mapped along the strata (Fig.2a).
Despite the proximity of lines P2 and P3, they exhibit strikingly different morphology of the upper and middle continental slope transition zone (Fig.3). Along P3, the trenchward transition from the upper to middle slope is defined by an abrupt slope scarp (∼175 km profile) with an offset of>1000 m that is coincident with a Harpoon structure in the landward part of the upper slope (Contreras-Reyes et al.2014). The middle slope has a roughly constant slope (Fig.3a).
In contrast, along P2, the upper-middle continental slope transition zone is characterized by a gentle subsidence of the outermost forearc with a long wavelength of more than 20 km (Fig.3). The middle slope is rather flat due to an anomalous uplift at the trenchward part of the middle continental slope located 30–50 km landward of the trench (Fig.3b). Nonetheless, the offset between the uppermost and middle continental slope is as high as 3400 m suggesting stronger subsidence of the outer forearc along P2 than along P3 (Figs 1b and3).
3.1.2 The lower continental slope domain
The sediment fill at the trench axis is ∼0.9 s [TWT] (∼900 m thick), and most of this material is further subducted along the
at Leibniz-Institut fur Meereswissenschaften on September 10, 2015http://gji.oxfordjournals.org/Downloaded from
subduction channel. Landward of the deformation front, accreted debris are folded and thrusted along small proto-thrusts and form a frontal prism∼10 km wide (Fig.2b). Thrust faults are outlined by prominent landward-dipping reflectors that might represent in- terfaces of tectonic shearing or imbricated structures of kneaded or accreted material (e.g. Laursenet al.2002). The reduced seis- mic velocities found in the frontal prism suggest the presence of disrupted and fractured continental rock at high pore fluid pressure conditions (von Hueneet al.2004; Contreras-Reyeset al.2014).
At∼30–40 km landward of the trench, the local uplift of the conti- nental slope might be related to underplating of accreted sediments or seamount subduction (Fig.3b). According to magnetic anomaly data, however, there is no evidence of a subducted seamount in this particular region (Y´a˜nezet al.2001). Nevertheless, the high popu- lation of small seamounts surrounding the JFR has indeed a major impact in the deformation of the margin in the past- and current ridge-trench collision zone. In particular, lower slope re-entrants, gravitational failure and mass-wasting of the front of the margin are likely direct consequences of the collision and subduction of the broad swell of the JFR (Fig.1c).
3.1.3 The oceanic plate
Seaward of the deformation front, the oceanic crust has a thin pelagic sediment cover of 100–200 m, and the rough morphology of the oceanic igneous basement can be observed both in the multi- beam bathymetry (Fig. 1a) and seismic reflection data (Fig.2c).
The seafloor is characterized by the presence of NW–SE oriented
ridges formed at the East Pacific spreading centre. Fig.1(a) shows that these ridges are cut along bending related faults in the outer rise region prior to subduction. Consequently, a large population of extensional faults and horst-graben structures can be traced in the upper part of the oceanic crust along the seismic reflection line (Fig.2c).
3.2 Wide-angle seismic data
We analysed wide-angle seismic refraction and reflection data that were acquired along profile P2. The data was acquired coincident with the seismic reflection line described in the previous section (Koppet al.2004). Shots were recorded on 26 ocean bottom seis- mometers (OBS) and ocean bottom hydrophones (OBH), covering a total length of∼196 km (Fig.1b). The spacing between the in- struments was approximately 5 km with a sampling rate of 4 ms.
The seismic source was a tuned array of 20 air guns that provided a total volume of 51.2 L, and it was fired at a time interval of 60 s providing an average shot spacing of 154 m. The filter applied, which is minimum delay, is described by four corner frequencies:
Lower stop/pass band boundary and upper/stop band boundary. The frequencies on the filter panel correspond to the upper and lower pass frequencies. As a broad frequency range is contained in the data, time and offset dependent filtering was applied.
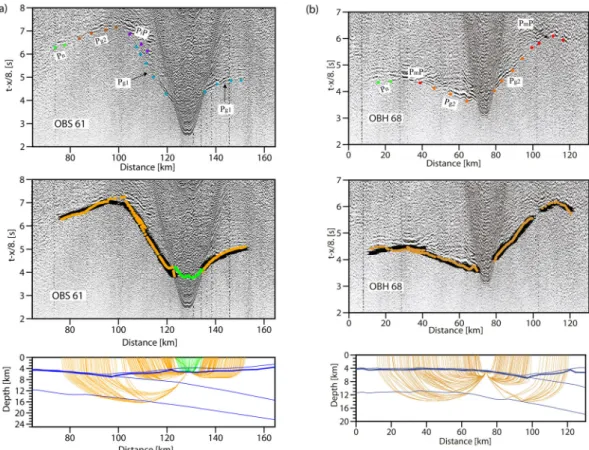
The seismic stations recorded refractions through the overriding plate (Pg1), reflections from the interplate boundary (PiP), oceanic crustal refractions (Pg2), Moho wide-angle reflections (PmP), and upper mantle refractions (Pn) of excellent quality (Fig. 4 and
Figure 4. Examples of wide-angle seismic data with predicted traveltimes (orange circles), which are computed based on the velocity model presented in Fig.5(b). (a) OBS 61 and (b) OBH 68. See more seismic data examples in the Supplementary Material. Green circles denote the predicted traveltimes associated to reflections from the top of the continental basement.
at Leibniz-Institut fur Meereswissenschaften on September 10, 2015http://gji.oxfordjournals.org/Downloaded from
Supporting Information). Fig.4shows an example of record section OBH 68 positioned on the middle-upper continental slope. The data show an abrupt increase of apparentPg1velocities landward from the middle-upper continental slope transition zone, suggesting im- portant lateral variations. The Supplementary Material show more data example supporting this observation.
The traveltimes were then picked manually, and picking errors vary from 50 to 80 ms, depending on the clarity of arrivals. Most instruments exhibit clearPg1 andPg2arrivals, whilePiPandPmP reflections were observed in three and five stations, respectively.
Four stations recorded clearPnphases. In total, 1829Pg1, 932Pg2, 123PiP, 159PmPand 251Pntraveltimes were collected.
3.3 Refraction and reflection traveltime tomography We used the 2-D joint refraction and reflection traveltime tomogra- phy code of Korenagaet al.(2000) to derive the seismic velocity–
depth model. The 2-D velocity–depth model consists of the follow- ing units: (1) water column, (2) slope sediment and overriding crust, (3) oceanic crust and (4) upper oceanic mantle. In order to derive the seismic velocities of the overriding crust, and the geometry of the interplate boundary, we jointly inverted refractingPg1and reflecting PiPphases. The overriding crustal velocities and interplate bound- ary obtained from the tomographic inversion were then held fixed in the following iterative inversions. The oceanic crustal velocities and Moho geometry were inverted usingPg2andPmPphases. Similarly, the oceanic crustal velocities and Moho depths remained fixed for the next step of the inversion, where the upper mantle velocities were derived using oceanicPnphases. The number of iterations to invert the overriding plate velocities and interplate boundary was 10. Five iterations were employed to invert the oceanic crustal velocities and Moho reflector, and upper mantle velocities.
3.3.1 Reference model and inversion parameters
We prepared the reference model for the tomographic inversion by 1-D modelling some OBH/S stations, which we consider as a key to define the general structure of the margin. The 2-D seismic veloci- ties of the reference model are shown in Fig.5(a). This model was calculated by linearly interpolating between the 1-D velocity–depth models. The initial thickness of the sedimentary unit overlying the oceanic and continental crust was obtained by picking and con- verting the vertical incidence reflections from the time migrated seismic reflection data into depths, using an uppermost velocity of 1.7 km s−1and constant velocity gradient of 0.5 s−1.
The horizontal grid spacing of the model used for the velocity inversion is 0.5 km, whereas the vertical grid spacing is varied from 0.1 km at the top of the model to 1 km at the bottom. Depth nodes defining the plate boundary and Moho reflectors are spaced at 2 km.
We used horizontal correlation lengths ranging from 2 km at the top to 10 km at the bottom of the model, and vertical correlation lengths varying from 0.1 km at the top to 2.5 km at the bottom. Different tests showed that varying the correlations lengths by 50 per cent does not significantly affect the solution. Because of the trade-off between correlation lengths and smoothing weights, we tried to use shorter correlation lengths and larger smoothing weights to reduce mem- ory requirements (Korenagaet al.2000; Korenaga & Sager2012;
Sallar`eset al.2013). Depth and velocity nodes are equally weighted in the refraction and reflection traveltime inversions (w=1).
3.3.2 Final and uncertainty velocity models
Tests with several starting models converge to nearly the same final model. In order to study the accuracy of the final model, we em- ployed the Monte Carlo method (Korenagaet al.2000; Korenaga
& Sager2012). The procedure to estimate velocity–depth uncer- tainties consisted of randomly perturbing velocities and reflector depths of our reference model (Fig. 5a). We generated 100 ran- dom initial velocity models by adding randomly distributed smooth perturbations. The 2-D starting velocity models were obtained by adding smooth perturbations randomly distributed (maximum ve- locities perturbations of±0.8 km s−1 at the top and±0.3 km s−1 at the bottom of the model for the overriding and lower plates, re- spectively, with wavelength perturbations of 10 km horizontally and 0.5 vertically). The initial geometry of the interplate boundary was randomly varied within a range of±2 km, except near the trench that is constrained by bathymetric data. The initial geometry of the Moho reflector was randomly varied within a range of±2 km. In ad- dition to the perturbed reference models we produced 100 so called noisy arrival time sets constructed by adding random phase errors (±50 ms) and common receiver errors (±50 ms) to the original data set. Then we performed a tomographic inversion for each velocity model with one noisy data set to estimate not only the dependence of the solution on the reference model but also the effect of phase arrival time picking errors. Fig.5(b) shows the average velocity–
depth model from the 100 final models. The overall traveltime misfit (OTTM) of the final model is 68.4 ms, which was calculated using:
OTTM= NPg1
NT
·TPg1+ NPiP
NT
·TPiP+ NPg2
NT
·TPg2
+ NPmP
NT
·TPmP+ NPn
NT
·TPn
whereNPg1,NPiP,NPg2,NPmP,NPnare the number of picks forPg1, PiP,Pg2,PmP,Pnphases, respectively.NTis the total number of all picks, andTPg1,TPiP,TPg2,TPmP,TPnare they traveltime residuals RMS (root mean square) of the respective seismic phase.
Fig.5(c) shows the Derivative Weight Sum (DWS), a proxy of the ray density. The standard deviation of the calculated velocities (σv) is generally well constrained for the overriding continental crust (Fig.5d). In particular, the velocity-uncertainty model shows in averageσvvalues lower than 0.2 km s−1in the marine forearc.
In the oceanic crust (seaward of the middle continental slope),σv
values are lower than 0.2 km s−1, showing that velocities are well constrained in this region of the model. The average depth uncer- tainties for the top and bottom of the oceanic crust is±0.15 km and
±0.3 km, respectively (Fig.5d). Maximum values of Moho-depth uncertainties are large offshore under the marine forearc where the dip of the subducted plate is unconstrained. Seaward of the trench, clearPmPreflections constrain the Moho depth.
3.4 Results
In the oceanic plate, lower crustal velocities vary between ∼6.8 and ∼7.2 km s−1 while the upper mantle present relatively low velocities of∼7.8 km s−1 beneath the outer rise region (Fig.5b).
The onset of low mantle velocities spatially correlates with the presence of pronounced extensional bend faults and large horst and graben topography seen in the high-resolution seismic reflection and bathymetric data (Fig.2c).
In the continental plate, the 2-D velocity–depth model shows the presence of a∼12 km wide wedge-shaped body, with relative low velocities of 2.0–3.5 km s−1. Landward of this body, velocities
at Leibniz-Institut fur Meereswissenschaften on September 10, 2015http://gji.oxfordjournals.org/Downloaded from
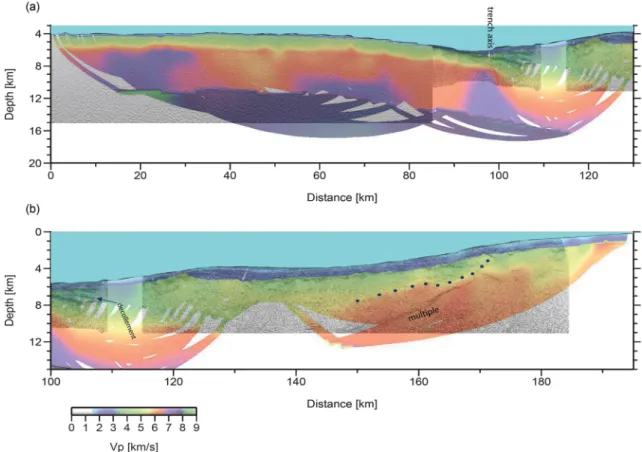
Figure 5. (a) Reference 2-D velocity–depth model. (b) Final tomographic 2-D velocity–depth model obtained by joint refraction and reflection traveltime inversion. The model was masked using all rays associated to the seismic phases used in the inversion (see enlarged figure in the Supplementary Material).
(c) Derivative Weight Sum (DWS) for rays travelling throughout model shown in (b). (d) Velocity and interplate boundary- and Moho-depth uncertainties after Monte Carlo type realizations.
at Leibniz-Institut fur Meereswissenschaften on September 10, 2015http://gji.oxfordjournals.org/Downloaded from
Figure 6.Seismic post-stack depth migration obtained by using the final average 2-D velocity–depth model shown in Fig.5(b). The depth-migrated seismic reflection data overlaps the 2-D velocity–depth model. (a) Lower oceanic plate and frontal part of the overriding plate. (b) The overriding plate is characterized by a reflector that spatially correlates with an abrupt increase of seismic velocities (blue dots) that is interpreted as a master fault that is coincident with the contact between volcanic and igneos/matamorphic rocks.
increase continuously from∼3.5 km s−1up to∼5.0 km s−1within a distance of 50 km (Fig.5b). Between 140 and 150 km along the pro- file (middle-upper slope transition region), a strong lateral velocity gradient is observed as a sharp increase from 5 to 6 km s−1(Fig.6).
This abrupt velocity contrast defines the limit between two seismic units. Similar features have been observed∼100 km to the north and south along wide-angle seismic profile P1 and P3, respectively (see Fig.1for map location). Fig.7shows the direct comparison of the 2-D velocity–depth models across seismic profiles P1, P2 and P3. The origin of the intracrustal seismic discontinuity is discussed in the next section in terms of lithology and subduction erosion processes.
We post-stack depth migrated the seismic reflection line P2 using an iterative depth migration algorithm whereby interval velocities are based on the average final velocity model shown in Fig.5(b).
We extract 1-D velocity–depth profiles from the 2-D velocity model at every trace of the MCS data. Every 1-D velocity–depth profile is then converted to a time-depth function considering an appro- priated depth interval. By interpolation of this time-depth function, we can obtain the depth corresponding to each sample trace. At this stage, the amplitude related to each sample is associated to a depth. Evidently, these depths are not uniformly spaced due to the velocity variations. The amplitude-depth trace is regularized by interpolation, using a small and uniform depth interval for all traces. Finally, the output is converted to a SeismicUnix or SEGY format. The results are plotted on top the 2-D velocity–depth model in order to compare the seismic structures imaged in both data set (Fig.6). The location of the main reflectors imaged by the post- stack depth-migrated seismic record present a good match with the
plate boundary, Moho, top of the continental and oceanic basement obtained from the wide-angle seismic modelling (Fig.6). Also, rel- ative low velocities (<4 km s−1) of the frontal prism correlates with the reflecting pattern associated to underthrusting debris seen in the seismic reflection data. The landward increase of seismic velocities in the overriding continental crust is approximately co- incident with a pronounced seismic reflector imaged by the depth- migrated seismic record (Fig.6).
4 D I S C U S S I O N
4.1 Margin structure margin off Los Vilos, central Chile (∼32◦S)
The margin off Los Vilos is characterized by a narrow trench basin with a maximum sediment layer thickness of ∼900 m (Fig.2).
The seismic reflection data show active thrust faulting below the lowermost continental slope that characterized the ∼12-km-wide wide frontal prism. The frontal prism is spatially coincident with a zone of low velocities ranging from∼2.0 to∼3.5 km s−1 (Figs5 and6).
The lower-middle slope transition zone is characterized by a local uplift with a wavelength of about 20 km. This region is located 20–
40 km landward from the trench and just north of the VFB. A possible explanation for the origin of this uplifted region is the possible subduction of a seamount, which are ubiquitous in the study region. However, the 2-D velocity–depth model shown in Fig.5does not show high velocities typical of basaltic seamounts
at Leibniz-Institut fur Meereswissenschaften on September 10, 2015http://gji.oxfordjournals.org/Downloaded from
Figure 7. Comparison of the 2-D velocity–depth models between profiles (a) P3 (Contreras-Reyeset al.2014), (b) P2 (this work), and (c) P1 (Zelt1999).
White dots correspond to the interpreted location of the crustal discontinuity beneath the fault scarp at the middle-upper transition zone based on the abrupt lateral and landward increase of seismic velocities. In seismic line P1, black dots denote the location of another detected lateral velocity gradient interpreted as the accretionary prism-continental basement (Fluehet al.1998; Zelt1999; Contreras-Reyeset al.2013).
beneath the uplifted region. Moreover, uplifted regions are common along the NC Chilean margin as can be observed further north at the same distance from the trench axis. We find the possibility of parallel subduction of seamounts along a long N–S segment of the margin unlikely. The uplifted region is located just landward of the frontal prism and it presents relative higher velocities than the frontal prism but similar to its surroundings. Another explanation for this local uplift is underplating, that is the basal accretion of eroded material transported through the subduction channel. In addition, syn-extensional faults are imaged into the slope debris/sediment layer above the proposed buried material (Fig.2a).
Seismic velocities increase progressively from∼3.5 at the land- ward edge of the frontal prism to∼5.0 km s−1at the middle-upper slope transition zone (Fig.5b). These velocities were interpreted as volcanic rocks of a Mesozoic magmatic arc that currently form part of the outermost forearc block (Contreras-Reyeset al.2014). It is also likely that these interpreted volcanic rocks present an impor- tant degree of rock fracturation, porosity, and hydration, since this zone is located in the frontal part of the margin at shallow litho- static pressures were subduction erosion is more efficient. Reduced
continental crustal velocities in the frontal part of the margin are a common feature observed along the NC Chile margin (Sallar`es &
Ranero2005; Koulakovet al.2011; Kopp2013; Contreras-Reyes et al.2014). Despite the local uplift around profile km 120, the entire outermost forearc is subsided with respect to the uplifted Coastal Block at the upper continental slope with a total vertical offset of
∼3400 m. This suggests that important long-term subsidence and crustal thinning of the outermost forearc crust has been caused by strong subduction erosion.
Landward of the outermost forearc block, seismic velocities in- crease abruptly to values of 6.0–6.5 km s−1 that were interpreted as the continental basement composed by metamorphic and ig- neous rocks of the Coastal Cordillera that are much less fractured than the outermost forearc crust (Contreras-Reyeset al.2014). In the upper continental slope domain, a large number of extensional landward dipping faults cut the basement and slope sediment se- quences (Fig.2a). Nevertheless, the presence of inverted Harpoon structure implies that thrust faults are also present and hence there is coexistence of normal and reverse faults in the seaward part of the Coastal Cordillera.
at Leibniz-Institut fur Meereswissenschaften on September 10, 2015http://gji.oxfordjournals.org/Downloaded from
4.2 Characterization of the margin structure of the central Chile margin (31◦–33◦S)
At the trench and north of the Papudo seamount subduction (Fig.1), sediment thickness ranges between 100 and 1000 m, and the trench basin is narrow (<10 km wide) due to the negligible sedimentation from the continent and by little sediment transportation from the south blocked by the topography of the JFR. Thus, the little sedi- mented trench has favoured subduction erosion, and it was likely accelerated by the southward migration of the JFR being strongest at the quasi stationary current collision zone at 32◦–33◦S. At the lowermost continental slope, a small frontal prism of 5–10 km width composed of eroded material from the upper plate lies at the seawardmost part of the margin. In contrast, south of the Papudo seamount subduction, the trench fill becomes thicker (>1000 m thick) and a large frontal accretionary prism∼30 km wide has been reported (Fluehet al.1998; Zelt1999; Contreras-Reyeset al.2013).
Apparently, this frontal accretionary prism has not been intensively removed by the JFR subduction. Furthermore, south of the subduct- ing JFR, tectonic erosion ceased∼5 Myr ago due to the reduction of the convergence rate, and increase in trench sedimentation caused by denudation of the Cordillera, and sediment transport via subma- rine canyons (e.g. Kukowski & Oncken2006). In fact, the westward trench migration south of the JFR (Fig.1c) reveals that frontal ac- cretion processes have facilitated the formation of a large frontal accretionary prism.
North of the VFB, the continental slope is narrow, steepened and it lacks the presence of large submarine forearc basins. The lower and middle continental slopes are abruptly and deeply submerged with respect to the upper continental slope, suggesting margin-wide
subsidence. At 32◦–33◦S, however, the morphology of the continen- tal slope is disturbed by the collision of the JFR with the margin.
The formation of the VFB is attributed to the subsidence caused by basal erosion triggered by the JFR subduction since∼10 Ma in this region (Y´a˜nezet al.2001; Laursenet al.2002). The VFB is located landward of the frontal prism with high crustal velocities of 5.0–6.0 km s−1that are interpreted as part of the continental frame- work made of volcanic-metamorphic rocks (Fig.8). The stability of the VFB is consistent with its location above the continental crust. However, if the formation of this shelf basin is related to the subsidence of the margin caused by basal erosion and enhanced by the subducting JFR (Laursenet al.2002), then subduction erosion has to occur at large depths (deeper than 15 km according to the 2-D velocity–depth models shown in Fig.7). South of the JFR, the overall margin has maintained a broad shelf and a gently seaward dipping continental slope and a relatively wide frontal accretionary prism (Contreras-Reyeset al.2013).
High-resolution seismic and bathymetric data show the presence of a prominent scarp at the transition from the middle to upper con- tinental slope with offsets ranging from a few hundred meters to up to 2 km height along the NC Chilean margin. Despite the formation of the VFB, the continental slope scarp remains, and it defines the landward flank of the VFB. We propose that the fault scarp located at the middle-upper slope transition zone is the surface expression of a major normal crustal fault of kilometre-scale along strike. The 2-D velocity–depth models show this seismic discontinuity at lat- itudes∼31◦S,∼32◦S, and∼33◦S (Fig.5), while several seismic reflection lines located between 30◦S and 33◦S show the presence of the prominent fault scarp at the middle-upper continental slope transition zone (Becerraet al., private communication, 2015).
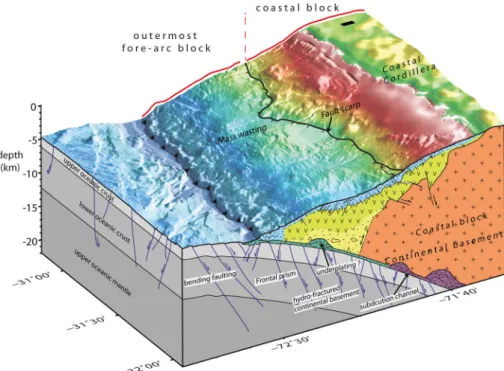
Figure 8.A schematic model for the structure and tectonics of the central Chile margin based on the 2-D seismic velocities along profile P2 and P3 (vertical exaggeration 2:1). The toe of the margin presents a small frontal prism made of debris material that is undergoing thrusting. The outermost forearc block is composed of eroded and fractured volcanic rocks as a consequence of subduction erosion caused by the subduction of high-relief horst and graben features poorly lubricated by sediment and hosted by the oceanic Nazca plate. Subduction erosion results in the collapse of the outermost forearc block and long-term subsidence. Landward of the middle-upper continental slope, the Costal Block is composed of igneous and metamorphic rocks that form part of the uplifted Coastal Cordillera. Please also note the mass wasting events just westwards of the continental fault scarp. The margin is undergoing frontal erosion at the lowermost continental slope, while the middle-slope is affected by basal erosion. Basal accretion or underplating of the eroded material beneath the Coastal Cordillera has been proposed (e.g. Metcalf & Kapp2015).
at Leibniz-Institut fur Meereswissenschaften on September 10, 2015http://gji.oxfordjournals.org/Downloaded from
At 170–180 km along profile P2, the seismic reflection data show some evidence for positive inversion tectonics of landward dipping faults (see Harpoon structure in Fig.2a). This internal contractional state would be explained by gravitational deformation at the con- tinental slope. The marked slope contrast between the upper and middle slope triggered trenchward mass translation inducing local shortening into the landward dipping faults. Local contractional features are also clearly seen at the landward part of seismic line P3 (see Harpoon structure in Fig.3a,∼31◦S). There is no clear re- ported contractional structure at the landward flank of the VFB (e.g.
Laursenet al.2002). In Section 4.3, however, we present focal me- chanics showing shallow thrust events concentrated at the landward edge of the VFB, suggesting active compressional faulting.
4.3 Crustal seismicity 4.3.1 Shallow crustal seismicity
In NC Chile, clustered seismicity is commonly triggered by the subduction of the JFR, and hypocentre data typically show thrust interplate events (e.g. Pardo et al.2002; Anderson et al.2007).
In contrast, shallow seismicity is rarely documented due to the lack of a dense local seismological network able to record such events. Between December 2008 and March 2009, the Servicio Sismol´ogico Nacional (SSN) of the Universidad de Chile, recorded clustered seismicity at the landward edge of the VFB (Fig.9a) at depths <10 km. Interestingly, the seismicity is located near the proposed slope scarp across the middle-upper transition zone of the VFB. This information affords the opportunity to clearly distinguish upper-plate seismicity from interplate seismicity when compared for instance with 2-D velocity–depth models imaging the interplate boundary.
Given the scarce distribution of local seismological stations it is rather challenging to precisely determine focal depths. As an al- ternative strategy to precise source depth estimation and its source mechanism one can compute the best centroid depth via the inver- sion of regional moment tensors using broadband data. To do so, we have selected events with magnitude greater than 4.7 from the SSN seismic catalogue located in the study area (Fig.1) that have occurred in 2009. For each of these events we have downloaded regional broadband record data from the National Earthquake In- formation Center (NEIC), which are available through the Global Seismographic Network (GSN), and the Incorporated Research In- stitutions for Seismology (IRIS) Data Management Center.
We select broad-band records having a good quality in terms of signal-to-noise ratios, and we invert in the time-domain the regional moment tensor using a linear least square algorithm. The TDMT (Time-Domain Moment Tensor) code (e.g. Pasyanoset al.1996;
Dreger 2003) allows retrieving the seismic moment tensor from regional broadband waveforms and to estimate the centroid depth by choosing the best fitting model when iterating every 2 km depth over a broad source range. Data and synthetics are filtered in a common frequency band, which is chosen according to the event magnitude (see supplementary material).
Fig.9summarizes the regional moment tensors computed to im- prove data quality. Two of our solutions agree well with the only moment tensor solutions available at the GCMT (Global Centroid Moment Tensor) catalogue, for the same period and region studied in this work (Fig.9b). The differences are in the centroid depths, where the ones estimated at teleseismic distances present larger uncertain- ties than those computed at regional distances. This supports that
our inverted regional moment tensors provide reasonable solutions in terms of source mechanism, and centroid depth. The solutions show two distinguishable event groups. A first set characterized by inverse faulting with low dipping angle, and centroid locations lo- cated at depths of about 18–22 km that coincide reasonably well with the interface between the Nazca and South American plates (Fig.9). In the second group, inverse intraplate faulting events dom- inate, striking 20◦NW, with shallow source depths (6–8 km). The trench-perpendicular profile in Fig.9(b) clearly separates the two groups at depth: we associate the group linked to the focal mech- anism to faulting occurring offshore∼32.75◦S in the upper crust of the continental plate. The other group likely represents events occurring on the megathrust.
4.3.2 Interplay between continental crustal faults and intraplate seismicity
The more frequent occurrence of earthquakes in the VFB region may be associated to the stress transfer from the subducting seamounts such as San Antonio and Papudo to the overlying forearc (Fig.1).
However, shallow crustal seismicity observed near the coast has also largely been observed off southern Chile (Haberlandet al.2006;
Langeet al.2007; Dziermaet al.2012) in regions where subduct- ing seamounts are absent. Alternatively, it may be attributed to the presence of crustal faulting defining the contact between a paleo- accretionary prism against the continental metamorphic basement (paleo-backstop) (Contreras-Reyeset al.2013). The shallow crustal seismicity seen at the landward edge of the VFB (Fig.9) is spatially coincident with the faults scarp located at the contact between the subsided outermost forearc and uplifted Coastal Cordillera. Hence the activity of our proposed intracrustal fault system is likely man- ifested in the shallow seismicity observed here.
The focal mechanisms show that the recorded events of magni- tude between 4 and 5 are thrust type in agreement with the inverted faults seen in the seismic reflection data along seismic profiles P2 and P3 (Figs2and3). Laursenet al.(2002) also reported contrac- tional structures along the VFB. In contrast, most of the mapped faults trenchward of the fault scarp are normal faults in agree- ment with the gravitational collapse of the outermost forearc block enhanced by subduction erosion. Possibly the major master fault defining the landward edge of the outermost forearc has a bimodal behaviour as has been suggested by Delouiset al.(1998) off north Chile at∼23◦S and Far´ıaset al.(2011) for the Pichilemu faults off Maule, central Chile at∼34◦S. In particular, the Pichilemu fault ruptured 12 days after the 2010Mw 8.8 megathrust earthquake in a sequence of normal events of magnitudes up toMw 7.0 (Ruiz et al.2014). Far´ıas et al.(2011) proposed that during the inter- seismic period of megathrust earthquakes, intracrustal faults load elastically and behave as inverse faults as is documented for the VFB sequence (Fig. 9). In contrast, during the coseismic period of megathrust earthquakes, the Pichilemu fault behaves as a nor- mal fault. Similar conclusions have been inferred from geological studies performed in north Chile (20◦–24◦S) where normal faults in the coastal region have been reactivated as a consequence of large subduction earthquakes (Delouiset al.1998; Gonz´alezet al.
2003; Lovelesset al.2010), which has been explained as coseis- mic extension followed by interseismic compression (Delouiset al.
1998).
Delouiset al.(1998) proposed that the amount of extension pro- duced by subduction earthquakes in the Coastal Block is larger than the cumulative interseismic contraction. The extension in the coast
at Leibniz-Institut fur Meereswissenschaften on September 10, 2015http://gji.oxfordjournals.org/Downloaded from
Figure 9.Regional seismic moment tensors modelled in this study for the shallow crustal events located at the landward flank of the VFB. (a) High-resolution bathymetric map and spatial distribution of all regional moment tensor solutions computed in this study, where coloured circles correspond to its epicentre locations. The colour bar represents the best source depth (centroid) estimated from the inversion. Coloured black moment tensors are the ones from the GCMT catalogue. Dotted blue curve corresponds to the interpreted boundary between the subsided outermost forearc block and the Coastal Cordillera (fault scarp curve). (b) Cross-section along profile P01 shows the best source depth estimated in this study. Brown line is the top of the oceanic subducting slab, purple dashed line is the Moho discontinuity, blue solid line is the bathymetry obtained from the 2-D velocity–depth model of Zelt (1999).
accumulates over repeated subduction seismic cycles and leads to large tensional earthquakes as was the case for the Pichilemu event off Maule (Far´ıaset al.2011; Ruizet al.2014; Aronet al.2014).
Similar extension in the forearc following a megathrust earthquake has been reported for the cases of the 1960 south Chile (Plafker 1967) and Tohoku megathrust earthquakes (e.g. Mizoguchiet al.
2012; Katoet al.2013). During the interseismic period of megath-
rust earthquakes, the deviatoric extension along the normal crustal fault is reduced and aseismic behaviour in the interseismic period has been observed by seismological studies performed in north Chile, indicating an absence of shallow crustal seismicity (Delouis et al.1998). However, our results show the presence of a sequence
of>50 events withMw =4–5 at shallow depths suggesting that
this type of seismicity should also be considered for assessment of
at Leibniz-Institut fur Meereswissenschaften on September 10, 2015http://gji.oxfordjournals.org/Downloaded from
the seismic hazard of the coastal region. Although the seismologi- cal data presented here are only a snapshot in the seismic cycle of subduction megathrust earthquakes, our accurate location estimates and the density of shallow crustal seismicity correlate well with the proposed faults in the study area.
The contractional features are essentially related to the trench- ward dipping faults, suggesting a gravitational deformation. At the VFB domain, fault rupture was revealed by the contractional fo- cal mechanisms occurred at the upper portion of the upper slope suggesting that the gravitational deformation is an active process.
The translation of mass rock down slope could be induced by the strong slope contrast (slope tectonic induced structures) on the strong velocity gradient between the upper and middle continen- tal slope. Furthermore, these gravitational flows are often triggered by short-term events as earthquakes (Morleyet al.2011). However, the tectonic-induced structures on the slope are related to large-scale mass wasting processes (subduction erosion) and/or the dynamics of critical tectonic wedges.
5 S U M M A RY
Along the NC Chile trench and north of the JFR subduction (31◦– 32.5◦S),<1 km of slope debris fills the trench and a small fraction of this sediment unit accretes to form a frontal prism∼5–10 km wide. Most of the slope debris is subsequently subducted accord- ing to the shallow location of the decollement seen in the seismic reflection lines. Subduction of the JFR and high relief horst-and- graben structures erode frontally and basally the margin resulting in the collapse of the seaward part of the overriding plate. South of the JFR subduction, a relatively large frontal accretionary prism
∼30 km wide has been formed in a region where the trench carries 1–2 km thick sediments.
The structure of the erosive NC Chilean margin (north of the JFR subduction) is characterized by the presence of a subsided/collapsed outermost forearc material composed of highly fractured volcanic rocks. Its landward edge is located at the middle-upper continental slope transition zone, which is defined by a continental slope scarp of variable height ranging from a few hundred metres up to 2000 m height. The slope scarp underlies a zone with a high lateral velocity gradient suggesting a fundamental lithological and/or rheological change of the continental basement. The slope scarp and crustal discontinuity are also observed south of the JFR subduction.
Landward of the middle-upper continental slope transition zone, seismic velocities increase abruptly and are consistent with meta- morphic/igneous rocks less fractured that are interpreted as the seaward part of the uplifted Coastal Cordillera (Coastal Block).
In this region, most of the structures are extensional faults and might be related to forearc uplift driven by underplating and/or by the accumulative elastic rebound during the earthquake cycle.
In summary, the long-term deformation of the marine forearc is characterized by vertical uplift of the Coastal Block and subsidence of the outermost forearc block related to normal faulting. However, inverted reverse faults are also observed in high-resolution seis- mic reflection data as well as from derived focal mechanisms of shallow events. In fact, at the landward edge of the VFB, shallow thrust events coincide with the proposed intra-crustal fault system located at the landward edge of the VFB. These thrust events are interpreted to be caused by the short-term interseismic contraction triggered by the locking of the subduction thrust interface, and hence the state of stress of the forearc depends partially on the subduction
seismic cycle. Alternatively, the selective reactivation of landward extensional faults as well as the presence of trenchward verging anticlines and contractional faults denote local internal compres- sional stresses, which could be related to trenchward gravitational flows.
A C K N O W L E D G E M E N T S
This work was supported by the Chilean National Science Foun- dation (FONDECYT) project 1130004. Juan Becerra gratefully acknowledges a scholarship granted by the Chilean National Sci- ence Cooperation (CONICYT). We thank Donna Shillington, Manel Prada, Adri`a Mel´endez, and the Editor Jun Korenaga for in-depth reviews of the manuscript.
R E F E R E N C E S
Anderson, M., Alvarado, P., Zandt, G. & Beck, S., 2007. Geometry and brittle deformation of the subducting Nazca Plate, Central Chile and Argentina, Geophys. J. Int.,171,419–434.
Aron, F., Cembrano, J., Astudillo, F., Allmendinger, R.W. & Arancibia, G., 2014. Constructing forearc architecture over megathrust seismic cycles:
geological snapshots from the Maule earthquake region, Chile,Bull. geol.
Soc. Am.,127(3–4), 464–479.
Charrier, R., Pinto, L. & Rodrguez, M.P., 2007. Tectono-stratigraphic evolu- tion of the andean orogen Chile, inGeology of Chile, Special Publication, pp. 21–116. eds Gibbons, W. & Moreno, T., The Geological Society.
Clift, P. & Vannucchi, P., 2004. Controls on tectonic accretion versus erosion in subduction zones: implications for the origin and recycling of the con- tinental crust,Rev. Geophys.,42,RG2001, doi:10.1029/2003RG000127.
Comte, D., Eisenberg, A., Lorca, E., Pardo, M., Ponce, L., Saragoni, R., Singh, K. & Su´arez, G., 1986. The 1985 central Chile earthquake:
a repeat of previous great earthquakes in the region?, Science, 233, 449–453.
Contreras-Reyes, E., Jara, J., Maksymowicz, A. & Weinrebe, W., 2013. Sed- iment loading at the southern Chile trench and its tectonic implications, J. Geodyn.,66,134–145.
Contreras-Reyes, E., Becerra, J., Kopp, H., Reichert, C. & Daz-Naveas, J., 2014. Seismic structure of the north-central Chilean convergent margin:
Subduction erosion of a paleomagmatic arc,Geophys. Res. Lett.,41, 1523–1529.
Delouis, B., Philip, H., Dorbath, L. & Cisternas, A., 1998. Recent crustal deformation in the Antofagasta region (northern Chile) and the subduction process,Geophys. J. Int.,132(2), 302–338.
Dreger, D.S., 2003. TDMT INV: Time Domain Seismic Moment Tensor INVersion, inInternational Handbook of Earthquake and Engineering Seismology,Vol. 81B, p. 1627, eds Lee, W.H.K, Kanamori, H., Jennings, P. & Kisslinger, C., Academic Press.
Dzierma, Y., Thorwart, M., Rabbel, W., Siegmund, C., Comte, D., Bataille, K., Iglesia, P. & Prezzi, C., 2012. Seismicity near the slip maximum of the 1960 Mw 9.5 Valdivia earthquake (Chile): plate interface lock and active faults within the crust and subducted slab,J. geophys. Res.,117, B06312, doi:10.1029/2011JB008914.
Far´ıas, M., Comte, D., Roecker, S., Carrizo, D. & Pardo, M., 2011.
Crustal extensional faulting triggered by the 2010 Chilean earth- quake: the Pichilemu Seismic Sequence, Tectonics,30, TC6010, doi:
10.1029/2011TC002888.
Flueh, E.R.et al., 1998. Seismic investigation of the continental margin off- and onshore Valparaso, Chile,Tectonophysics,288,251–263.
Gonz´alez, G., Cembrano, J., Carrizo, D., Macci, A. & Schneider, H., 2003.
The link between forearc tectonics and Pliocene-Quaternary deformation of the Coastal Cordillera, northern Chile,J. South Am. Earth Sciences, 16(5), 321–342.
Haberland, C., Rietbrock, A., Lange, D., Bataille, K. & Hofmann, S., 2006.
Interaction between forearc and oceanic plate at the south-central Chilean
at Leibniz-Institut fur Meereswissenschaften on September 10, 2015http://gji.oxfordjournals.org/Downloaded from