1
QUALITY-OF-SERVICE-AWARE SERVICE SELECTION: A NOVEL APPROACH CONSIDERING POTENTIAL SERVICE FAILURES AND NON-DETERMINISTIC
SERVICE VALUES
Authors:
Bernd Heinrich, Mathias Klier, Lars Lewerenz
Department of Management Information Systems, University of Regensburg, D-93053 Regensburg, Germany
bernd.heinrich@wiwi.uni-regensburg.de, mathias.klier@wiwi.uni-regensburg.de, lars.lewerenz@wiwi.uni-regensburg.de
Steffen Zimmermann
Department of Information Systems, Production and Logistics Management, University of Innsbruck, A-6020 Innsbruck, Austria
steffen.zimmermann@uibk.ac.at
Citation: Bernd Heinrich, Mathias Klier, Lars Lewerenz, Steffen Zimmermann (2015) Quality-of-Service-Aware Service Selection: A Novel Approach Considering Potential Service Failures and Nondeterministic Service Values. Service Science 7(1):48-69.
http://dx.doi.org/10.1287/serv.2015.0093
(http://pubsonline.informs.org/doi/abs/10.1287/serv.2015.0093)
QUALITY-OF-SERVICE-AWARE SERVICE SELECTION: A NOVEL APPROACH CONSIDERING POTENTIAL SERVICE FAILURES AND NON-DETERMINISTIC
SERVICE VALUES
ABSTRACT
In service oriented systems, a variety of loosely coupled services are composed to support the execution of processes. One important research question in this context is, how such services can be selected by taking into account the values for the corresponding quality-of-service (QoS) attributes. Existing QoS-aware ex-ante service selection approaches build on preferences and requirements for the QoS attributes and evaluate the available services by means of a utility value. Due to many reasons like software bugs, high server workload or network failures an ex- ante optimal service may temporarily be unavailable or fail during its execution, requiring re- planning. Moreover, several QoS attribute values may be stochastic rather than deterministic.
Thus, both the ex-post realized QoS values and the corresponding utility may significantly differ from the ex-ante computed ones, incurring a substantial loss of resources. In this paper we present a novel approach for the QoS-aware service selection considering both the effects of potential service failures and non-deterministic QoS values ex-ante. The approach is founded on an expected utility calculus. We find that considering the effects of potential service failures and non-deterministic QoS values leads to substantially better decisions in QoS-aware service selection.
Keywords: QoS-aware service selection, IT services, service failures
3
INTRODUCTION
The service oriented architecture (SOA) paradigm has attracted much interest in the last decade.
According to Forrester (2010) 84% of the global 2000 enterprises (Forbes 2010) currently use SOA and 70% of the SOA users plan to expand its use as a result of the perceived benefits. At the same time, the service market has taken a significant development. The service infomediary ProgrammableWeb, for instance, grew at an average annual rate of 161% between 2005 and 2014. Today, over 12,000 services from various categories (e.g. financial, enterprise, e-commerce, travel, government, etc.) are listed within the directory of ProgrammableWeb. The platform AppExchange by Salesforce offers over 1,100 services that can be integrated directly within the customers’ CRM processes on Sales Cloud (cf. Weinhardt et al. 2011). The realization of SOA through the standardized technology of (web) services (Alrifai et al. 2012) as well as its characteristics (loose coupling, dynamic binding, open standards, simplicity, and security) (Erl 2009) open up the possibility of versatile and flexible ad-hoc collaborations between different business partners (Luthria and Rabhi 2009; Ren and Lyytinen 2008). Companies can use a service, for instance, to verify and correct customer addresses during their order processes (cf.
Informatica 2014). Moreover, the standardized interfaces of services do not only allow for the realization of single functionalities through single services but also enable the composition of several services (Alrifai et al. 2012; Ardagna and Pernici 2007). Such service compositions can realize more complex functionalities through to whole business processes (e.g. the PayPal service composed with the DocuSign service allows users to sign documents and collect payments at the same time (DocuSign 2014)) (cf. AbuJarour and Awad 2014; Medjahed et al.
2014; Moghadda and Davis 2014; Weise et al. 2014). For instance, Weinhardt et al. (2011) discuss an online payment process where each process activity (e.g. validate customer data, payment transaction, and customer data storage) is realized by a service (e.g. Informatica – validate customer data, CyberSource – payment transaction, and Amazon – data storage). In the
course of a growing service market more and more functional equivalent services are provided (e.g. credit card validation, flight booking, hotel search, online payment, communication, etc.) which, however, differ in their so called quality-of-service (QoS) attributes such as availability, response time, or price. For instance, to verify customer data the service market comprises several services by different providers (e.g. ServiceObjects, CDYNE, Informatica, and PostcodeAnywhere). All of them provide the same functionality but each with different values for the QoS attributes1. Under the premise that the service market keeps on growing, the challenge will not only be to find services that realize the required functionalities but also to select the best services out of functional equivalent services while considering their QoS values (Kritikos et al. 2014; Zeng et al. 2004). This results in an optimization problem which has to consider the following two aspects: First, the best service composition (i.e. the one with the highest utility) regarding the QoS values of the included services has to be selected. Second, the QoS values of this service composition need to satisfy given QoS requirements (e.g. an upper limit regarding the end-to-end response time of the service composition).
In literature this optimization problem is widely known as QoS-aware service selection which aims at determining the optimal service composition ex-ante (i.e. before starting to execute the services). Several approaches have been proposed to address this problem (Alrifai et al. 2012;
Ardagna and Pernici 2007; Canfora and Di Penta et al. 2005; Yu et al. 2007; Zeng et al. 2004;
Zheng and Xiong 2012). However, during the runtime of the process there are situations where an ex-ante selected service candidate is not available (i.e. the execution of a service candidate fails). These runtime failures may result from, notably, communication infrastructure exceptions, failures in the operation in the middleware, server overload, or incorrect input parameter types
1 For instance, with respect to price per call (per August 2, 2014): ServiceObjects: $ 0.079; CDYNE: $ 0.035;
Informatica AddressDoctor: $ 0.50; PostcodeAnywhere: $ 0.08.
5
(cf. Chan et al. 2007). Service failures require the re-planning of the service composition during the runtime of the process (cf. Canfora et al. 2008; Lin et al. 2010; Zeng et al. 2004) in order to ensure that the process can still be executed. Besides service failures, there are also situations where the QoS values realized during the runtime of the process deviate from those planned ex- ante. These deviations result from the fact that several QoS values are not deterministic but rather stochastic over time (Fakhfakh et al. 2012; Hwang et al. 2007; Stein et al. 2009). Existing approaches, however, neither consider potential service failures nor non-deterministic QoS values in the QoS-aware ex-ante service selection which lead to the following effects:
Due to re-planning, the QoS values realized ex-post and thus, the realized utility of a service composition, may significantly differ from the ex-ante planned ones (Canfora et al. 2008).
This effect occurs, for instance, when service candidates fail and have to be replaced by other service candidates with different QoS values (e.g. execution price or response time).
In case of re-planning, the feasibility of service compositions regarding the given QoS requirements may be affected as a result of the hitherto realized QoS values.
It takes a certain time for the failure of a service to be noticed and compensated, which is comparable to the time-to-repair (Hwang et al. 2007; Mani and Nagarajan 2002; Maximilien and Singh 2004). This time interval has a direct influence on the end-to-end response time and thus on the utility of the affected service composition.
In case of a service failure and a re-planning that switches to an alternative service composition, losses can occur if services that have already been executed are not part of the alternative service composition. These losses directly influence the end-to-end QoS values and thus the utility of the service composition.
In case of non-deterministic QoS values the realized utility can significantly differ from the ex-ante planned one. Deviations of QoS values can cause higher consumptions than expected
with respect to QoS attributes and even violations of QoS requirements (e.g. due to outliers) during the runtime of the service composition (Berbner et al. 2007; Canfora et al. 2008).
As a result of the effects - the optimal ex-ante selected service composition may significantly differ from the optimal ex-post one after process execution. Neglecting these effects in the QoS-aware ex-ante service selection may cause an unnecessary waste of resources (e.g.
time and money) and may prevent the process from being executed under the given conditions (cf. QoS requirements).
Hence, we propose a novel approach for the QoS-aware ex-ante service selection where both the effects of potential service failures (effects -) and non-deterministic QoS values (effect ) are considered ex-ante. We find that considering these effects usually leads to better decisions.
Thus, the proposed approach can help save resources and allows for a better QoS-aware ex-ante service selection compared to existing approaches.
The paper is structured as follows: The next section discusses the literature related to the QoS- aware ex-ante service selection problem. Afterwards, we introduce a running example (according to Canfora et al. 2008) that is used to illustrate the problem of the QoS-aware ex-ante service selection as well as for evaluation purposes later on. In the third section, our approach is presented in two steps. First, we propose an analytical model to consider the effects -. In the second step, taking effect into account, we present a simulation model. To point out the strength of our approach compared to existing approaches, we provide a mathematical evaluation in the fourth section. In addition, the applicability and the benefits of our approach are demonstrated by means of an example. Finally, we conclude with a discussion of important limitations and an outlook on future research.
7
RELATED LITERATURE
Our research directly contributes to the literature on (1) QoS-aware ex-ante service selection and is related to the literature on (2) QoS-aware fault tolerant strategy selection and on (3) QoS- aware re-planning of service compositions.
The literature on (1) aims at determining the optimal QoS-aware service composition ex-ante and comprises several analytical (cf. Ardagna and Pernici 2007; Cui et al. 2011; Huang et al. 2009;
Yu et al. 2007; Zeng et al. 2004) and heuristic approaches (cf. Alrifai et al. 2012; Ardagna and Mirandola 2010; Berbner et al. 2006; Canfora and Di Penta et al. 2005; Canfora et al. 2008;
Jaeger and Muehl 2007; Li and Yan-xiang 2012; Maolin and Ai 2010; Menascé et al. 2008;
Yang et al. 2010; Yu et al. 2007; Zheng and Xiong 2012)0F2. The QoS-aware ex-ante service selection is realized either by a local or a global optimization. Within the local optimization, the utility of a single service candidate is calculated based on its values for the QoS attributes. To determine the optimal QoS-aware service composition, exactly one service candidate per service class1F3 is selected that has the highest utility value and satisfies the local QoS requirements (Alrifai et al. 2012; Zeng et al. 2004). Concerning the global optimization, the values of each QoS attribute are first aggregated for a specific service composition (end-to-end QoS value) and finally weighted to calculate an overall utility value for this service composition (Ardagna and Pernici 2007; Canfora et al. 2008; Yu et al. 2007). To conduct the local or global optimization, in most cases (Alrifai et al. 2012; Ardagna and Pernici 2007; Zeng et al. 2004) Multiple Criteria Decision Making (Hwang and Yoon 1981) is applied to determine the optimal QoS-aware
2A detailed discussion of these approaches can be made available by the authors upon request.
3A service class is defined as a set of services that offer the same functionality but may differ in their QoS values.
service composition while satisfying the (local or global) QoS requirements.
In all of these QoS-aware selection approaches potential service failures are only considered by the QoS attribute availability. Aggregating the availabilities of the single service candidates included in a service composition the availability of the whole service composition is obtained.
Finally, this end-to-end QoS value is used in combination with the other end-to-end QoS attribute values (e.g. response time or price) to determine the utility of the service composition.
However, representing service failures solely by the QoS attribute availability ignores their effects - on other QoS attributes such as response time, and thus on the utility of a service composition. Hence, a special treatment of potential service failures is required. We contribute to the literature on QoS-aware ex-ante service selection by considering the effects of potential service failures in combination with the effect of non-deterministic QoS values.
The approaches on (2) aim to select the optimal QoS-aware fault tolerant strategy for the execution of service candidates (Stein et al. 2009; Zheng and Lyu 2010). For instance, Zheng and Lyu (2010) propose strategies to either retry the execution of the failed service candidate for a predefined number of times (retry), to execute different service candidates in sequential order if the primary service candidate fails (round robin), or to execute functional equivalent service candidates in parallel (active). Based on the selected strategy they either obtain lower execution costs with a higher response time or vice versa. Stein et al. (2009) propose quite similar strategies including a parallel and a sequential strategy but further combine them in a flexible manner. Additionally, they consider non-deterministic QoS values for the response time of service candidates. The approaches on (2) use the probability of failure (i.e. 1-availability) of a service candidate to select a suitable fault tolerant strategy. In case a service candidate has, for instance, a high probability of failure the parallel execution of functional equivalent service candidates becomes beneficial. This means that redundancy and higher costs are accepted to avoid a long response time in case a service candidate fails. The approaches on (2) do not focus on the QoS-aware ex-ante service selection or on the determination of the optimal service
9
composition. However, they are nevertheless related to our research and provide interesting insights into strategies for coping with the QoS attribute availability. In particular, the use of the probabilities of failure in decision making seems promising for the QoS-aware ex-ante service selection as well as for the consideration of the effects of potential service failures on other QoS attributes (e.g. response time or price).
In contrast to (1), the literature on (3) aims at QoS-aware re-planning approaches (cf. Ardagna and Pernici 2007; Berbner et al. 2007; Canfora et al. 2008; Li et al. 2011; Lin et al. 2010; Yu and Lin 2005; Zeng et al. 2004) to consider service failures when they actually emerge (i.e. during the runtime of the process). There are three types of approaches: First, those that re-optimize the remaining part of a service composition after every single service invocation (cf. Berbner et al.
2007). Second, those that try to substitute the failed service candidate with an alternative service candidate and expand the number of service candidates that are substituted if no feasible substitution can be found (cf. Ardagna and Pernici 2007; Li et al. 2011; Lin et al. 2010). Third, approaches that determine and re-optimize the remaining part of the service composition that has to be executed if a service candidate fails (cf. Berbner et al. 2007; Canfora et al. 2008; Yu and Lin 2005; Zeng et al. 2004). In all cases, the re-planning is based upon deterministic QoS values.
We discuss the approaches on (3) since they provide some interesting insights into how the failure of a service candidate can be compensated during the runtime of the process. In this case, the approaches either substitute the faulty service candidate with another feasible service candidate from the same service class or they switch to another feasible service composition.
Knowing these options is also necessary for the appropriate consideration of the effects of potential service failures within the QoS-aware ex-ante service selection.
To conclude this section, we are not aware of any existing approach that addresses the effects -
(or even one of the effects -) within a QoS-aware ex-ante service selection. Thus, we extend the approaches in (1) by considering the effects -. This allows for the approaches on
(2) and (3) to be used as knowledge base.
INTRODUCTION OF A RUNNING EXAMPLE
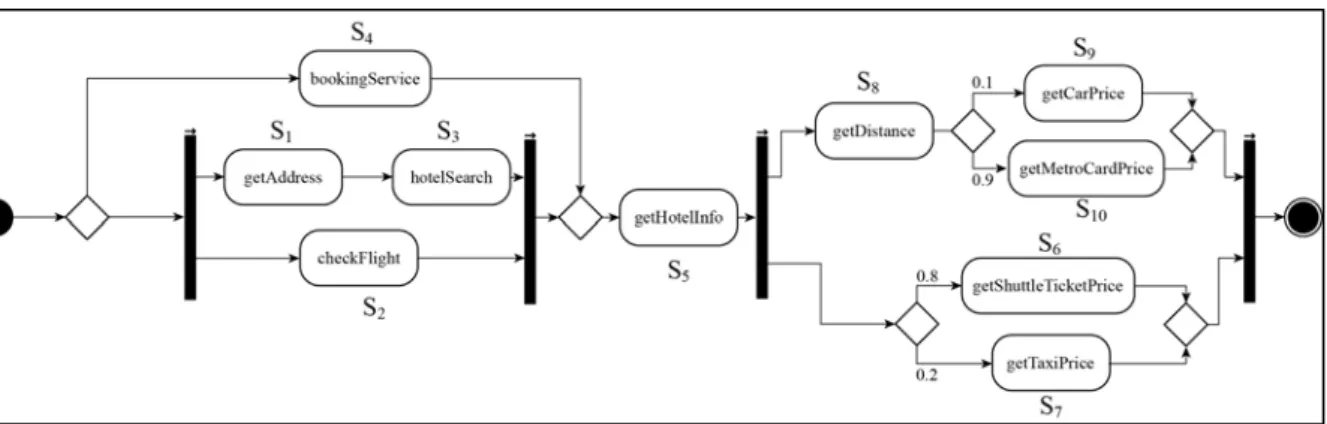
Our running example is based upon a travel booking process (cf. Figure 1) and was initially developed as part of a project for a service oriented marketplace (cf. Canfora et al. 2005; Canfora et al. 2008). We use this example due to the following reasons: First, the travel domain has practical relevance. ProgrammableWeb, for instance, offers more than 200 services for this domain. This may also be a reason why the travel domain is widely used to illustrate the problem of QoS-aware service selection (cf. Cardellini et al. 2007; Chifu et al. 2010; Dai et al. 2009; Gao et al. 2006; Grossmann et al. 2011; Guo et al. 2007; Hwang et al. 2008; Li et al. 2010; Li et al.
2011; Mei et al. 2008; Yang et al. 2009; Zeng et al. 2008). Second, a documentation of the service candidates and their corresponding QoS values for the QoS attributes response time and price is provided by Canfora et al. (2008). Due to the fact that no information is included concerning the QoS attribute availability, we used a service monitoring tool4 to complement the example with historical values for the availability of similar service candidates.
After introducing the running example, we apply an existing selection approach to determine the optimal QoS-aware services ex-ante. Detailed information regarding the notation used (cf. Yu et al. 2007; Zeng et al. 2004) is provided in the Appendix (cf. Table 4).
Example of a Travel Booking Process (according to Canfora et al. 2008)
The first task of the travel booking process is to search for available flights as well as for free accommodation near the address provided by the user. For that purpose either the service classes
4http://monitor.programmableweb.com/ (accessed in 01/2015)
11
S1-S3 or the service class S4 can be used (cf. pick construct, e.g. Wan et al. 2008, Yu et al. 2007).
Hence, compositions of service candidates of the service classes S1-S3 and service candidates of the service class S4 are functionally equivalent. Based on the arrival time and the latest possible hotel check-ins (cf. S5) either information about shuttle prices (in 80% of the cases) or taxi prices from the airport to the hotel (in 20% of the cases) are provided (cf. S6 or S7). The distance from the chosen hotel to a specific tourist attraction is calculated (cf. S8) in parallel. Based on this calculation, either information about car rental (in 10% of the cases) or metro card prices (in 90% of the cases) are presented (S9 or S10). The corresponding service candidates of each service class Si (with i=1...10; j=1...3) and their QoS values are summarized in the Appendix (cf.
Table 5). The end-to-end QoS requirement with respect to the response time is 40,000 ms.
Figure 1. Travel booking process
Exemplified QoS-aware ex-ante service selection according to existing approaches In the following, we apply an existing analytical selection approach to the example above to illustrate how the QoS-aware ex-ante service selection problem is solved. For this purpose and without loss of generality (i.e. other analytical approaches provide the same solution), we applied the approach by Yu et al. (2007) called MCSP. MCSP is based upon the multiconstrained optimal path problem and the shortest path problem in acyclic directed graphs. This approach was chosen, although it has a lower runtime performance than other analytical approaches (cf.
Ardagna and Pernici 2007; Zeng et al. 2004), as with small adaptions the second, third, fourth, and so on best2F5 service compositions could easily be determined as well – a fact that is especially important with respect to our evaluation conducted later on. In a first step, the possible service compositions are determined. The whole process (cf. Figure 1) involves ten service classes , each with three service candidates si 1, si 2 and si 3 (with i=1 to 10). To determine all possible service compositions considering the workflow structures we use the idea of execution routes (cf.
Alrifai et al. 2012; Ardagna and Pernici 2007; Yu et al. 2007; Zeng et al. 2004). An execution route is defined as a path from the start to the end of the process which contains all branches of each parallel split and only one branch of each XOR split. Overall eight possible execution routes have to be considered (cf. Table 1).
In total there are 9,724 possible service compositions to execute the process. The number of feasible service compositions depends on the given end-to-end QoS requirements. To determine the optimal service composition out of the feasible ones, the utility function U is applied, which is defined as follows:
∗
∝
max,
∝ min
,
∝ ∗
max, min
∝ ,
1 6
Considering there are x QoS attributes (with α=1 to x) that have to be maximized (e.g.
availability) and y QoS attributes (with β=1 to y) that have to be minimized (e.g. response time).
5 Thereby it is possible to determine the service compositions which are feasible subject to the given end-to-end QoS requirements and rank them according to their utility values.
6 A similar utility function can be found in Alrifai et al. (2012), Ardagna and Pernici (2007) and Zeng et al. (2004). However, in contrast to these works we decided to take a slightly different approach to normalize the QoS values. This way, we ensure the same utility value regardless of whether it is determined based on the aggregated QoS values of the whole service composition or based on the sum of utility values of the single service candidates that are element of the corresponding service composition. In addition, this adaptation does not affect utility-based rankings of single services and service compositions, respectively.
13
∝ and represent the QoS values for service candidate and QoS attributes and , respectively. The user can set up preferences (weights , ) for each QoS attribute (0< , <1 and ∑ ∑ 1). In our example, all QoS attributes (response time, price, and availability) have the same weight of . Same as Alrifai et al. (2012), the different QoS values are normalized with the distance between the maximum and the minimum value of a QoS attribute over all service classes (with i=1 to I) and service candidates (with j=1 to Ji).
This is done to prevent a selection approach from being biased by the scaling of the QoS values.
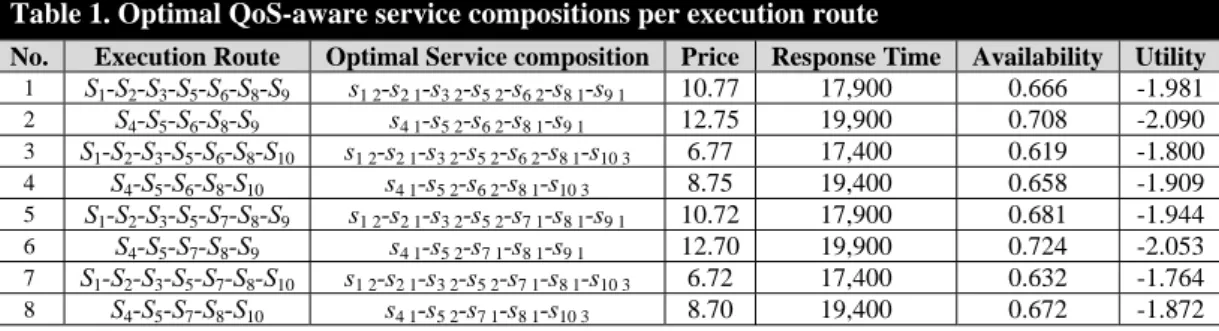
Using MCSP by Yu et al. (2007) and the utility function (cf. term 1) the following optimal QoS-aware service compositions are determined for the execution routes (cf. Table 1).
Table 1. Optimal QoS-aware service compositions per execution route
No. Execution Route Optimal Service composition Price Response Time Availability Utility 1 S1-S2-S3-S5-S6-S8-S9 s1 2-s2 1-s3 2-s5 2-s6 2-s8 1-s9 1 10.77 17,900 0.666 -1.981 2 S4-S5-S6-S8-S9 s4 1-s5 2-s6 2-s8 1-s9 1 12.75 19,900 0.708 -2.090 3 S1-S2-S3-S5-S6-S8-S10 s1 2-s2 1-s3 2-s5 2-s6 2-s8 1-s10 3 6.77 17,400 0.619 -1.800 4 S4-S5-S6-S8-S10 s4 1-s5 2-s6 2-s8 1-s10 3 8.75 19,400 0.658 -1.909 5 S1-S2-S3-S5-S7-S8-S9 s1 2-s2 1-s3 2-s5 2-s7 1-s8 1-s9 1 10.72 17,900 0.681 -1.944 6 S4-S5-S7-S8-S9 s4 1-s5 2-s7 1-s8 1-s9 1 12.70 19,900 0.724 -2.053 7 S1-S2-S3-S5-S7-S8-S10 s1 2-s2 1-s3 2-s5 2-s7 1-s8 1-s10 3 6.72 17,400 0.632 -1.764 8 S4-S5-S7-S8-S10 s4 1-s5 2-s7 1-s8 1-s10 3 8.70 19,400 0.672 -1.872
Focusing for instance on execution route 2, the optimal QoS-aware service composition is determined to s4 1-s5 2-s6 2-s8 1-s9 1 with an end-to-end price of 12.75, an end-to-end response time of 19,900, and an end-to-end availability of 0.708. The results of the existing analytical approaches in Table 1 serve as a reference base for the evaluation of our approach later on.
NOVEL APPROACH CONSIDERING THE EFFECTS OF POTENTIAL SERVICE FAILURES
First, we present an analytical model where the effects of potential service failures (effects -) are addressed. Second, we broaden the problem context by considering non-deterministic QoS values (effect ) and propose a simulation model. In correspondence with existing approaches
(cf. Alrifai et al. 2012; Ardagna and Pernici 2007; Yu et al. 2007), both models focus on the selection of the optimal QoS-aware service candidates per execution route of the considered process (cf. running example above).
Analytical Model
The basic idea of our approach is to consider the effects of potential service failures by means of an expected utility determined for a service candidate and subsequently for a whole service composition. To achieve this, the QoS attribute availability (represented by a probability) is used to weight the utility that is realized in case the respective service candidate is available while the failure rate (represented by the counter probability) is used to weight the utility that is realized in case the service candidate fails (cf. effect ). In the latter case, the time interval until a service failure is noticed and compensated (cf. effect ) and potential losses (cf. effect ) are taken into account when determining the expected utility. Furthermore, the (expected) end-to-end QoS values of a service composition can be calculated including the effects of service failures and then verified according to their feasibility with respect to the QoS requirements (cf. effect ).
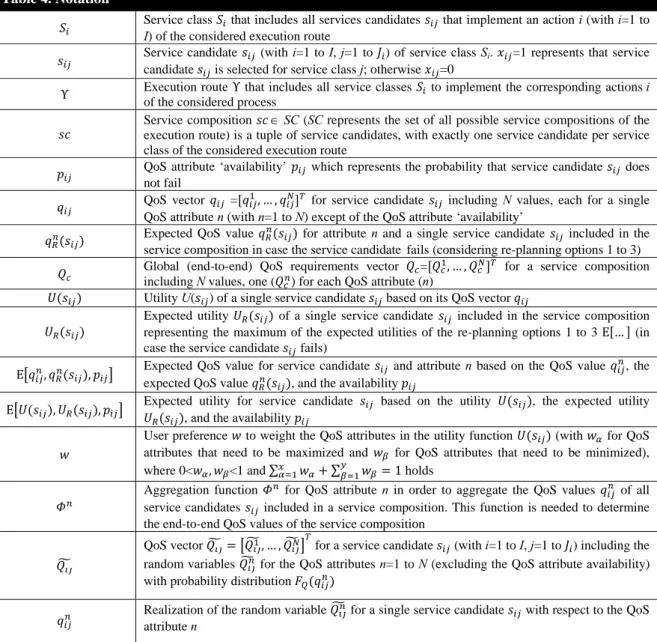
Based on the notation summarized in the Appendix (cf. Table 4) our optimization model is defined as follows:
max E , , ∗
∈
∈
Subject to: Φ
∈ , ∈ E , , ∗ ∀ 1, . . . ,
1
∈
; ∀ ∈ Υ ; ∈ 0; 1 2
Considering the service classes included in execution route Υ as well as the respective service candidates ∈ , the optimization model determines for a risk neutral decision maker the decision variables ( =1 indicates that service candidate is selected; =0 that it is not) to
15
maximize the accumulated expected utility of the selected service candidates. For each service class 4Fexactly one service candidate has to be selected. At the same time, the aggregated expected QoS values of the service composition need to satisfy the end-to-end QoS requirements , … , 7 for every QoS attribute n (with n=1 to N). This means that the expected QoS values E , , aggregated (with as aggregation function) over all service candidates included in the service composition need to be less than or equal to 8 (∀n=1 to N). Please notice that in case functional equivalent execution routes exists, the service candidates of the execution route creating the highest accumulated expected utility among all functional equivalent execution routes have to be selected for the execution of the process.
In the optimization model, the major challenge is to consider the effects of potential service failures when determining the expected utility E , , of a service candidate
∈ , ∈ Υ . A service candidate is only available with probability but fails with probability 1 . Thus, when determining E , , , the utility is weighted with the probability , whereas the expected utility is weighted with the probability 1 . Here, represents the maximum of the expected utilities of the possible re-planning options E … (in case service candidate fails). In the following, these re- planning options and the respective calculations are discussed in general and illustrated by means of our running example. For reasons of comprehensibility, we decided to use an excerpt of the
7For QoS attributes that have to be maximized (e.g. reputation) the corresponding constraint has to be multiplied with minus one so that it holds that the aggregated QoS values need to be less than the given QoS requirements.
8 Note that, depending on the intended analysis, when determining the aggregated QoS values of a service composition (cf. term (2)) the deterministic QoS values may be used instead of the expected values E , , considering a potential re- planning.
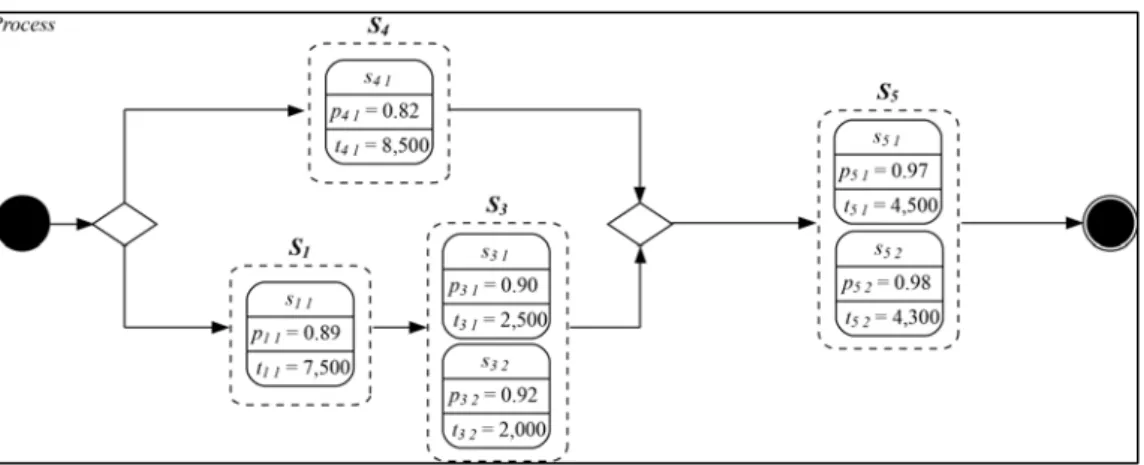
running example (cf. Figure 2) and focus on the QoS attribute response time as well as on the expected utility of a service candidate . Moreover, as the response time is the only QoS attribute considered we leave out the normalization in the denominator of the utility function provided by term (1). Nevertheless, the calculations can analogously be conducted for other QoS attributes and the whole process. In the following, we analyze a potential failure of service candidate considering the following general re-planning options.
Figure 2. Simplified excerpt of the process of the running example
1. Option 1: Select the next best service candidate which belongs to the same service class and is feasible subject to the QoS requirements : For that purpose the expected utility and the expected QoS values of every service candidate ∈ (with ) need to be calculated. Moreover, the time interval until the failure of service candidate is noticed and compensated (cf. effect ) needs to be considered. We suppose the expected value of this time interval to be 9 (with representing the response time of service candidate ).
Consequently, the service candidate creating the highest expected utility among all
9 Supposing the time interval until the failure is noticed and compensated to be uniformly distributed between 0 and tij, the expected value is given by .
17
alternative service candidates will be selected.
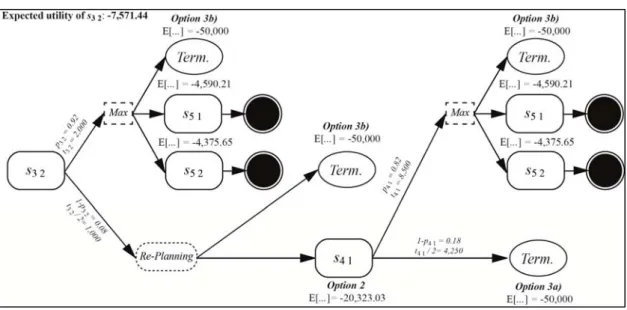
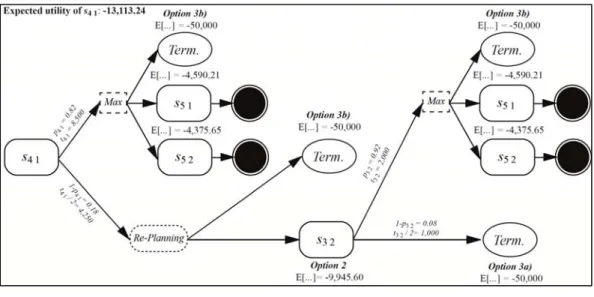
For a better understanding of this re-planning option we analyze a potential failure of service candidate in a situation where the service candidate of the preceding service class is available (cf. Figure 2). Here, the expected utility of the alternative service candidate has to be determined as follows (cf. Figure 3): First, for the case that service candidate is available (upper path in Figure 3), besides the utility of service candidate (-2,000) the expected utility that results in regard to the best service candidate in the succeeding service class needs to be taken into account10. This means that the expected utilities of the service candidates and have to be determined and compared considering a possible termination of the process (cf. option 3b) resulting in an expected utility of ‐50,000 as well.
For service candidate it is calculated to E … 0.97 * ‐4,500 0.03 *
‐2,250 ‐5,257 ‐4,590.21. The first summand represents that service candidate is available. In the second summand (i.e. service candidate is not available) the time interval until the failure of service candidate is noticed and compensated has to be considered with , 2,250. Moreover, the service candidate has to be taken into account as re-planning option resulting in an expected utility of E … 0.98*
‐4,300 0.02 * ‐2,150 ‐50,000 ‐5,257. Here, it is also considered that after a potential failure of service candidate the execution of the process needs to be terminated (cf. option 3a; ‘inevitable Termination’ resulting in an expected utility of ‐50,000 as no further alternative service candidates are available. Analogous calculations for service
10As is the last service class of the process (cf. Figure 2) no further succeeding service classes have to be considered.
candidate result in an expected utility of -4,375.65. Thus, in case is available, service candidate is determined as the best service candidate of the succeeding service class .
Second, for the case that the alternative candidate fails (lower path in Figure 3), service candidate is determined as the best re-planning option (compared to option 3b ‘optional Termination’) due to its expected utility (cf. Figure 3 – ellipse labeled with “Re-Planning”)
which is analogously calculated to E … 0,82 * ‐8,500
Max ‐4,590.21; ‐4,375.65; ‐50,000 0.18 * ‐4,250 ‐50,000 ‐20,323.03. To conclude, the expected utility of service candidate , representing re-planning option 1, is calculated to E … 0.92 * ‐2,000 Max ‐4,590.21; ‐4,375.65; ‐50,000 0.08 *
‐1,000 Max ‐50,000; ‐20,323.03 ‐7,571.44.
Figure 3. Calculating the expected utility for re-planning option 1
2. Option 2: Select the service candidate in the next best alternative service composition avoiding service class which is feasible subject to the QoS requirements . For this option, the expected utility and the expected QoS values of the service candidates in the alternative service compositions need to be calculated. The service candidate creating
19
the highest expected utility among the alternative service compositions and which is feasible subject to the QoS requirements will be selected. Aside from the consideration of the time interval until the service failure is noticed and compensated, any emerging losses (cf. effect
) also need to be taken into account within option 2. Losses emerge in situations where service candidates initially intended for the execution of the process are not part of the alternative service composition.
For a better understanding of this re-planning option, we again analyze a potential failure of service candidate in a situation where service candidate of the preceding service class is available (cf. Figure 2). Thus, we focus on service candidate when analyzing re-planning option 2. The expected utility of service candidate can be determined in a very similar way compared to re-planning option 1 and is calculated to E … 0.82 *
‐8,500 Max ‐4,590.21; ‐4,375.65; ‐50,000 0.18 * ‐4,250 Max
‐50,000; ‐9,945.60 ‐13.113,24. Note that if service candidate is available here, the QoS values of service candidate (implicitly) constitute losses as this service candidate is not part of the alternative service composition (cf. Figure 2).
Figure 4. Calculating the expected utility for re-planning option 2
3. Option 3: Terminate the execution of the process: In this case, disutility needs to be appointed (e.g. data loss as a result of a process termination (AWS Team 2012) or the emergence of business costs (Kieninger et al. 2013) caused by a service failure).
a) This option is inevitable in situations where no feasible alternative service candidate within the same service class of the faulty service candidate (cf. option 1) and no feasible alternative service composition avoiding the service class (cf. option 2) can be found.
b) A termination of process execution is also beneficial in situations where the expected utility of a feasible re-planning (cf. option 1 or 2) is lower than the expected utility of an immediate termination. This is the case if alternative service candidates or service compositions are feasible but with respect to the corresponding utility worse compared to the (dis)utility resulting from an immediate process termination. The same holds in case the service composition needs to be terminated later on (due to reasons mentioned above). Here, a re-planning is not economically worthwhile as further service candidates would be executed and further resources would be consumed, although the process has to be terminated anyway.
In our example, there is an option for a ‘beneficial Termination’ (cf. option 3b) in case of a potential failure of service candidate . This option results in an expected utility of
‐50,000. Moreover, Figures 3 and 4 also illustrate the calculation and consideration of the expected utility of the re-planning option ‘Termination’ for our example.
After calculating the expected utility for each re-planning option, the option with the highest expected utility is selected. This expected utility is multiplied with the probability 1
representing the case that service candidate fails. The utility is multiplied with the probability representing the case that service candidate is available. Hence, the expected utility E , , of service candidate is given by:
E , , ∗ ∗ 1 3
21
The corresponding expected QoS values E , , for each attribute n can be derived accordingly based on the QoS value , the expected QoS value in case of a failure, and the availability of service candidate .
In the example above (cf. Figure 2), re-planning option 1 provides the highest expected utility and thus would be selected in case of a potential failure of service candidate . Hence, the expected utility of service candidate is calculated to E , ,
‐2,500 * 0.9 ‐1,250 ‐7,571.44 * 1 ‐ 0.9 ‐3,132.14.
The discussion above shows that each service candidate is not only evaluated based on its own utility respective QoS values (e.g. the utility of -2,500 for service candidate in the example).
Rather, the effects (resulting from the re-planning options) in case of a failure of this service candidate (e.g. the utility of ‐1,250 ‐7,571.44 in case service candidate fails) are considered as well.
To conclude, with the expected utility E , , the optimal service candidates
∈ , ∈ Υ can ex-ante be selected (cf. term (2)) while considering the following effects of potential service failures.
By using expected utility calculus the effects of potential service failures can now be considered within the QoS-aware ex-ante service selection (i.e. the target function).
The aggregated (expected) end-to-end QoS values allow for an ex-ante consideration of the effects of potential service failures on the feasibility of service compositions.
Temporal delays until a service failure is noticed and compensated are considered when determining both the expected utility and the aggregated (expected) end-to-end QoS values.
Losses that can occur due to a re-planning are taken into account. These losses influence the expected utility and the aggregated (expected) end-to-end QoS values of a service composition and thus its valuation compared to other service compositions.
With the proposed approach, we aim to make better decisions in the QoS-aware ex-ante service selection. In this sense the waste of resources like time and money can be mitigated or prevented.
Simulation Model
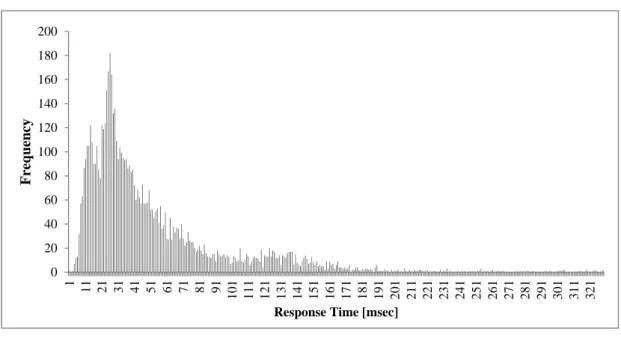
In the following we extend the analytical model by relaxing the assumption that all QoS values are deterministic. This is especially necessary for QoS values that are non-deterministic by nature such as response time or reliability (Fakhfakh et al. 2012; Hwang et al. 2007; Stein et al.
2009). Figure 5 depicts the real-world values (N=6,537) for the QoS attribute response time of the web service DOTS address validation8F11.
Figure 5. Histogram response time DOTS address validation
11 Service provided by serviceobjects.com (http://www.serviceobjects.com/support/performance-reports accessed in 1/2015).
0 20 40 60 80 100 120 140 160 180 200
1 11 21 31 41 51 61 71 81 91 101 111 121 131 141 151 161 171 181 191 201 211 221 231 241 251 261 271 281 291 301 311 321
Frequency
Response Time [msec]
23
It illustrates that considering non-deterministic QoS values (cf. effect ) is crucial as operating with a single deterministic QoS value does not reflect the real-world. The use of probability distributions for the QoS values leads to several challenges when determining the optimal service composition. To address these challenges it is favorable to define a simulation model due to the following reasons:
Determination of the end-to-end QoS values
Using probability distributions for the QoS values may imply that aggregating them to the end-to-end QoS values of a service composition is not promising in an analytical way.
Following from this, the validation of the QoS requirements is no longer practical in an analytical way either. This problem can be illustrated by means of an example with only two service candidates that are executed sequentially. Even if the response times of these service candidates follow different log normal distributions (cf. approx. the distribution shown in Figure 5) it is not practical to determine the resulting end-to-end QoS value for the response time by means of a probability distribution in closed form. This is especially true the bigger (e.g. more service classes and service candidates per service class) and the more complex (e.g. different probability distributions) the problem is. In these cases the use of numeric techniques such as simulations is more favorable.
Consideration of different workflow structures
Considering non-deterministic QoS values in combination with different workflow structures can lead to situations where the aggregation of QoS values is not promising in an analytical way. We will briefly illustrate this, considering a parallel split-synchronization structure and the response time as a QoS attribute: If the response times of two service candidates that are executed in parallel are represented by random variables (e.g. Z1 and Z2) following normal distributions with different expected values and variances, E , E ; E holds. Hence, the determination of the probability
distribution of the aggregated response times in closed form9F is not practical12, which leads to the same problems as above.
Thus, a simulation model is introduced to cope with effects -. Similarly to the analytical model, the idea of the simulation model is to determine the expected utility of the service candidates and subsequently for a whole service composition. Thus, in the simulation model, we iteratively analyze each service composition sc SC representing a tuple of service candidates, with exactly one service candidate for each service class of the considered execution route Υ (SC represents the set of all possible service compositions for execution route Υ). When analyzing the service candidates of service composition ( ∈ , ∈ ), the effects - are considered accordingly.
The non-determinism of the QoS values is modelled by using random variables for each QoS attribute n (with n=1 to N). , … , represents the QoS vector for a service candidate including all random variables (with i=1 to I, j=1 to J, and n=1 to N) following the probability distribution . To determine the expected utility E , , of a service candidate ∈ , its execution is simulated for a predefined number of simulation runs M. This means that if a service candidate is included in service composition , a realization for each random variable has to be drawn in each simulation run based on the corresponding probability distribution . To consider potential service failures within the simulation experiment, every service candidate is available with probability and fails with
12 There are approaches that provide methods for the aggregation of non-deterministic QoS values in an analytical way (e.g.
Fakhfakh et al. 2012; Hwang et al. 2007). But in contrast to the selection approach presented in this paper, those approaches take a runtime perspective. Hence, based on the invoked services, they know under certainty which values for the QoS attributes are realized and thus are able to determine the end-to-end QoS values in a closed form solution. For the ex-ante selection of services, however, those approaches are not applicable as it is not known which values for the QoS attributes will be realized based on the corresponding probability distribution.
25
probability 1 . To address this, we draw a realization of the random variable which follows a uniform distribution on the interval [0; 1]. Starting with the first service candidate of a service composition, this is accomplished by comparing the realization with the probability of availability (this is done for all subsequent service candidates of the service composition as well). More precisely two cases can be distinguished:
Case a: represents that service candidate is available in the simulated execution.
Case b: represents that service candidate fails in the simulated execution.
Case a: As service candidate is available, the realizations of the random variables are aggregated with the already processed QoS values for each simulation run. Here, the aggregation of the QoS values depends on the workflow structures (e.g. parallel-split, synchronization, XOR- split, and simple merge) of the process (Ardagna and Pernici 2007; Canfora et al. 2008; Yu et al.
2007). A detailed description to handle further workflow patterns (e.g. loop) can be found in Fakhfakh et al. (2012), Huang et al. (2009) and Hwang et al. (2007). Afterwards, it has to be verified whether the service composition is still feasible13, as the aggregated realizations (non- deterministic QoS values) could cause a violation of the QoS requirements. As a result two cases can emerge.
Case a.1: ϕ ∀ =1 to N. The aggregated QoS values of all QoS attributes satisfy the corresponding QoS requirements in the simulation run. In this case, the next service candidate of the considered service composition is analyzed.
Case a.2: ∃ : ϕ . At least one aggregated QoS value of a QoS attribute does not
13This can be evaluated using different procedures like Berbner et al. (2007) and Canfora et al. (2008).
satisfy the corresponding QoS requirement in the simulation run. Here, a re-planning is necessary to ensure feasibility of the considered service composition (cf. case b below).
Case b: In case b either a service candidate fails during its simulated execution or at least one of the aggregated QoS values does not satisfy the corresponding QoS requirement. Here, we have to analyze different re-planning options, in which the unavailable service candidate will not be considered. This holds until the next simulation run m+1 is started. The re-planning options are analogous to the analytical model and will therefore not be discussed in more detail. The following two cases can result:
Case b.1: There is at least one feasible service candidate or service composition that allows a further process execution (cf. option 1 and 2) and results in a higher utility compared to the termination of the process.
Case b.2: There is no feasible alternative service candidate or service composition that allows a further process execution (option 3a), or a termination of the process is beneficial as the expected utility of a feasible re-planning (cf. option 1 or 2) is lower than the expected utility of an immediate termination (option 3b). In this case the execution of the service composition has to be terminated and the corresponding (dis)utility is processed.
With the help of the simulation model, every service candidate can be evaluated regarding its expected utility. Over the total number of simulation runs M of a simulation experiment, the average expected utility E , , of a service candidate can be determined. As a result, each service candidate and thus each service composition can be evaluated in order to select the optimal QoS-aware services ex-ante while considering the effects of potential service failures (cf. effects -) as well as non-deterministic QoS values (cf. effect ). The simulation model and the re-planning procedure are illustrated in Nassi-Schneiderman diagrams in the Appendix (cf. Figure 8 and Figure 9).
27
EVALUATION
In this section we show that our analytical model leads – under certain conditions – to better results compared to existing QoS-aware ex-ante service selection approaches. If these conditions are not met, the results of the analytical model coincide with those of existing approaches providing an exact solution. Afterwards, we demonstrate the applicability of both the analytical model and the simulation model by means of the running example introduced above.
Evaluation of the Analytical Model
In the following, we state two findings. Together, these findings show that our approach allows for better decision making.
FINDING 1: Considering a feasible alternative service candidate (cf. option 1) and the effects of potential service failures (especially effects and ) our approach leads – under certain conditions – to better ex-ante decisions for the QoS-aware service selection compared to existing selection approaches.
FINDING 2: Considering a feasible alternative service composition (cf. option 2) and the effects of potential service failures (especially effects and ) our approach leads – under certain conditions – to better ex-ante decisions for the QoS-aware service selection compared to existing selection approaches.
Both findings12F can be demonstrated with the help of basic selection problems (it is obvious that the findings also hold for more complex problems involving further service candidates, QoS attributes, etc.)14. Even based on the basic selection problems it can be shown that if the effects
14Proofs can be made available by the authors upon request.
of potential service failures (cf. effects to ) are neglected this can – under prevalent conditions (i.e. these conditions are not special cases) – lead to wrong ex-ante decisions. Under these conditions, determining and using expected utilities and expected QoS values as proposed by our approach is therefore beneficial regarding the QoS-aware ex-ante service selection.
Findings 1 and 2 explicate that compared to existing selection approaches our approach indeed allows for a better ex-ante decision making, which is reflected in the following aspects:
(1) Compared to existing approaches our approach considers alternative service candidates (cf.
option 1) and service compositions (cf. option 2) and evaluates them with respect to their expected utility including the effects of potential service failures (cf. effect ).
(2) The provided approach takes into account that service failures may affect the feasibility of alternative service candidates and service compositions (cf. re-planning options) with respect to the QoS requirements (cf. effect ).
(3) The time interval until service failures are noticed and compensated (cf. effect ) and losses that may occur in the course of re-planning (cf. effect ) are considered as well.
Demonstration of the Applicability
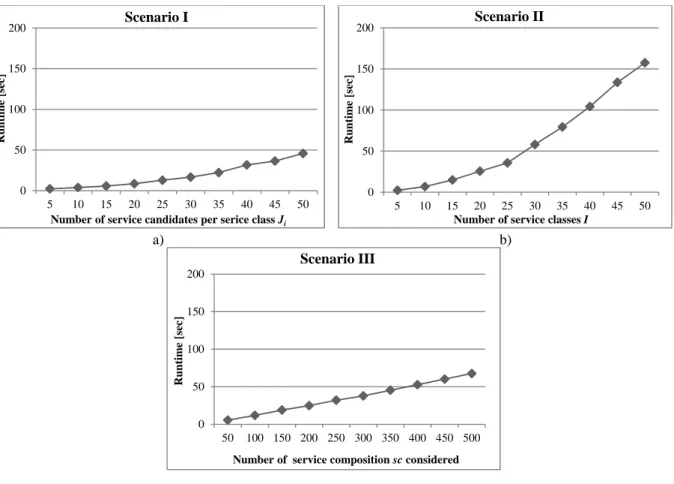
The goal of this evaluation step is to demonstrate the applicability of our approach and to show that this approach can lead to better results compared to existing selection approaches. In terms of better results we do not aim to provide a runtime optimized approach or a heuristic. It is rather about the question of how the effects resulting from potential service failures in combination with non-deterministic QoS values can be considered in a well-founded way resulting in better decisions in QoS-aware service selection. To show that our approach is manageable with respect to its computation time, an evaluation of its performance is provided at the end of this section.
We divided this evaluation step into two subsections. In the first, we evaluate the analytical model with respect to effects -. In the second, we evaluate the simulation model with respect to effects - and . This split into two subsections is useful to obtain comparability between
29
current selection approaches and our approach, since current analytical selection approaches do not consider non-deterministic QoS-values. Having demonstrated that our approach considering the effects of potential service failures - allows for better decision making, we are then able to additionally evaluate the provided approach with respect to effect .
To ensure transparency and reproducibility, we again use the example according to (Canfora et al. 2008) and the utility function (cf. Alrifai et al. 2012; Ardagna and Pernici 2007; Zeng et al.
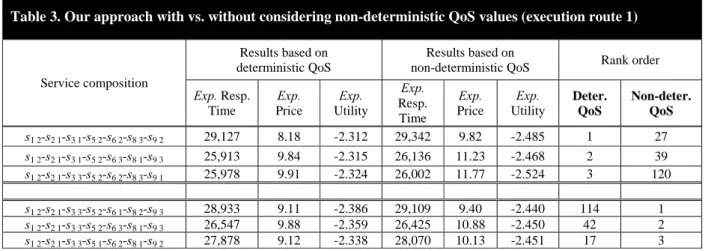
2004) given in equation (1). To illustrate that our results are feasible for different execution routes in the example, we exemplarily focus on execution route 2 in the first subsection and on execution route 1 in the second subsection, respectively. However the results for all other execution routes are very similar and summarized in the Appendix (cf. Table 6 and Table 7).
Analytical model
Using existing selection approaches, the optimal QoS-aware service composition for execution route 2 is determined to s4 1-s5 2-s6 2-s8 1-s9 1 with an end-to-end response time of 19,900, an end- to-end price of 12.75, and an end-to-end availability of 0.708 (cf. Table 1). In contrast, when applying our analytical model the optimal QoS-aware service composition is s4 3-s5 2-s6 1-s8 3-s9 3.
Table 2. Proposed approach vs. existing selection approaches (execution route 2; deterministic QoS values)
Service composition
Results based on existing selection
approaches
Results based on
the proposed approach Rank order Resp. Time Price Avail. Exp.
Resp. Time
Exp.
Price
Exp.
Utility
Existing approaches
Proposed approach s4 1-s5 2-s6 2-s8 1-s9 1 19,900 12.75 0.708 23,831 17.34 -3.008 1 116 s4 1-s5 2-s6 3-s8 1-s9 1 19,900 12.60 0.701 23,971 17.48 -3.019 2 123 s4 1-s5 2-s6 1-s8 1-s9 1 19,900 12.70 0.701 23,773 16.89 -2.947 3 86 s4 3-s5 2-s6 1-s8 3-s9 3 24,800 10.80 0.645 27,401 12.78 -2.709 110 1 s4 3-s5 2-s6 2-s8 1-s9 1 18,400 14.05 0.717 22,292 15.35 -2.713 6 2 s4 3-s5 2-s6 1-s8 3-s9 1 20,800 12.80 0.658 24,679 14.24 -2.714 84 3
As the results in Table 2 illustrate, service composition s4 1-s5 2-s6 2-s8 1-s9 1 which is determined as the optimal one by existing selection approaches is only in 116th position when the effects of
potential services failures - are considered. More precisely, if we analyze how these effects influence the end-to-end QoS values and thus the utility of the service composition s4 1-s5 2-s6 2- s8 1-s9 1 we come to the following results: Although this service composition has a lower probability of re-planning (=1-probability of availability=1-0.708=0.292) than service composition s4 3-s5 2-s6 1-s8 3-s9 3 (=0.355), its end-to-end QoS values are more influenced (absolutely and relatively) by the effects of potential service failures. For example, the end-to- end price of service composition s4 1-s5 2-s6 2-s8 1-s9 1 increases from 12.75 to 17.34 (about 36%) which is two times higher compared to service composition s4 3-s5 2-s6 1-s8 3-s9 3 (about 18%). The same holds for the QoS attribute response time. This means that potential service failures have a much greater effect on the utility of service composition s4 1-s5 2-s6 2-s8 1-s9 1 than on service composition s4 3-s5 2-s6 1-s8 3-s9 3. To demonstrate the effects of service failures on the QoS values of a service composition in more detail, we use the following excerpt of our example.
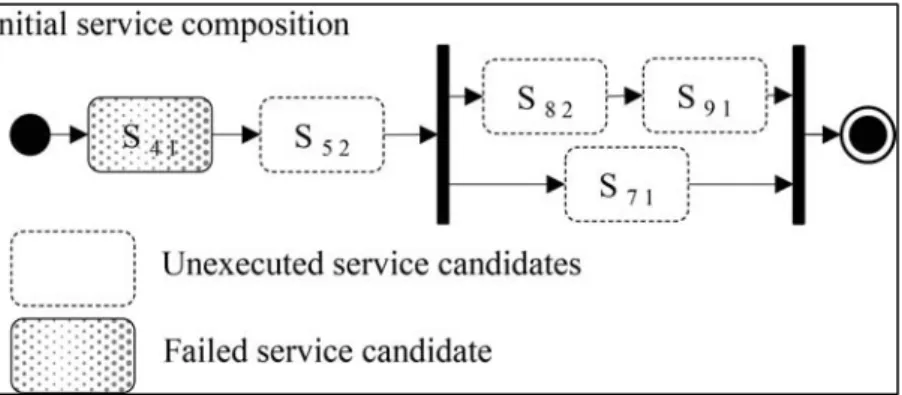
Figure 6. Excerpt of the example
Here, we focus on the effects that the potential failure of service candidate s4 1 has on the end-to- end QoS value response time. The probability that service candidate s4 1 fails is 0.19 (cf. Table 5 in the Appendix). Regarding this failure and the calculations using the analytical model, a re- planning is successful with probability 0.16 (with probability 0.03 the process has to be prematurely terminated). In this case, the expected response time is 35,792, which is – compared to the end-to-end response time of 19,900 (cf. Table 1) without considering the effects of potential service failures – an increase of about 80%. Thus, our approach proposes to select –
31
amongst others – service candidate s4 3 (here the increase of the response time in case of a successful re-planning is only 42%) instead of service candidate s4 1.
Another reason why service composition s4 1-s5 2-s6 2-s8 1-s9 1 (which is selected by existing approaches) is worse compared to other service compositions can be found in its bad robustness with respect to service failures. Indeed, the probability of a premature termination of this service composition is more than twice as high compared to service composition s4 3-s5 2-s6 1-s8 3-s9 3. These results clearly indicate that the presented approach does not only help to save resources but also increases the chances of successfully executing the process. Further, they also illustrate that a special treatment of the QoS attribute availability considering the effects of potential service failures is absolutely necessary.
Simulation model
With respect to the simulation model we first illustrate the importance to consider the effects -
(results of the simulation model). Afterwards, we demonstrate that the computation time to solve the simulation model is manageable (performance of solving the simulation model).
Results of the simulation model
To evaluate the simulation model, the non-determinism of the QoS attribute response time13F15 is focused in the following (cf. effect ). We prototypically implemented the simulation model and conducted our evaluation with the following parameterization: The execution of a service composition was simulated M=10,000 times in order to determine the expected utility E , , of the service candidates ∈ . Thereby, we used log-normal
15As the price is not that volatile in most realistic cases, for illustration purposes we decided to focus on the response time and left the price deterministic.