• Keine Ergebnisse gefunden

THE GERMAN PUBLIC SERVICE - STRUCTURE AND STATISTICS

N/A
N/A
Protected

Academic year: 2021

Aktie "THE GERMAN PUBLIC SERVICE - STRUCTURE AND STATISTICS"

Copied!
76
0
0

Wird geladen.... (Jetzt Volltext ansehen)

Volltext

(1)

Hans-Ulrich Derlien Stefan Frank Silke Heinemann

Stefan Lock

THE GERMAN PUBLIC SERVICE - STRUCTURE AND STATISTICS

Verwaltungswissenschaftliche Beiträge 35

Universität Bamberg

(2)

Verwaltungswissenschaftliche Beiträge Hg. Prof. Dr. Hans-Ulrich Derlien Universität Bamberg

Lehrstuhl für Verwaltungswissenschaft Feldkirchenstraße 21

D-96045 Bamberg Nr. 35

Second, enlarged edition 2005

Copyright Derlien 2005

(3)

Contents

Page

Introduction: Why This Report? 5

I. Structure of the German Public Service 5 II. Statistics of the German Public Service 11

1. Total Public Employment 12

1.1 Total Public Employment, Population and Labor Force Ratios, 1950-2002 1.2 Core Public Administration and Semi-State Employment, 1950-2002 1.3 Full- and Part-Time Employment, 1950-2002

1.4 Public Service System, 2002

2. Public Employment by Level of Government 16 2.1 Public Employment by Level of Government, 1950-2002

2.2 Federal Departmental Staff, 2003

2.3 Chancellor´s Office Personnel, 1949-2003 2.4 Personnel by Federal Government Branch, 2003 2.5 State Personnel by Land, 1991-2002

2.6 Local Government Personnel by Land, 1991-2002

2.7 Population Ratios of State and Local Government Employment, 1991-2002 2.8 Administrative Units of Länder, 2002

2.9 Local Government Employment, 1970-2002

3. Public Employment by Task Area and Level of Government 25 3.1a Total Employment by Task Area, 1960-2002

3.1b Relative Employment Strength of Task Areas, 1960 - 2002 3.2 General Administration, 1960-2002

3.3 Defense, 1960-2002

3.4 Police, Security and Public Order, 1960-2002 3.5 Justice and Penitentiary Personnel, 1960-2002 3.6 Education and Research, 1960-2002

3.7 Social Services, 1960-2002

3.8 Health, Environment and Recreation, 1960-2002 3.9 Agriculture and Forestry, 1960-2002

3.10 Housing, Land Use Regulation and Community Services, 1960-2002 3.11 Transportation and Communication, 1960-2002

3.12 Federal Postal Services, 1950-1994 3.13 Federal Railways, 1950-2002 3.14 Public Enterprises, 1960-2002 3.15 Economic Services, 1960-2002

3.16 Citizens per Public Official, by Task Area, 1960-2002

(4)

4. Status Groups 42 4.1 Public Employment by Status Group, 1950-2002

4.2 Public Employment by Status Group and Level of Govt., 1950-2002 4.3 Federal Employment by Status Group, 1950-2002

4.4 General Administration by Status Group, 1960-2002

4.5 Police, Security and Public Order by Status Group, 1960-2002 4.6 Justice and Penitentiary Personnel by Status Group, 1960-2002 4.7 Education and Research by Status Group, 1960-2002

4.8 Social Service Personnel by Status Group, 1960 -2002

4.9 Health, Environment and Recreation by Status Group, 1960-2002

5. Career Groups 51

5.1 Career Groups by Status Group, 1960-2002 5.2 Career Groups at the Federal Level, 1960-2002 5.3 Career Groups in Länder Administration, 1960-2002 5.4 Career Groups in Local Government, 1960-2002

5.5 Higher Civil Service by Salary Group and Level of Government, 2002

6. Part-Time Employment 57

6.1 Part-Time Employment by Level of Government, 1950-1996 6.2 Part-Time Employment by Policy Area, 1986-1996

6.3 Part-Time Employment by Status Group, 1950-1996

6.4 Part Time I and II Employment in Core Public Service, 1950-1996

7. Female Employment 61

7.1 Female Employment by Level of Government, 1960-2002 7.2 Female Employment by Policy Area, 1986-2002

7.3 Female Employment by Status Group, 1960-2002

7.4 Female Part-Time Employment by Status Group, 1960-2002 7.5 Female Employment by Career Group, 1960-2002

7.6 Structure of Female Public Service Employment, 2002

8. Personnel Expenditure 67

8.1 Task areas by personnel and expenditures in Germany, 2000 8.2 Personnel Expenditure in Public Budgets, 1992-1999

8.3 Expenditures for Pensions 1970-1999 8.4 Types of Pension Recipients, 2003

8.5 Pension Recipients by Level of Government, 2003

Appendix: Definition of Task Areas 71

(5)

Introduction: Why This Report?

This report grew out of various needs. First, the aim to demonstrate undergraduate stu- dents the differentiation of the German public service necessitated the development of the multi-dimensional graph we repeatedly employ here (see 1.4). Second, international scientific exchange made it clear that the German public service system is difficult to comprehend for foreign experts, too. Third, a comparative project carried through with Professor B. Guy Peters, financed by the Transcoop Program of the Humboldt Founda- tion and a matching fund of the University of Pittsburgh 1 , induced us to broaden the data base and to edit the German data in English in 1998. The following 10 country study is in its final stage for publication with Edgar Elgar Publisher.

The statistical sources of this volume are the periodic publications by the federal statisti- cal office (Statistisches Bundesamt) 2 , unless indicated otherwise. 3 Statistical transforma- tion, percentage calculation, and Tables are our own product.

We are grateful to Gisela Baumgärtner for her patience and proficiency in harmonizing the Tables and bringing the text into reproducible shape. Since the first edition 4 , Markus Karbaum and Meike Ullrich did an update during the previous years.

In the following we give an outline of the formal structure of the German Public service system with some comments on the empirical data presented in section II.

Interpretations contained in Derlien/Peters (footnote 1) should be seen as a more detailed context of the following observations.

I. Structure of German Public Service

1. Total Public Employment

We start with the inspection of the long-term trend since the inception of the Federal Republic of Germany. Data for the pre-1950 development are available only at irregular intervals 5 . The time series were produced by the Statistisches Bundesamt with slight

1 See Hans-Ulrich Derlien/B.Guy Peters 1998. Who works for Government and what do they do?

Universität Bamberg: Verwaltungswissenschaftliche Beiträge 32.

2 In particular Fachserie 14, Reihe 6 "Personal im öffentlichen Dienst", edited by Statistisches Bundesamt, Wiesbaden, also available via Internet: http://www.destatis.de.

In 1999 the Federal Ministry of the Interior published a similar volume; see Federal Ministry of the Interior 1999. The public service in Germany, Berlin. A second, revised edition is available at http://www.bmi.bund.de.

4 Hans-Ulrich Derlien/ Silke Heinemann/ Stefan Lock 1998.The German Public Service Structure and Statistics. Bamberger verwaltungswissenschaftliche Beiträge 34, 1998.

5 Bernd Wunder 1986. Geschichte der Bürokratie in Deutschland. Frankfurt: Suhrkamp, 130; Thomas

Ellwein/Ralf Zoll 1973. Zur Entwicklung der öffentlichen Aufgaben in der Bundesrepublik

Deutschland, in: Studienkommission für die Reform des öffentlichen Dienstrechts Bd. 8. Baden-

Baden: Nomos, 201-345; Peter Flora 1983. State, Economy and Society in Western Europe 1815-

(6)

deviations from the annual publications. After 1990, the data comprise western and east- ern Germany. Tables include professional military personnel unless mentioned other- wise. Furthermore, in Germany the judiciary is summarized in the fiscal statistics as part of public administration.

Between 1950 and 1990, total employment increased by 115 percent, with the highest growth rates during the decade 1950-60 (38 percent). After national unification in 1990 another 37 percent increase occurred; by 2002, the population ratio was back though to where it was in 1960 (5.8 percent) or 58 public servants per 1000 inhabitants (Table 1.1) 6 . As a percentage of the labor force 7 , public employment moved between 16 and 17 percent since the early 1970s, with a short-term increase after unification and consider- able downsizing after privatization of railways and postal services in 1994/5.

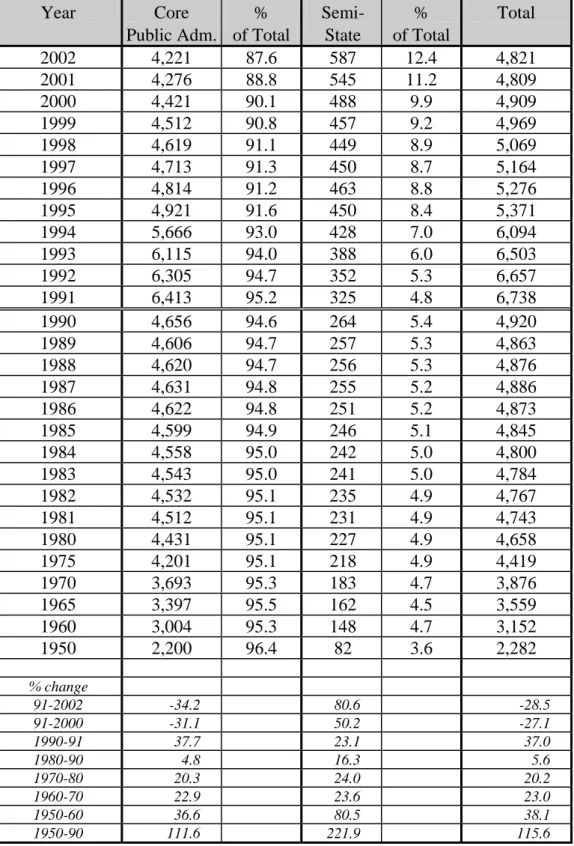
Semi-state employment (mittelbare Staatsverwaltung) is about 5 percent of total public employment, first of all in self-governing public pension and health care funds (public corporations, Körperschaften) as well as in the labor market administration (Table 1.2).

Since 1994, their share has relatively grown (587,000 or 12.4 percent in 2002). Employ- ment in semi-state agencies and corporations is often not included in the following Tables, but data refer to core public administration (unmittelbare Staatsverwaltung).

Total public service growth conceals a substantial portion (some 25 percent) of part- time employment in the public sector that has emerged since 1950 (Table 1.3; see also section 6).

Graph 1.4 outlines the structural dimensions and the proportions between sub-categories of the public service system (2002) that are to be inspected more closely below.

2. Employment by Level of Government

The Federal Republic of Germany is not a unitary state but a system with vertical separation of powers between federal and Länder governments. Local governments, although legally part of the Länder, are constitutionally granted autonomy "within the confines of the laws" (Article 28 Section 2 Basic Law). Their political organization (constitution) is legislated by the individual Länder; thus, there is some degree of variation of formal structures between units at the lower levels of government. German federalism is "Vollzugsföderalismus", or implementation federalism, with almost all federal laws being implemented through the Länder and ultimately through local governments.

Federal government was the biggest employer in 1950 (40 percent) but is the smallest in 2002 (13 percent). Half of the public service is Land personnel, one third is employed by local governments (Table 2.1).

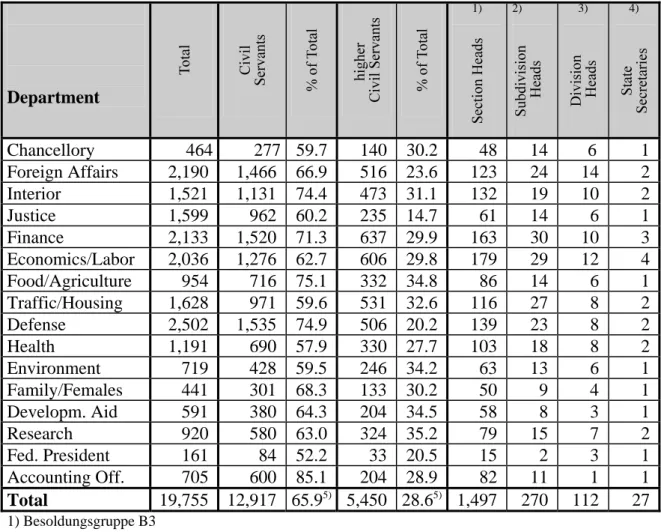
The federal level is constituted by the federal government and its 15 to 18 ministries and 20,000 (2003, Table 2.2) public servants in Bonn and Berlin. Departmental staff and

1975, Vol. I. Frankfurt: Campus, 193-309; J.P. Cullity 1967. The Growth of Government Employment in Germany 1882-1950, in: Zeitschrift für die Gesamte Staatswissenschaft 123, 201-217.

6 Population figures include foreign residents.

7 Labor force (Erwerbspersonen) includes those in labor (Erwerbstätige) plus those seeking labor.

(7)

chancellory personnel are displayed in Tables 2.3 and 2.4 for 2003; while the chancellor's office is relatively small (about 500 personnel), the ministry of defense and the department of foreign affairs are the largest departments. The size of the field staff the federal ministries are commanding is contained in Table 2.4 for the year 2003. The data, once again, illustrate that the federal government is hardly involved in policy implementation at the local level. Federal non-governmental institutions, some 50 quasi- autonomous governmental and 250 quasi-autonomous semi-state (predominantly social insurance systems) as well as the five federal courts of justice, the military, (and, until privatization, federal rails and postal services) have traditionally been distributed throughout the country.

As the sources for these Tables indicate, detailed data for the center of federal govern- ment is not provided by official statistics.

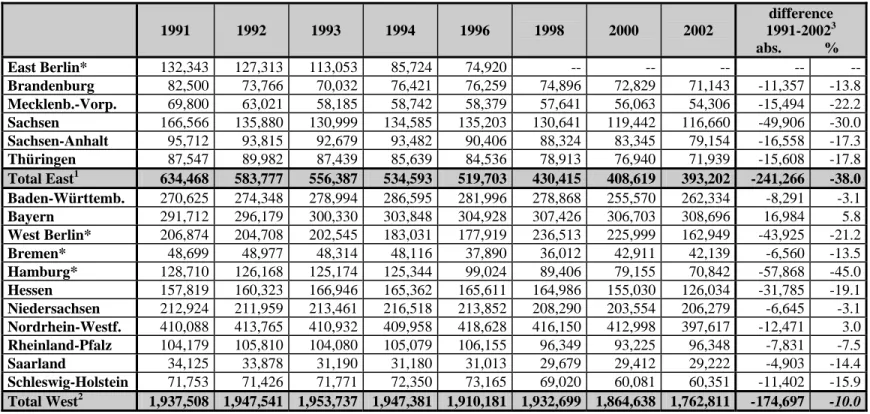
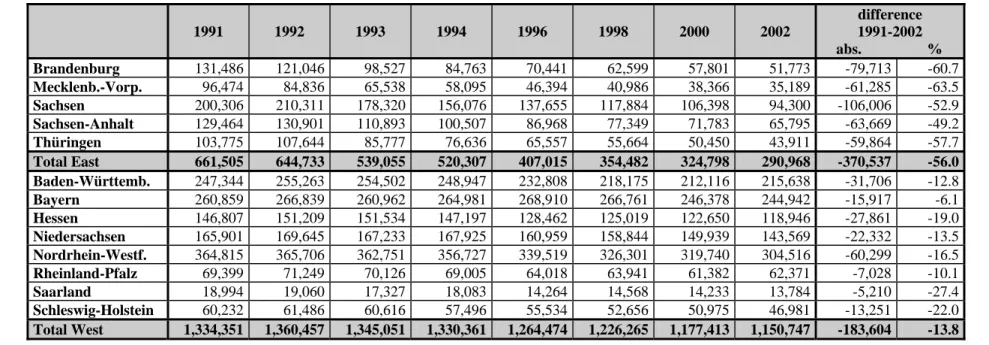
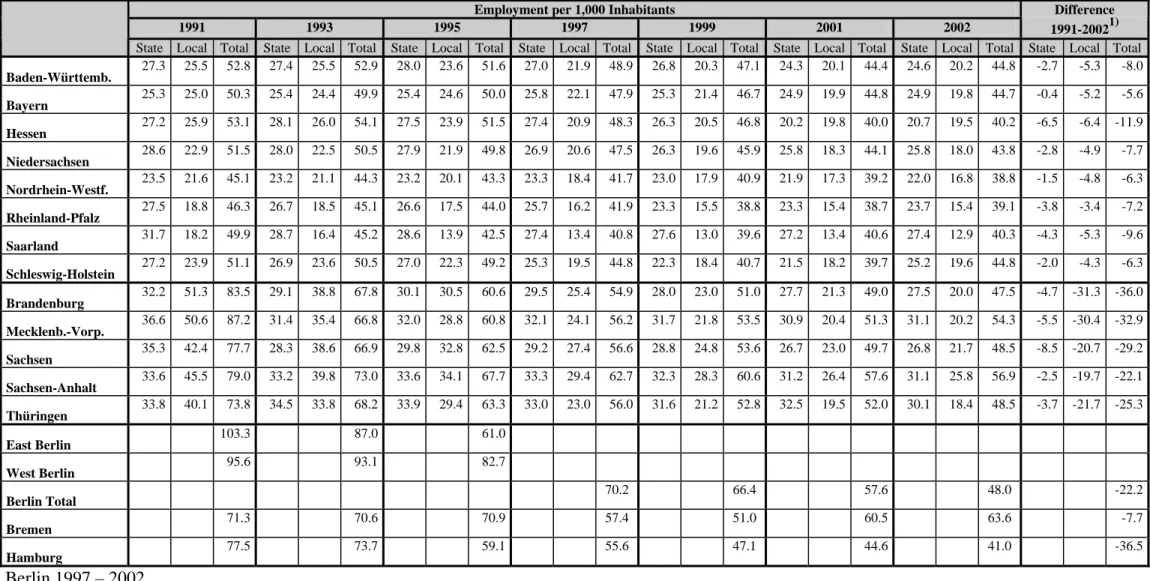
Tables 2.5 and 2.6 are reflecting East-West difference since 1991 and the considerable down-sizing at the eastern local government level in recent years. Nevertheless, as the population ratios (Table 2.7) show, service density is still considerably higher in eastern Germany than in the western part of the country, but less so at the newly created eastern state than at the local government level.

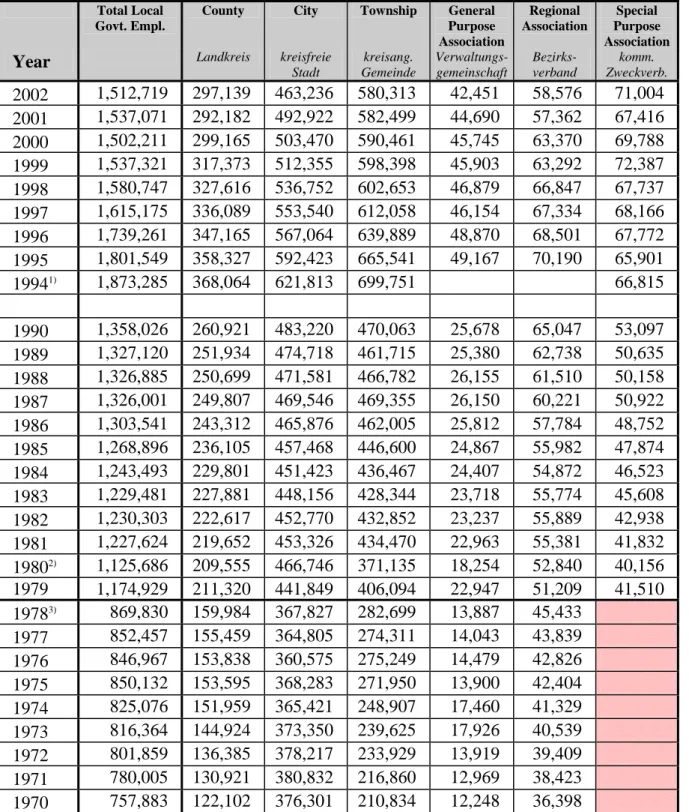
The administrative structure of the Länder, their regional general purpose authorities (the French prefect system adopted by Prussia) and the system of local government is displayed in Table 2.8. The territorial amalgamations of the 1960s lead to the incorpora- tion of townships/villages into larger units and/or the formation of general purpose associations in rural areas; the adaptation to this structure in the new Länder was though less brutal after 1990. The corresponding distribution of local government personnel is contained in Table 2.9.

3. Task Areas by Level of Government

The manner in which statistics are kept in Germany presents some problems for interna- tional comparison. In some policy areas the definitions of categories are special. For example, the category labelled "police and fire" is literally translated from German as

"Police, Security and Public Order" and includes: police (federal and Land), emergency services, fire protection, ambulances, construction supervision and zoning enforcement, citizen registration offices, and licensing activities (including passports). Specifications (in German) are contained in the Appendix.

Furthermore, officials working in ministries including the foreign office or in the revenue administration are reported in the "general administration" category rather than in the policy area in which their work occurs. This categorization represents the tradition of the legally-trained, generalist administrator in Germany. This official is expected to have fungible skills that can be applied in any policy area. The general administration category is also a reflection of the doctrine of unity of administration.

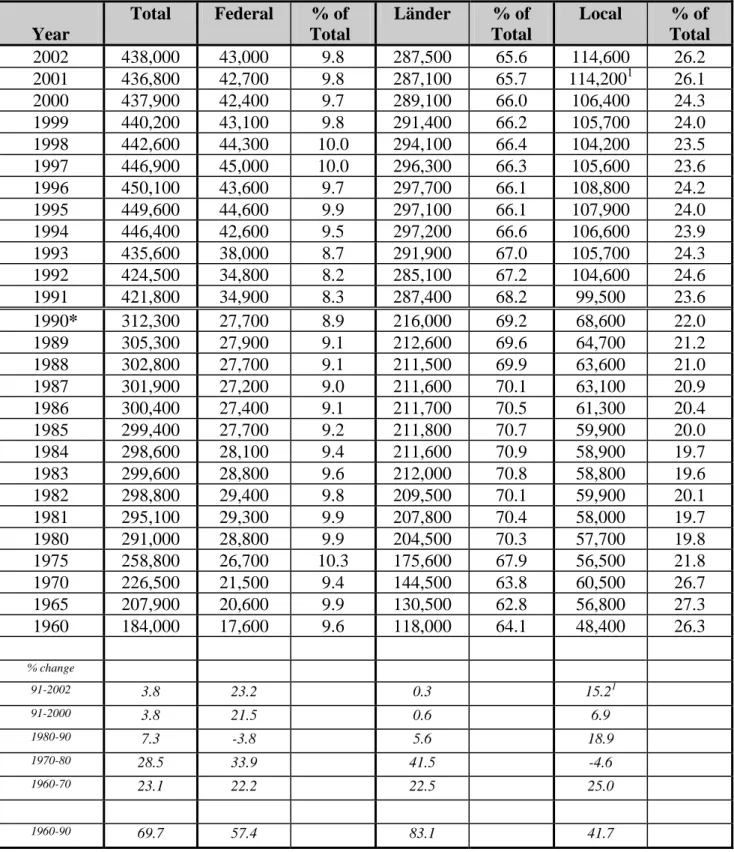
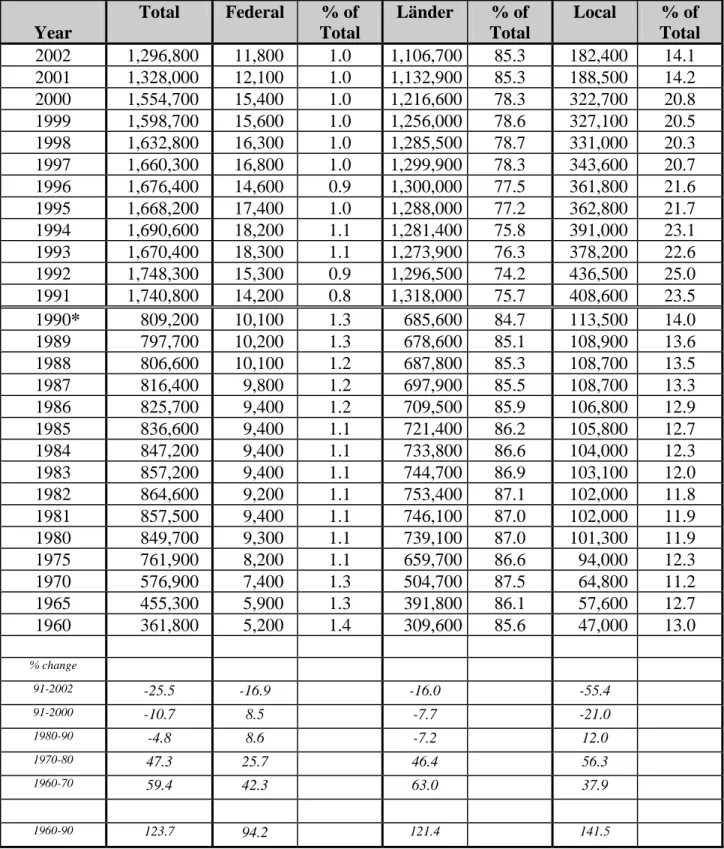
Education and research, police and law enforcement as well as public health are the

quantitatively most important public task areas, and they are concentrated at the Land

level.

(8)

4. Status Groups

There are two classes of public servants: those with the traditional public law status of civil servants, who however do not necessarily constitute the administrative elite like in Britain but include also, for instance, policemen; and the historically more recent group of those working under private law contracts, (manual) laborers and (white collar) em- ployees. Whereas positions that are defined as entailing authoritative capacity in the law and order branches (e.g. police and revenue service) must be staffed with career civil servants (Article 33 Section 4 Basic Law), the other group(s) are predominantly found in social and health services, in research and in clerical functions (employees) or do physical work, e.g. in local waste disposal. For them job staffing is typical. However, often employees are working in jobs that imply authoritative acts and thus should be carried out by civil servants. On the other hand, in the state-operated education system also teachers and professors have civil service status. This classification dates back to the authoritarian state and implies (some) control of the state over material education; it was and is though not undisputed.

In 1973, an unsuccessful attempt was made to harmonize this dual structure of the public service and to create a uniform public service, be it by extending public law status to all groups, be it by changing the constitution and abandoning the special status of the civil service.

Table 4.1 shows, despite absolute growth since 1950, the relative decline of the number of civil servants since unification and the ascent of the employee group; public laborers, in particular owing to recent privatizations, are the losers of the long-term historical development.

Civil servants are dominating the personnel structure of federal (in particular since 1994) and Land governments (education, police, general administration). Local government personnel consists, first of all, of employees and, secondly, of laborers (Table 4.2). The loss of both groups at the federal level is a result of privatizing federal railways and the postal service since 1994 (Table 4.3).

The dominance of civil servants in traditional, partly authoritative, state sectors is reflected in Tables 4.4 to 4.7 and contrasts with the social service and health sectors where employees are working overwhelmingly at the Land and local levels (Tables 4.8 and 4.9).

5. Career Groups

There are four categories of public servants corresponding to the hierarchy of educa- tional institutions in Germany and certificates attained there; civil servants and employees are classified the same way by the official statistics, although the latter do not enter a career. First, the university trained higher civil service and equivalent employees amount to 18 percent of total personnel (2002). The group below (with A- level certificates, the German Abitur that qualifies for university admission) comprises 36 percent, followed by the next two career groups with 46 percent (Table 5.1). The

"simple service" comprises those who have completed primary school (Hauptschule)

(9)

after 9 years of attending; this group has almost disappeared owing to upgradings in the past.

The career of each of the four groups consists of four grades or offices (Amt) that can be reached through promotion. The second and third grades are normally automatically attained after a certain period without outstanding performance. Furthermore, as a rule, every applicant has to enter the initial grade in her or his respective career group, irre- spective of professional experience gathered in the private sector. Exceptions are, of course, necessary and are occasionally made to recruit experts, e.g. highly qualified che- mists for designing environmental protection regulations; these persons would then be accepted to the civil service above career group entry level after approval by the federal or Länder civil service commissions.

The higher civil service, although a minority at all three levels of government, is least frequent at the local and federal levels (7 to 8 percent). Owing to the education and university sector, higher (and elevated) civil service status is most frequent at the Land level (Tables 5.2 - 5.4).

6. Part-Time Employment

Part-time employment increased to 27 percent by 2002 (Table 6.1); it was always most widespread at the local and state levels. Education, social and health care are the pre- ferred task areas for part-time employment (Table 6.2). In the civil service preserves of the authoritative state, part-time employment is a recent development (Table 6.3). Table 6.4 distinguishes the diminishing share (2002: 12.5 percent) of those working less than half of the regular working hours.

7. Female Employment

Due to the accession of the female dominated eastern German public service, public service employment became evenly distributed between the sexes in the 1990s; there are though significant imbalances in the public service structure. Part-time employment is female dominated (83 percent in 2002, Table 7.4). Both of these characteristics are closely related at the aggregate level (Graph 7.6). With respect to task area (and thus level of government, Table 7.1) there are though marked differences between female domains (Table 7.2); women are overrepresented in social (80 percent) and health (67 percent) services and in education (61 percent). As civil service status is hindering part- time employment, women are underrepresented in this status group. Finally, female public employment increases the further one moves down the hierarchy of career groups (Table 7.5).

8. Personnel Expenditure

The data show the relative importance of personnel expenditure at the different levels of

government. The federal government, although always the biggest spender, carries the

relatively smallest burden of personnel costs. Owing to the tremendous costs of trans-

forming eastern Germany, the relative share of personnel expenditure in the federal

budget has gone down after 1990; recent reduction of federal personnel, in particular

since 1994, so far has hardly decreased the relative position of personnel expenditure.

(10)

As the Länder are responsible for administration in the most important policy areas, not only their personnel is the most voluminous in numbers but personnel expenditure is the single most important item in the Länder budgets (well above 40 percent in the West).

The statistical category "personnel expenditure", however, includes pensions for retired

civil servants(in detail Table 8.3, Graph 8.4, 8.5). The east-west Länder difference is

largely due to the fact that the retired GDR state functionaries get their pension from the

general (semi-state) insurance fund and not from the current Land budget; furthermore,

the number of newly appointed civil servants, who have already retired, is - naturally -

very small in the new Länder.

(11)

II. Statistics of the German Public Service

(12)

Table 1.1: Total Public Employment, Population and Labor Force Ratios, 1950-2002 Year Public Employment

(in 1,000)

as % of Population 1)

Public Servants 1,000 Inhabitants

as % of Labor Force 2)

2002 4,809 5.8 58.2 11.8 2001 4,821 5.8 58.5 11.9 2000 4,909 6.0 59.7 12.0 1999 4,969 6.0 60.5 12.3 1998 5,069 6.2 61.8 12.6 1997 5,164 6.3 63.0 12.9 1996 5,276 6.4 64.4 13.2 1995 5,371 6.6 65.8 13.4 1994 6,094 7.5 74.8 15.1 1993 6,503 8.0 80.1 16.9 1992 6,657 8.3 82.6 16.6 1991 6,738 8.4 84.2 16.8 1990 4,920 7.8 77.8 15.7 1989 4,863 7.8 78.4 16.3 1988 4,876 7.9 79.3 16.4 1987 4,886 8.0 80.0 16.9 1986 4,873 8.0 79.9 16.6 1985 4,845 7.9 79.5 16.7 1984 4,800 7.9 78.5 16.7 1983 4,784 7.8 77.9 16.8 1982 4,767 7.7 77.4 16.8 1981 4,743 7.7 76.9 16.9 1980 4,658 7.6 75.7 16.9 1975 4,419 7.1 71.5 16.4 1970 3,876 6.4 63.9 14.3 1965 3,559 6.1 60.7 13.0 1960 3,152 5.7 56.9 12.0 1950 2,282 4.6 45.7 10.4

% change

91-2002 -28.6 1990-91 37.7 1980-90 5.6 1970-80 20.2 1960-70 23.0 1950-60 38.1 1950-90 115.6 1950-02 110.7

Source: Population according to: Statistisches Bundesamt. Statistische Jahrbücher für die Bundesrepublik Deutschland; http://www.destatis.de, 01.10.2004.

1) Population is defined as German plus foreign inhabitants.

2) Labor force is defined as those in labor plus those seeking labor, the problem being to determine who is

seeking labor (labor office registration and/ or census data).

(13)

Table 1.2: Core Public Administration and Semi-State Employment (in 1,000), 1950-2002 Year Core

Public Adm.

% of Total

Semi- State

% of Total

Total

2002 4,221 87.6 587 12.4 4,821 2001 4,276 88.8 545 11.2 4,809 2000 4,421 90.1 488 9.9 4,909 1999 4,512 90.8 457 9.2 4,969 1998 4,619 91.1 449 8.9 5,069 1997 4,713 91.3 450 8.7 5,164 1996 4,814 91.2 463 8.8 5,276 1995 4,921 91.6 450 8.4 5,371 1994 5,666 93.0 428 7.0 6,094 1993 6,115 94.0 388 6.0 6,503 1992 6,305 94.7 352 5.3 6,657 1991 6,413 95.2 325 4.8 6,738 1990 4,656 94.6 264 5.4 4,920 1989 4,606 94.7 257 5.3 4,863 1988 4,620 94.7 256 5.3 4,876 1987 4,631 94.8 255 5.2 4,886 1986 4,622 94.8 251 5.2 4,873 1985 4,599 94.9 246 5.1 4,845 1984 4,558 95.0 242 5.0 4,800 1983 4,543 95.0 241 5.0 4,784 1982 4,532 95.1 235 4.9 4,767 1981 4,512 95.1 231 4.9 4,743 1980 4,431 95.1 227 4.9 4,658 1975 4,201 95.1 218 4.9 4,419 1970 3,693 95.3 183 4.7 3,876 1965 3,397 95.5 162 4.5 3,559 1960 3,004 95.3 148 4.7 3,152 1950 2,200 96.4 82 3.6 2,282

% change

91-2002 -34.2 80.6 -28.5

91-2000 -31.1 50.2 -27.1

1990-91 37.7 23.1 37.0

1980-90 4.8 16.3 5.6

1970-80 20.3 24.0 20.2

1960-70 22.9 23.6 23.0

1950-60 36.6 80.5 38.1

1950-90 111.6 221.9 115.6

(14)

Year Total Employment

full-time % part-time %

2002 4,809 3,521 73.2 1,288 26.8 2001 4,821 3,584 74.3 1,236 25.7 2000 4,909 3,697 75.3 1,212 24.7 1999 4,969 3,805 76.6 1,164 23.4 1998 5,069 3,953 78.0 1,116 22.0 1997 5,164 4,085 79.1 1,079 20.9 1996 5,276 4,207 79.7 1,069 20.3 1995 5,371 4,303 80.1 1,068 19.9 1994 6,094 4,920 80.7 1,174 19.3 1993 6,503 5,369 82.6 1,134 17.4 1992 6,657 5,579 83.8 1,078 16.2 1991 6,738 5,671 84.2 1,067 15.8

1990 4,920 4,048 82.3 872 17.7

1989 4,863 4,021 82.7 842 17.3

1988 4,876 4,059 83.2 817 16.8

1987 4,886 4,089 83.7 797 16.3

1986 4,873 4,075 83.6 798 16.4

1985 4,845 4,075 84.1 770 15.9

1984 4,800 4,068 84.7 732 15.3

1983 4,784 4,082 85.3 702 14.7

1982 4,767 4,086 85.7 681 14.3

1981 4,743 4,091 86.2 652 13.8

1980 4,658 4,039 86.7 619 13.3

1975 4,419 3,904 88.3 515 11.7

1970 3,876 3,498 90.2 378 9.8

1965 3,559 3,288 92.4 271 7.6

1960 3,152 2,958 93.8 194 6.2

1950 2,282 2,215 97.1 67 2.9

% change

91-2002 -28.7 -38.0 20.7 91-2000 -27.1 -34.8 13.6 1990-91 36.9 40.1 22.4 1980-90 5.6 0.2 40.9 1970-80 20.2 15.57 63.8 1960-70 23.0 18.3 94.8 1950-60 38.1 33.5 189.6

1950-90 115.6 82.8 1201.5

(15)

Totals:

full-time: 3,520,908 (73.2%) part-time: 1,288,182 (26.8%)

Civ.Serv.: 1,859,809 (38.7%) Employ.: 2,323,069 (48.3%) Laborers.: 625,996 (13.0%)

Subtotal:

(full-time; Fed.Gov., Länder, Loc.Gov.): 2,974,640 Civ.Serv.: 1,427,444 (48.0%) Employ.: 1,168,854 (39.3%) Laborers: 378,126 (12.7%)

Subtotal:

(c.s. + empl.): 2,596,514 Career Group

494,233 (19.0%) 936,377 (36.1%) 1,082,170

(41.7%) 70,038 (2.7%) Policy-Area:

1 438,339

3 398,539 4 762,815

Graph 1.4: Public Service System, 2002

Civil Servants Employees Laborers Civil Servants Employees Laborers Civil Servants Employees Laborers

Independent Public Enterprises Total Public Service Employment

Total Labor Force

587,954 (12.2%)

40,022,000

4,809,090

4,221,136 (87.8%)

62,124 (1.5%) 490,280 (11.6%)

42,660 (8.7%) 447,620 (91.3%)

17,772 22,361 9,269 40,416 293,226 64,576

875 (1,3%) 55,084 (73.0%)

13,233 (17.6%)

5,177 (7.0%)

68,668 (15.3%) 75,504

(16.7%) 303,448

(67.8%) 29,210 (9.6%) 59,031 (19.5%)

40,822 (13.5%) 174,385 (57.5%)

full-time part-time

Federal Government

Core Public A dministration Semi-State

Railway s

1 2 3 4 5 6

2,156,013 (51.1%)

574,512 (26.6%) 1,581,501 (73.4%)

7,607 (1.6%) 218,807 (43.1%) 147,628 (29.0%) 128,126 (25.2%)

100,339 (6.4%) 508,375

(32.1%) 972,787

(61.5%) 268,240 (27.6%) 487,965 (50.2%)

8,001 (0.8%) 208,581 (21.4%)

full-time part-time

1,441,715 (34.2%)

496,196 (34.4%) 945,519 (65.6%)

12,269 (2.2%) 374,327 (64.0%) 151,366 (25.9%)

40,659 (7.0%)

233,323 (24.7%) 584,975

(61.9%) 151,425

(16.0%) 22,821 (15.1%) 77,154 (51.0%)

464 (0.3%) 50,986 (33.7%)

full-time part-time

Länder Local Government

71,004 (1.7%) Special Prurpose Ass.

72,852

203,865 157,972 708,287 268,124 35,308 208,005

1 2 3 4 5 6

354,438 153,834 45,259 89,999 136,231 165,758

1 2 3 4 5 6

*Policy Areas : 1 General Administration 1 General Administration 1 General Administration

2 Defense 2 Health and Recreation 2 Social Service

3 Police 3 Police 3 Police

4 Education and Research 4 Education and Research 4 Education

5 Transport and Communication 5 Justice 5 Health and Recreation

6 Others 6 Others 6 Others

Higher Service

„Elevated“

Service

Simple

Service

Middle

Service

(16)

Year

Total Federal of these:

Military

2)

of these:

Railways

of these:

Post, etc.

% of Total

Länder % of Total

Local 3) % of Total 2002 4,221,136 552,404 185,221 62,124 -- 13.1 2,156,013 51.1 1,512,719 35.8 2001 4,276,068 560,143 184,561 66,360 -- 13.1 2,178,854 51.0 1,537,071 35.9 2000 4,420,900 575,600 186,600 73,600 -- 13.0 2,273,500 51.4 1,572,000 35.6 1999 4,512,100 588,700 189,800 78,400 -- 13.0 2,313,700 51.3 1,609,700 35.7 1998 4,619,300 607,700 191,000 91,700 -- 13.2 2,363,100 51.2 1,648,500 35.7 1997 4,713,300 628,000 191,800 101,600 -- 13.3 2,401,900 51.0 1,683,300 35.7 1996 4,813,900 644,700 190,700 111,600 -- 13.4 2,429,900 50.5 1,739,300 36.1 1995 4,921,100 666,100 194,000 119,800 -- 13.5 2,453,400 49.9 1,801,600 36.6 1994 5,666,600 1,311,400 213,000 128,500 605,000 23.1 2,482,000 43.8 1,873,200 33.1 1993 6,115,000 1,657,500 231,000 417,700 636,800 27.1 2,510,700 41.1 1,946,800 31.8 1992 6,305,100 1,700,300 246,000 433,900 641,500 27.0 2,531,300 40.1 2,073,500 32.9 1991 6,412,400 1,789,000 257,000 473,800 663,500 27.9 2,572,000 40.1 2,051,400 32.0 1990 4,656,200 1,363,200 244,000 249,800 537,200 29.3 1,935,000 41.6 1,358,000 29.2 1989 4,606,600 1,368,100 247,000 257,800 531,400 29.7 1,911,500 41.5 1,327,000 28.8 1988 4,620,600 1,379,100 250,000 268,800 527,800 29.8 1,914,600 41.4 1,326,900 28.7 1987 4,630,100 1,394,200 251,000 279,100 531,600 30.1 1,910,000 41.2 1,325,900 28.6 1986 4,622,200 1,396,900 249,000 288,100 529,200 30.2 1,921,700 41.6 1,303,600 28.2 1985 4,598,900 1,415,100 250,000 297,800 536,900 30.8 1,914,800 41.6 1,269,000 27.6 1984 4,558,200 1,419,000 247,000 310,100 531,200 31.1 1,895,700 41.6 1,243,500 27.3 1983 4,543,300 1,425,900 244,000 323,700 526,400 31.4 1,888,000 41.6 1,229,400 27.1 1982 4,531,900 1,428,500 235,000 335,600 525,800 31.5 1,873,100 41.3 1,230,300 27.2 1981 4,511,700 1,430,900 245,000 341,900 512,100 31.7 1,853,200 41.1 1,227,600 27.2 1980 4,430,300 1,410,000 237,000 341,500 501,800 31.8 1,823,400 41.2 1,196,900 27.0 1975 4,201,500 1,480,400 235,000 422,800 489,400 35.2 1,623,800 38.6 1,097,300 26.2 1970 3,692,600 1,410,900 232,000 409,200 457,600 38.2 1,334,300 36.1 947,400 25.7 1965 3,396,900 1,392,400 208,000 462,400 430,500 41.0 1,152,500 33.9 852,000 25.1 1960 3,004,100 1,266,800 150,000 495,700 407,000 42.2 1,003,800 33.4 733,500 24.4

1955 2,510,100 979,400 503,300 359,200 39.0 881,900 35.1 648,800 25.9

1950 2,199,900 885,900 528,800 293,800 40.3 740,000 33.6 574,000 26.1

%change

91-2002 -34.3 -69.1 -16.2 -26.3

91-2000 -31.1 -67.8 -11.6 -23.4

1990-91 37.7 31.2 32.9 51.1

1980-90 5.1 -3.3 6.1 13.5

1970-80 20.0 -0.1 36.7 26.3

1960-70 22.9 11.4 32.9 29.2

1950-60 36.6 43.0 35.6 27.8

1950-90 111.6 53.8 161.5 136.6

1) "Unmittelbarer öffentlicher Dienst" (core public administration)

2) without conscripts

3) i ncluding local special purpose associations

(17)

Tab. 2.2: Federal Departmental Staff, 2003

Department

1) 2) 3) 4)

Chancellory 464 277 59.7 140 30.2 48 14 6 1 Foreign Affairs 2,190 1,466 66.9 516 23.6 123 24 14 2

Interior 1,521 1,131 74.4 473 31.1 132 19 10 2 Justice 1,599 962 60.2 235 14.7 61 14 6 1

Finance 2,133 1,520 71.3 637 29.9 163 30 10 3 Economics/Labor 2,036 1,276 62.7 606 29.8 179 29 12 4

Food/Agriculture 954 716 75.1 332 34.8 86 14 6 1 Traffic/Housing 1,628 971 59.6 531 32.6 116 27 8 2

Defense 2,502 1,535 74.9 506 20.2 139 23 8 2 Health 1,191 690 57.9 330 27.7 103 18 8 2

Environment 719 428 59.5 246 34.2 63 13 6 1 Family/Females 441 301 68.3 133 30.2 50 9 4 1 Developm. Aid 591 380 64.3 204 34.5 58 8 3 1 Research 920 580 63.0 324 35.2 79 15 7 2 Fed. President 161 84 52.2 33 20.5 15 2 3 1 Accounting Off. 705 600 85.1 204 28.9 82 11 1 1 Total 19,755 12,917 65.9 5) 5,450 28.6 5) 1,497 270 112 27

1) Besoldungsgruppe B3

2) Besoldungsgruppe B6 (B7, B5) 3) Besoldungsgruppe B9

4) Besoldungsgruppe B11

5) Durchschnittliche prozentuale Anteile

Source: Federal Budget, 2003 (positions)

(18)

Year

2003 464 277 59.7 140 30.2 48 14 6 1 2002 480 284 59.2 145 30.2 51 15 6 1 2001 527 297 56.4 149 50.2 53 16 6 1 2000 530 297 56.0 152 51.2 55 16 6 1 1999 512 298 58.2 153 51.3 55 17 6 1 1998 482 280 58.1 139 49.6 51 14 6 - 1997 483 276 57.1 133 48.2 50 14 6 - 1996 491 281 57.2 134 47.7 49 14 6 - 1995 503 287 57.1 137 47.7 50 14 6 - 1994 510 289 56.7 137 47.4 49 14 6 - 1993 527 299 56.7 140 46.8 51 14 6 - 1992 529 307 58.0 148 48.2 52 15 6 - 1991 519 299 57.8 143 47.8 50 15 6 - 1990 485 275 56.7 131 47.6 46 14 5 1 1989 473 268 56.7 126 47.0 44 14 5 1 1988 481 271 56.3 128 47.2 46 14 5 1 1987 484 274 56.6 129 47.1 46 15 5 1 1986 482 273 56.6 128 46.9 48 12 5 1 1985 483 273 56.5 128 46.9 47 12 5 1 1984 477 267 56.0 124 46.4 45 11 5 1 1983 481 267 55.5 124 46.4 44 11 6 1 1982 470 261 55.5 118 45.2 39 11 5 1 1981 477 265 55.6 120 45.3 39 11 5 1 1980 477 265 55.6 120 45.3 40 11 5 1 1979 477 265 55.6 120 45.3 40 11 5 1 1978 474 265 55.9 120 45.3 40 11 5 1 1977 459 252 54.9 117 46.4 40 11 5 1 1976 454 247 54.4 121 49.0 40 13 4 2 1975 442 238 53.8 115 48.3 36 13 4 2 1974 431 229 53.1 108 47.2 35 12 4 1 1973 435 231 53.1 109 47.2 35 12 4 1 1972 410 207 50.5 104 50.2 32 12 4 1 1971 396 192 48.5 101 52.6 31 12 4 1 1970 395 192 48.6 101 52.6 30 12 4 1 1969 261 133 51.0 66 49.6 17 4 4 2 1968 256 132 51.6 66 50.0 17 4 4 2 1967 246 122 49.6 56 45.9 14 2 3 3 1966 216 110 50.9 48 43.6 13 3 3 2 1965 210 108 51.4 48 44.4 13 2 3 2 1964 190 101 53.2 45 44.6 11 3 2 2 1963 167 86 51.5 36 41.9 8 3 2 2 1962 168 84 50.0 35 41.7 8 3 2 1 1961 168 84 50.0 36 42.9 9 3 2 1 1960 170 82 48.2 36 43.9 9 3 2 1 1959 170 82 48.2 36 43.9 9 3 2 1 1958 169 81 47.9 35 43.2 8 3 2 1 1957 163 78 47.9 34 43.6 8 3 1 1 1956 156 73 46.8 30 41.1 7 3 1 1 1955 150 70 46.7 28 40.0 6 3 1 1 1954 148 67 45.3 28 41.8 6 3 1 1 1953 144 61 42.4 27 44.3 6 3 1 1 1952 144 61 42.4 27 44.3 6 3 1 1 1951 114 44 38.6 20 45.5 7 - 1 1 1950 114 44 38.6 20 45.5 7 - 1 1 1949 107 37 34.6 16 43.2 5 - 1 1

* Positions according to annual federal budgets

(19)

Table 2.4: Personnel by Federal Government Branch, 2003

Department Personnel

abs. %

Defense 121,262 42.6%

Economic Affairs and Labour 9,281 3.3%

Economic Co-Operation 607 0.2%

Education and Science 937 0.3%

Environment, Nature Protection, Reactor Safety 2,557 0.9%

Finance 47,357 16.6%

Food, Agriculture and Forestry 4,567 1.6%

Foreign Affairs 6,937 2.4%

Housing, Transport 25,866 9.1%

Interior 56,102 19.7%

Justice 4,106 1.4%

Health and Social Welfare 3,593 1.3%

Youth, Family, Women 1,453 0.5%

Total 284,625 100%

Source: http://www.bundesfinanzministerium.de/bundeshaushalt2003/index.html,

01.10.2004.

(20)

Table 2.5: State Personnel by Land, 1991-2002

1991 1992 1993 1994 1996 1998 2000 2002

difference 1991-2002 3 abs. %

East Berlin* 132,343 127,313 113,053 85,724 74,920 -- -- -- -- --

Brandenburg 82,500 73,766 70,032 76,421 76,259 74,896 72,829 71,143 -11,357 -13.8

Mecklenb.-Vorp. 69,800 63,021 58,185 58,742 58,379 57,641 56,063 54,306 -15,494 -22.2 Sachsen 166,566 135,880 130,999 134,585 135,203 130,641 119,442 116,660 -49,906 -30.0 Sachsen-Anhalt 95,712 93,815 92,679 93,482 90,406 88,324 83,345 79,154 -16,558 -17.3

Thüringen 87,547 89,982 87,439 85,639 84,536 78,913 76,940 71,939 -15,608 -17.8

Total East 1 634,468 583,777 556,387 534,593 519,703 430,415 408,619 393,202 -241,266 -38.0 Baden-Württemb. 270,625 274,348 278,994 286,595 281,996 278,868 255,570 262,334 -8,291 -3.1

Bayern 291,712 296,179 300,330 303,848 304,928 307,426 306,703 308,696 16,984 5.8

West Berlin* 206,874 204,708 202,545 183,031 177,919 236,513 225,999 162,949 -43,925 -21.2

Bremen* 48,699 48,977 48,314 48,116 37,890 36,012 42,911 42,139 -6,560 -13.5

Hamburg* 128,710 126,168 125,174 125,344 99,024 89,406 79,155 70,842 -57,868 -45.0 Hessen 157,819 160,323 166,946 165,362 165,611 164,986 155,030 126,034 -31,785 -19.1 Niedersachsen 212,924 211,959 213,461 216,518 213,852 208,290 203,554 206,279 -6,645 -3.1 Nordrhein-Westf. 410,088 413,765 410,932 409,958 418,628 416,150 412,998 397,617 -12,471 3.0 Rheinland-Pfalz 104,179 105,810 104,080 105,079 106,155 96,349 93,225 96,348 -7,831 -7.5

Saarland 34,125 33,878 31,190 31,180 31,013 29,679 29,412 29,222 -4,903 -14.4

Schleswig-Holstein 71,753 71,426 71,771 72,350 73,165 69,020 60,081 60,351 -11,402 -15.9 Total West 2 1,937,508 1,947,541 1,953,737 1,947,381 1,910,181 1,932,699 1,864,638 1,762,811 -174,697 -10.0

* Länder and local level employment are not differentiated in official statistics

1 Since 1997 without East Berlin

2 Since 1997 with East Berlin

3 Base for Berlin 1991: East + West; Total East 1991 without East Berlin, Total West with East Berlin

(21)

Table 2.6: Local Government Personnel by Land, 1991-2002

1991 1992 1993 1994 1996 1998 2000 2002

difference 1991-2002 abs. %

Brandenburg 131,486 121,046 98,527 84,763 70,441 62,599 57,801 51,773 -79,713 -60.7

Mecklenb.-Vorp. 96,474 84,836 65,538 58,095 46,394 40,986 38,366 35,189 -61,285 -63.5

Sachsen 200,306 210,311 178,320 156,076 137,655 117,884 106,398 94,300 -106,006 -52.9

Sachsen-Anhalt 129,464 130,901 110,893 100,507 86,968 77,349 71,783 65,795 -63,669 -49.2

Thüringen 103,775 107,644 85,777 76,636 65,557 55,664 50,450 43,911 -59,864 -57.7

Total East 661,505 644,733 539,055 520,307 407,015 354,482 324,798 290,968 -370,537 -56.0 Baden-Württemb. 247,344 255,263 254,502 248,947 232,808 218,175 212,116 215,638 -31,706 -12.8

Bayern 260,859 266,839 260,962 264,981 268,910 266,761 246,378 244,942 -15,917 -6.1

Hessen 146,807 151,209 151,534 147,197 128,462 125,019 122,650 118,946 -27,861 -19.0

Niedersachsen 165,901 169,645 167,233 167,925 160,959 158,844 149,939 143,569 -22,332 -13.5 Nordrhein-Westf. 364,815 365,706 362,751 356,727 339,519 326,301 319,740 304,516 -60,299 -16.5

Rheinland-Pfalz 69,399 71,249 70,126 69,005 64,018 63,941 61,382 62,371 -7,028 -10.1

Saarland 18,994 19,060 17,327 18,083 14,264 14,568 14,233 13,784 -5,210 -27.4

Schleswig-Holstein 60,232 61,486 60,616 57,496 55,534 52,656 50,975 46,981 -13,251 -22.0

Total West 1,334,351 1,360,457 1,345,051 1,330,361 1,264,474 1,226,265 1,177,413 1,150,747 -183,604 -13.8

(22)

Table 2.7: Population Ratios of State and Local Government Employment, 1991-2002

Employment per 1,000 Inhabitants

1991 1993 1995 1997 1999 2001 2002

Difference 1991-2002 1) State Local Total State Local Total State Local Total State Local Total State Local Total State Local Total State Local Total State Local Total Baden-Württemb. 27.3 25.5 52.8 27.4 25.5 52.9 28.0 23.6 51.6 27.0 21.9 48.9 26.8 20.3 47.1 24.3 20.1 44.4 24.6 20.2 44.8 -2.7 -5.3 -8.0 Bayern 25.3 25.0 50.3 25.4 24.4 49.9 25.4 24.6 50.0 25.8 22.1 47.9 25.3 21.4 46.7 24.9 19.9 44.8 24.9 19.8 44.7 -0.4 -5.2 -5.6 Hessen 27.2 25.9 53.1 28.1 26.0 54.1 27.5 23.9 51.5 27.4 20.9 48.3 26.3 20.5 46.8 20.2 19.8 40.0 20.7 19.5 40.2 -6.5 -6.4 -11.9 Niedersachsen 28.6 22.9 51.5 28.0 22.5 50.5 27.9 21.9 49.8 26.9 20.6 47.5 26.3 19.6 45.9 25.8 18.3 44.1 25.8 18.0 43.8 -2.8 -4.9 -7.7 Nordrhein-Westf. 23.5 21.6 45.1 23.2 21.1 44.3 23.2 20.1 43.3 23.3 18.4 41.7 23.0 17.9 40.9 21.9 17.3 39.2 22.0 16.8 38.8 -1.5 -4.8 -6.3 Rheinland-Pfalz 27.5 18.8 46.3 26.7 18.5 45.1 26.6 17.5 44.0 25.7 16.2 41.9 23.3 15.5 38.8 23.3 15.4 38.7 23.7 15.4 39.1 -3.8 -3.4 -7.2 Saarland 31.7 18.2 49.9 28.7 16.4 45.2 28.6 13.9 42.5 27.4 13.4 40.8 27.6 13.0 39.6 27.2 13.4 40.6 27.4 12.9 40.3 -4.3 -5.3 -9.6 Schleswig-Holstein 27.2 23.9 51.1 26.9 23.6 50.5 27.0 22.3 49.2 25.3 19.5 44.8 22.3 18.4 40.7 21.5 18.2 39.7 25.2 19.6 44.8 -2.0 -4.3 -6.3 Brandenburg 32.2 51.3 83.5 29.1 38.8 67.8 30.1 30.5 60.6 29.5 25.4 54.9 28.0 23.0 51.0 27.7 21.3 49.0 27.5 20.0 47.5 -4.7 -31.3 -36.0 Mecklenb.-Vorp. 36.6 50.6 87.2 31.4 35.4 66.8 32.0 28.8 60.8 32.1 24.1 56.2 31.7 21.8 53.5 30.9 20.4 51.3 31.1 20.2 54.3 -5.5 -30.4 -32.9 Sachsen 35.3 42.4 77.7 28.3 38.6 66.9 29.8 32.8 62.5 29.2 27.4 56.6 28.8 24.8 53.6 26.7 23.0 49.7 26.8 21.7 48.5 -8.5 -20.7 -29.2 Sachsen-Anhalt 33.6 45.5 79.0 33.2 39.8 73.0 33.6 34.1 67.7 33.3 29.4 62.7 32.3 28.3 60.6 31.2 26.4 57.6 31.1 25.8 56.9 -2.5 -19.7 -22.1 Thüringen 33.8 40.1 73.8 34.5 33.8 68.2 33.9 29.4 63.3 33.0 23.0 56.0 31.6 21.2 52.8 32.5 19.5 52.0 30.1 18.4 48.5 -3.7 -21.7 -25.3

East Berlin 103.3 87.0 61.0

West Berlin 95.6 93.1 82.7

Berlin Total 70.2 66.4 57.6 48.0 -22.2

Bremen 71.3 70.6 70.9 57.4 51.0 60.5 63.6 -7.7

Hamburg 77.5 73.7 59.1 55.6 47.1 44.6 41.0 -36.5

Berlin 1997 – 2002

(23)

Table 2.8: Administrative Units of Länder, 2002

Land Regional

Authorities

Cities Counties Townships

General Purpose Associations Berlin - 1 - 1 - Bremen - 2 - 2 - Hamburg - 1 - 1 - Baden-Württemberg 4 9 35 1,102 272 Bayern 7 25 71 2,031 319 Hessen 3 5 21 421 - Niedersachsen 4 9 38 1,017 140 Nordrhein-Westfalen 5 23 31 373 - Rheinland-Pfalz 3 12 24 2,294 163 Saarland - - 6 52 - Schleswig-Holstein - 4 11 1,126 119 Total West 2002

1960

26 33

91 137

237 425

8,420 24,371

1,012 - Brandenburg - 4 14 1,088 130 Mecklenburg-Vorpommern - 6 12 983 117 Sachsen 3 7 22 532 126 Sachsen-Anhalt 3 3 21 1,269 187 Thüringen - 6 17 1,011 135 Total East 2002 6 26 86 4,883 695 1989 15 n.a. 1 227 7,565 1 - Total 2002 32 117 323 13,735 1,687

1 Cities and counties not differentiated in official GDR-statistics

Source: Statistisches Jahrbuch Deutscher Gemeinden 2002

(24)

Table 2.9: Local Government Employment, 1970-2002

Total Local Govt. Empl.

County City Township General

Purpose Association

Regional Association

Special Purpose Association

Year Landkreis kreisfreie Stadt

kreisang.

Gemeinde

Verwaltungs- gemeinschaft

Bezirks- verband

komm.

Zweckverb.

2002 1,512,719 297,139 463,236 580,313 42,451 58,576 71,004 2001 1,537,071 292,182 492,922 582,499 44,690 57,362 67,416 2000 1,502,211 299,165 503,470 590,461 45,745 63,370 69,788 1999 1,537,321 317,373 512,355 598,398 45,903 63,292 72,387 1998 1,580,747 327,616 536,752 602,653 46,879 66,847 67,737 1997 1,615,175 336,089 553,540 612,058 46,154 67,334 68,166 1996 1,739,261 347,165 567,064 639,889 48,870 68,501 67,772 1995 1,801,549 358,327 592,423 665,541 49,167 70,190 65,901 1994 1) 1,873,285 368,064 621,813 699,751 66,815 1990 1,358,026 260,921 483,220 470,063 25,678 65,047 53,097 1989 1,327,120 251,934 474,718 461,715 25,380 62,738 50,635 1988 1,326,885 250,699 471,581 466,782 26,155 61,510 50,158 1987 1,326,001 249,807 469,546 469,355 26,150 60,221 50,922 1986 1,303,541 243,312 465,876 462,005 25,812 57,784 48,752 1985 1,268,896 236,105 457,468 446,600 24,867 55,982 47,874 1984 1,243,493 229,801 451,423 436,467 24,407 54,872 46,523 1983 1,229,481 227,881 448,156 428,344 23,718 55,774 45,608 1982 1,230,303 222,617 452,770 432,852 23,237 55,889 42,938 1981 1,227,624 219,652 453,326 434,470 22,963 55,381 41,832 1980 2) 1,125,686 209,555 466,746 371,135 18,254 52,840 40,156 1979 1,174,929 211,320 441,849 406,094 22,947 51,209 41,510 1978 3) 869,830 159,984 367,827 282,699 13,887 45,433

1977 852,457 155,459 364,805 274,311 14,043 43,839 1976 846,967 153,838 360,575 275,249 14,479 42,826 1975 850,132 153,595 368,283 271,950 13,900 42,404 1974 825,076 151,959 365,421 248,907 17,460 41,329 1973 816,364 144,924 373,350 239,625 17,926 40,539 1972 801,859 136,385 378,217 233,929 13,919 39,409 1971 780,005 130,921 380,832 216,860 12,969 38,423 1970 757,883 122,102 376,301 210,834 12,248 36,398

1) 1991-1993 data for new Länder due to local government reorganization not available

2) without part-time t2 (less than half of regular work-time)

3) 1970-1978 full-time personnel

(25)

3.1a: Total Employment by Task Area, 1960 - 2002

Task Areas

Year 1) 2)

Total

2002 627,700 126,768 184,058 438,024 192,493 1,296,778 317,850 373,841 27,836 154,190 86,741 -- 62,124 69,491 19,831 587,954 243,411 4,809,090

2001 629,753 129,865 183,431 436,747 192,435 1,325,000 315,726 391,322 28,185 160,887 92,838 -- 66,360 74,957 20,806 545,065 227,756 4,821,133

2000 644,400 133,800 185,400 437,900 194,000 1,554,700 196,500 414,800 31,200 167,800 98,900 -- 73,600 75,400 22,900 488,000 189,600 4,908,900

1999 658,300 136,800 189,800 440,200 195,200 1,598,700 196,600 430,200 29,700 170,100 100,600 -- 78,400 82,600 22,800 457,300 182,100 4,969,400

1998 667,100 136,700 190,200 442,600 197,000 1,632,800 204,000 459,600 30,000 178,800 103,300 -- 91,800 94,600 23,400 449,300 167,500 5,068,700

1997 676,600 143,700 191,800 446,900 196,500 1,660,300 214,700 481,900 30,200 187,600 107,500 -- 101,600 100,700 23,000 450,500 150,300 5,163,800

1996 694,500 149,000 190,800 450,100 196,500 1,676,400 225,100 511,000 31,900 202,900 112,600 -- 111,600 104,500 25,800 462,600 131,200 5,276,500

1995 707,100 156,000 194,300 449,700 197,200 1,668,200 259,300 550,800 33,200 211,800 117,200 -- 119,800 115,000 26,900 449,900 114,800 5,371,000

1994 725,300 165,000 212,700 446,400 195,800 1,690,600 262,100 598,900 35,000 221,400 120,300 605,000 128,500 123,300 29,400 428,000 106,600 6,094,300

1993 704,700 175,000 230,900 435,600 190,700 1,670,400 268,100 624,100 37,600 210,300 121,400 636,700 417,700 175,700 28,400 387,900 187,400 6,502,600

1992 711,100 187,000 245,800 424,500 186,100 1,748,300 272,900 660,600 40,200 226,800 128,700 641,500 434,000 187,000 28,000 352,200 182,500 6,657,200

1991 725,800 205,000 257,300 421,800 181,200 1,740,800 295,100 682,600 37,500 216,700 125,300 663,500 473,800 182,700 33,300 325,100 170,100 6,737,800

1990 3) 480,300 165,000 244,000 312,300 145,100 809,200 140,600 354,000 22,900 165,300 101,000 439,200 246,600 133,000 19,600 216,800 52,900 4,047,800

1985 480,400 172,000 250,000 299,400 137,200 836,600 129,700 344,900 26,400 155,100 103,000 439,800 294,700 130,700 21,700 217,600 35,200 4,074,400

1980 479,000 172,000 237,000 291,000 125,500 849,700 124,300 332,700 25,500 150,200 103,700 425,700 338,000 130,400 20,500 203,500 29,700 4,038,400

1975 457,200 178,000 235,000 258,800 117,800 761,900 115,300 297,000 22,400 133,100 112,700 419,300 417,900 136,800 21,700 198,100 21,300 3,904,300

1970 413,800 171,000 232,000 226,500 106,600 576,900 106,600 241,100 22,000 111,500 121,500 401,900 404,800 153,600 21,500 166,500 19,300 3,497,100

1965 400,000 155,000 208,000 207,900 99,000 455,300 111,700 206,500 19,900 106,800 110,100 387,100 458,200 176,300 19,100 150,200 17,200 3,288,300

1960 370,800 86,000 150,000 184,000 93,000 361,800 111,200 173,000 20,500 91,400 93,500 359,500 489,900 201,600 16,600 140,500 15,500 2,958,800

1) without conscripts 2) including local special purpose associations 3) 1960-1990 full-time personnel

(26)

Task Areas in%

Year 1

)

2)

Total

2002 13.1 2.6 3.8 9.1 4.0 27.0 6.6 7.8 0.6 3.2 1.8 -- 1.3 1.4 0.4 12.2 5.1 4,809,090

2001 13.1 2.7 3.8 9.1 4.0 27.5 6.5 8.1 0.6 3.3 1.9 -- 1.4 1.6 0.4 11.3 4.7 4,821,133

2000 13.1 2.7 3.8 8.9 4.0 31.7 4.0 8.4 0.6 3.4 2.0 -- 1.5 1.5 0.5 9.9 3.9 4,908,900

1999 13.2 2.8 3.8 8.9 3.9 32.2 4.0 8.7 0.6 3.4 2.0 -- 1.6 1.7 0.5 9.2 3.7 4,969,400

1998 13.2 2.7 3.8 8.7 3.9 32.2 4.0 9.1 0.6 3.5 2.0 -- 1.8 1.9 0.5 8.9 3.3 5,068,700

1997 13.1 2.8 3.7 8.7 3.8 32.2 4.2 9.3 0.6 3.6 2.1 -- 2.0 2.0 0.4 8.7 2.9 5,163,800

1996 13.2 2.8 3.6 8.5 3.7 31.8 4.3 9.7 0.6 3.8 2.1 -- 2.1 2.0 0.5 8.8 2.5 5,276,500

1995 13.2 2.9 3.6 8.4 3.7 31.1 4.8 10.3 0.6 3.9 2.2 -- 2.2 2.1 0.5 8.4 2.1 5,371,000

1994 11.9 2.7 3.5 7.3 3.2 27.8 4.3 9.8 0.6 3.6 2.0 9.9 2.1 2.0 0.6 7.0 1.7 6,094,300

1993 10.8 2.7 3.5 6.7 2.9 25.7 4.1 9.6 0.6 3.2 2.0 9.8 6.4 2.7 0.4 6.0 2.9 6,502,600

1992 10.7 2.8 3.7 6.4 2.8 26.3 4.1 9.9 0.6 3.4 1.9 9.6 6.5 2.8 0.5 5.3 2.7 6,657,200

1991 10.8 3.0 3.8 6.3 2.7 25.8 4.4 10.1 0.6 3.2 1.9 9.9 7.0 2.7 0.5 4.8 2.5 6,737,800

1990 3) 11.9 4.1 6.0 7.5 3.6 20.0 3.5 8.7 0.6 4.1 2.5 10.8 6.1 3.3 0.5 5.4 1.3 4,047,800

1985 11.8 4.2 6.1 7.4 3.4 20.5 3.2 8.5 0.6 3.8 2.5 10.8 7.2 3.2 0.5 5.4 0.9 4,074,400

1980 11.9 4.3 5.8 7.2 3.1 21.1 3.1 8.3 0.6 3.7 2.6 10.5 8.4 3.2 0.5 5.0 0.7 4,038,400

1975 11.7 4.6 6.0 6.6 3.0 19.5 3.0 7.6 0.6 3.4 2.9 10.7 10.7 3.5 0.6 5.1 0.5 3,904,300

1970 11.8 4.9 6.6 6.5 3.1 16.5 3.0 6.9 0.6 3.2 3.5 11.5 11.6 4.4 0.6 4.8 0.5 3,497,100

1965 12.2 4.7 6.3 6.3 3.0 13.9 3.4 6.3 0.6 3.2 3.3 11.8 13.9 5.4 0.6 4.6 0.5 3,288,300

1960 12.5 2.9 5.1 6.2 3.1 12.2 3.7 5.8 0.7 3.1 3.2 12.2 16.6 6.8 0.6 4.8 0.5 2,958,800

1) without conscripts 2) including local special purpose associations 3) 1960-1990 full-time personnel

(27)

Table 3.2: General Administration, 1960-2002

Year

Total Federal % of Total

Länder % of Total

Local % of Total 2002 627,700 76,500 12.2 267,500 42.6 283,600 45.2 2001 629,800 76,800 12.2 268,200 42.6 284,200 45.2 2000 644,400 78,000 12.1 275,000 42.7 291,400 1) 45.2 1999 658,300 78,500 11.9 285,700 43.4 294,100 44.7 1998 667,100 79,100 11.9 289,600 43.4 298,400 44.7 1997 676,600 80,500 11.9 299,300 44.2 296,800 43.9 1996 694,500 75,600 10.9 308,800 44.5 310,100 44.6 1995 707,100 82,100 11.6 313,100 44.3 311,900 44.1 1994 725,300 83,800 11.5 315,800 43.5 325,700 44.9 1993 704,700 84,800 12.0 308,300 43.7 311,600 44.2 1992 711,100 87,700 12.3 299,100 42.1 324,300 45.6 1991 725,800 88,800 12.2 321,400 44.3 315,600 43.5 1990* 480,300 71,400 14.9 216,900 45.2 192,000 40.0 1989 482,800 70,900 14.7 216,100 44.8 195,800 40.5 1988 488,500 71,000 14.5 220,200 45.1 197,300 40.4 1987 490,200 70,600 14.4 219,100 44.7 200,500 40.9 1986 484,500 70,300 14.5 219,300 45.3 194,900 40.2 1985 480,400 70,200 14.6 217,200 45.2 193,000 40.2 1984 475,500 70,500 14.8 215,300 45.3 189,700 39.9 1983 475,400 70,700 14.9 215,900 45.4 188,800 39.7 1982 479,800 71,300 14.9 217,200 45.3 191,300 39.9 1981 482,600 71,600 14.8 219,700 45.5 191,300 39.6 1980 479,000 70,600 14.7 219,300 45.8 189,100 39.5 1975 457,200 73,000 16.0 208,200 45.5 176,000 38.5 1970 413,800 70,100 17.0 184,600 44.6 159,100 38.4 1965 400,000 71,600 17.9 173,700 43.4 154,700 38.7 1960 370,800 70,200 18.9 157,400 42.5 143,200 38.6

% change

91-2002 -13.5 -13.9 -16.8 -10.1

91-2000 -11.2 -12.2 -14.4 -7.7

1980-90 0.3 1.1 -1.1 1.5

1970-80 15.6 0.7 18.8 18.9

1960-70 11.6 -0.4 17.3 11.1

1960-90 29.5 1.7 37.8 34.1

* 1960-1990 full-time personnel

1) since 2000 incl. Bauverwaltung

(28)

Year Professional Military 1)

Civilian Admin.

Total

2002 184 127 312 2001 183 130 314 2000 185 134 320 1999 190 137 327 1998 191 138 329 1997 192 143 335

1996 190 138 328

1995 194 156 350

1994 213 165 378

1993 231 175 406

1992 246 187 433

1991 257 205 462

1990 2) 244 165 409

1989 247 167 414

1988 250 169 419

1987 251 171 422

1986 249 171 420

1985 250 172 422

1984 247 171 418

1983 244 172 416

1982 235 172 407

1981 245 172 417

1980 237 172 409

1975 235 178 413

1970 232 171 403

1965 208 155 363

1960 150 86 236

% change

91-2002 -28.4 -38.0 -32.5

91-2000 -28.0 -34.6 -30.7

1980-90 3.0 -4.1 0.00

1970-80 2.2 0.6 1.5

1960-70 54.7 98.8 70.8

1960-90 62.7 91.9 73.3

1) without conscripts (in 1,000)

2) 1960-1990 full-time personnel

(29)

Table 3.4: Police, Security and Public Order, 1960-2002

Year

Total Federal % of Total

Länder % of Total

Local % of Total 2002 438,000 43,000 9.8 287,500 65.6 114,600 26.2 2001 436,800 42,700 9.8 287,100 65.7 114,200 1 26.1 2000 437,900 42,400 9.7 289,100 66.0 106,400 24.3 1999 440,200 43,100 9.8 291,400 66.2 105,700 24.0 1998 442,600 44,300 10.0 294,100 66.4 104,200 23.5 1997 446,900 45,000 10.0 296,300 66.3 105,600 23.6 1996 450,100 43,600 9.7 297,700 66.1 108,800 24.2 1995 449,600 44,600 9.9 297,100 66.1 107,900 24.0 1994 446,400 42,600 9.5 297,200 66.6 106,600 23.9 1993 435,600 38,000 8.7 291,900 67.0 105,700 24.3 1992 424,500 34,800 8.2 285,100 67.2 104,600 24.6 1991 421,800 34,900 8.3 287,400 68.2 99,500 23.6 1990* 312,300 27,700 8.9 216,000 69.2 68,600 22.0 1989 305,300 27,900 9.1 212,600 69.6 64,700 21.2 1988 302,800 27,700 9.1 211,500 69.9 63,600 21.0 1987 301,900 27,200 9.0 211,600 70.1 63,100 20.9 1986 300,400 27,400 9.1 211,700 70.5 61,300 20.4 1985 299,400 27,700 9.2 211,800 70.7 59,900 20.0 1984 298,600 28,100 9.4 211,600 70.9 58,900 19.7 1983 299,600 28,800 9.6 212,000 70.8 58,800 19.6 1982 298,800 29,400 9.8 209,500 70.1 59,900 20.1 1981 295,100 29,300 9.9 207,800 70.4 58,000 19.7 1980 291,000 28,800 9.9 204,500 70.3 57,700 19.8 1975 258,800 26,700 10.3 175,600 67.9 56,500 21.8 1970 226,500 21,500 9.4 144,500 63.8 60,500 26.7 1965 207,900 20,600 9.9 130,500 62.8 56,800 27.3 1960 184,000 17,600 9.6 118,000 64.1 48,400 26.3

% change

91-2002 3.8 23.2 0.3 15.2 1

91-2000 3.8 21.5 0.6 6.9

1980-90 7.3 -3.8 5.6 18.9

1970-80 28.5 33.9 41.5 -4.6

1960-70 23.1 22.2 22.5 25.0

1960-90 69.7 57.4 83.1 41.7

* 1960-1990 full-time personnel

1) local: bis 2000 nur Vollzeitbeschäftigte

(30)

Year

Total Federal % of Total

Länder % of Total 2002 192,500 4,300 2.2 188,200 97.8 2001 192,400 4,200 2.2 188,200 97.8 2000 194,000 4,300 2.2 189,700 97.8 1999 195,200 4,300 2.2 190,900 97.8 1998 196,800 4,400 2.2 192,400 97.8 1997 196,500 4,500 2.3 192,000 97.7 1996 196,500 4,100 2.1 192,400 97.9 1995 197,200 4,700 2.4 192,500 97.6 1994 195,800 4,800 2.5 191,000 97.5 1993 190,700 5,000 2.6 185,700 97.4 1992 186,100 4,900 2.6 181,200 97.4 1991 181,200 4,800 2.6 176,400 97.4 1990 * 145,100 3,900 2.7 141,200 97.3

1989 141,700 2,100 1.4 139,600 98.5 1988 141,600 1,900 1.3 139,700 98.7 1987 140,300 1,800 1.3 138,500 98.7 1986 138,300 1,800 1.3 136,500 98.7 1985 137,200 1,800 1.3 135,400 98.7 1984 134,000 1,800 1.3 132,200 98.7 1983 133,400 1,800 1.3 131,600 98.7 1982 130,500 1,900 1.5 128,600 98.5 1981 128,600 1,900 1.5 126,700 98.5 1980 125,500 2,000 1.6 123,500 98.4 1975 117,800 1,900 1.6 115,900 98.4 1970 106,600 1,700 1.6 104,900 98.4 1965 99,000 1,500 1.5 97,500 98.5 1960 93,000 1,200 1.3 91,800 98.7

% change

91-2002 6.2 -10.4 6.7

91-2000 7.1 -10.4 7.5

1980-90 15.2 95.0 14.3

1970-80 17.7 17.6 17.7

1960-70 14.6 41.7 14.3

1960-90 56.0 225.0 53.8

* 1960-1990 full-time personnel

(31)

Table 3.6: Education and Research, 1960-2002

Year

Total Federal % of Total

Länder % of Total

Local % of Total 2002 1,296,800 11,800 1.0 1,106,700 85.3 182,400 14.1 2001 1,328,000 12,100 1.0 1,132,900 85.3 188,500 14.2

2000 1,554,700 15,400 1.0 1,216,600 78.3 322,700 20.8

1999 1,598,700 15,600 1.0 1,256,000 78.6 327,100 20.5 1998 1,632,800 16,300 1.0 1,285,500 78.7 331,000 20.3 1997 1,660,300 16,800 1.0 1,299,900 78.3 343,600 20.7 1996 1,676,400 14,600 0.9 1,300,000 77.5 361,800 21.6 1995 1,668,200 17,400 1.0 1,288,000 77.2 362,800 21.7 1994 1,690,600 18,200 1.1 1,281,400 75.8 391,000 23.1 1993 1,670,400 18,300 1.1 1,273,900 76.3 378,200 22.6 1992 1,748,300 15,300 0.9 1,296,500 74.2 436,500 25.0 1991 1,740,800 14,200 0.8 1,318,000 75.7 408,600 23.5 1990* 809,200 10,100 1.3 685,600 84.7 113,500 14.0

1989 797,700 10,200 1.3 678,600 85.1 108,900 13.6 1988 806,600 10,100 1.2 687,800 85.3 108,700 13.5 1987 816,400 9,800 1.2 697,900 85.5 108,700 13.3 1986 825,700 9,400 1.2 709,500 85.9 106,800 12.9 1985 836,600 9,400 1.1 721,400 86.2 105,800 12.7 1984 847,200 9,400 1.1 733,800 86.6 104,000 12.3 1983 857,200 9,400 1.1 744,700 86.9 103,100 12.0 1982 864,600 9,200 1.1 753,400 87.1 102,000 11.8 1981 857,500 9,400 1.1 746,100 87.0 102,000 11.9 1980 849,700 9,300 1.1 739,100 87.0 101,300 11.9 1975 761,900 8,200 1.1 659,700 86.6 94,000 12.3 1970 576,900 7,400 1.3 504,700 87.5 64,800 11.2 1965 455,300 5,900 1.3 391,800 86.1 57,600 12.7 1960 361,800 5,200 1.4 309,600 85.6 47,000 13.0

% change

91-2002 -25.5 -16.9 -16.0 -55.4

91-2000 -10.7 8.5 -7.7 -21.0

1980-90 -4.8 8.6 -7.2 12.0

1970-80 47.3 25.7 46.4 56.3

1960-70 59.4 42.3 63.0 37.9

1960-90 123.7 94.2 121.4 141.5

* 1960-1990 full-time personnel

(32)

Year

Total Federal % of Total

Länder % of Total

Local % of Total 2002 317,800 3,800 1.2 59,900 18.8 254,100 80.0 2001 315,700 3,700 1.2 59,400 18.8 252,600 80.0 2000 196,400 3,900 2.0 64,800 33.0 127,700 65.0 1999 196,600 4,000 2.0 65,000 33.1 127,600 64.9 1998 203,900 4,100 2.0 70,100 34.4 129,700 63.6 1997 214,700 4,300 2.0 78,400 36.5 132,000 61.5 1996 225,100 4,200 1.9 78,400 34.8 142,500 63.3 1995 259,200 6,000 2.3 83,500 32.2 169,700 65.5 1994 262,100 6,200 2.4 88,300 33.7 167,600 63.9 1993 268,100 4,700 1.8 91,400 34.1 172,000 64.2 1992 272,900 3,000 1.1 94,000 34.4 175,900 64.5 1991 295,100 2,800 0.9 78,400 26.6 213,900 72.5 1990* 140,600 2,000 1.4 49,700 35.3 88,900 63.2

1989 139,200 1,600 1.1 50,500 36.3 87,100 62.6 1988 137,500 1,300 0.9 49,500 36.0 86,700 63.1 1987 137,700 1,200 0.9 49,600 36.0 86,900 63.1 1986 132,900 1,100 0.8 49,600 37.3 82,200 61.9 1985 129,700 1,100 0.8 52,000 40.1 76,600 59.1 1984 128,800 1,100 0.8 52,400 40.7 75,300 58.5 1983 127,500 1,100 0.9 51,700 40.5 74,700 58.6 1982 125,700 1,100 0.9 50,600 40.2 74,000 58.9 1981 126,000 1,100 0.9 50,900 40.4 74,000 58.7 1980 124,300 1,000 0.8 51,100 41.1 72,200 58.1 1975 115,300 800 0.7 49,500 42.9 65,000 56.4 1970 106,600 700 0.7 46,200 43.3 59,700 56.0 1965 111,700 800 0.7 52,500 47.0 58,400 52.3 1960 111,200 1,000 0.9 55,700 50.1 54,500 49.0

% change

91-2002 7.1 35.7 -23.6 18.8

91-2000 -33.4 39.3 -17.4 -40.3

1980-90 13.1 100.0 -2.4 23.1

1970-80 16.6 42.9 10.6 20.9

1960-70 -4.1 -30.0 -17.1 9.5

1960-90 26.4 100.0 -10.8 63.1

* 1960-1990 full-time personnel

(33)

Table 3.8: Health, Environment and Recreation, 1960-2002

Year

Total Federal % of Total

Länder % of Total

Local % of Total 2002 362,800 5,500 1.5 47,600 13.1 309,700 85.4 2001 378,900 5,200 1.4 49,500 13.1 324,200 85.5 2000 414,800 2,000 0.5 69,900 16.9 342,900 82.7 1999 430,200 2,100 0.5 60,200 14.0 367,900 85.5 1998 459,400 2,100 0.5 67,200 14.6 390,100 84.9 1997 481,900 2,100 0.4 71,700 14.9 408,100 84.7 1996 511,000 1,700 0.3 83,500 16.3 425,800 83.3 1995 550,800 2,100 0.4 106,300 19.3 442,400 80.3 1994 598,900 1,700 0.3 126,000 21.0 471,200 78.7 1993 624,100 1,700 0.3 129,000 20.7 493,400 79.1 1992 660,600 1,800 0.3 135,800 20.6 523,000 79.2 1991 682,600 1,500 0.2 150,300 22.0 530,800 77.8 1990* 354,000 1,000 0.3 68,400 19.3 284,600 80.4 1989 349,400 700 0.2 66,100 18.9 282,600 80.9 1988 352,100 700 0.2 68,800 19.5 282,600 80.3 1987 353,500 600 0.2 68,600 19.4 284,300 80.4 1986 347,800 600 0.2 69,100 19.9 278,100 79.9 1985 344,900 600 0.2 70,300 20.4 274,000 79.4 1984 339,600 600 0.2 70,000 20.6 269,000 79.2 1983 338,100 600 0.2 69,700 20.6 267,800 79.2 1982 335,400 500 0.2 68,600 20.4 266,300 79.4 1981 340,100 500 0.2 68,900 20.3 270,700 79.6 1980 332,700 500 0.2 68,400 20.6 263,800 79.3 1975 297,000 300 0.1 66,700 22.5 230,000 77.4 1970 241,100 100 0.1 60,000 24.9 181,000 75.1 1965 206,500 0 -- 58,500 28.3 148,000 71.7 1960 173,000 0 -- 51,000 29.5 122,000 70.5

% change

91-2002 -46.9 266.7 -68.3 -41.7

91-2000 -39.2 33.3 -53.5 -35.4

1980-90 6.4 100.0 -0.0 7.9

1970-80 38.0 400.0 14.0 45.8

1960-70 39.4 17.6 48.4

1960-90 104.6 34.1 133.3

* 1960-1990 full-time personnel

(34)

Year Total Federal % of Total

Länder % of Total

Local % of Total 2002 27,800 400 1.4 26,000 93.6 1,400 5.0 2001 28,200 400 1.4 26,100 92.6 1,700 6.0 2000 31,200 400 1.3 29,000 92.9 1,800 5.8 1999 29,700 400 1.4 27,500 93.5 1,500 5.1 1998 29,900 400 1.3 27,600 92.3 1,900 6.4 1997 30,200 400 1.3 27,800 92.1 2,000 6.6 1996 31,900 300 0.9 28,800 90.3 2,800 8.8 1995 33,300 500 1.5 29,300 88.0 3,500 10.5 1994 35,000 900 2.6 31,000 88.6 3,100 8.8 1993 37,600 900 2.4 34,000 90.4 2,700 7.2 1992 40,200 900 2.2 34,200 85.1 5,100 12.7 1991 37,500 900 2.4 31,800 84.8 4,800 12.8 1990 * 22,900 600 2.6 20,400 89.1 1,900 8.3

1989 23,200 600 2.6 20,400 87.9 2,200 9.5 1988 24,200 600 2.5 21,300 88.0 2,300 9.5 1987 24,500 700 2.9 21,500 87.7 2,300 9.4 1986 25,000 700 2.8 22,100 88.4 2,200 8.8 1985 26,400 700 2.6 21,900 83.0 3,800 14.4 1984 26,500 700 2.6 22,100 83.4 3,700 14.0 1983 26,500 700 2.6 22,200 83.8 3,600 13.6 1982 26,300 600 2.3 22,000 83.6 3,700 14.1 1981 25,700 600 2.3 21,800 84.8 3,300 12.8 1980 25,500 600 2.4 21,600 84.7 3,300 13.0 1975 22,400 500 2.2 19,900 88.8 2,000 9.0 1970 22,000 500 2.3 19,900 90.4 1,600 7.3 1965 19,900 400 2.0 18,000 90.5 1,500 7.5 1960 20,500 400 2.0 18,700 91.2 1,400 6.8

% change

91-2002 -25.9 -55.6 -18.2 -70.8

91-2000 -16.8 -55.6 -8.8 -62.5

1980-90 -10.2 -- -5.6 -42.4

1970-80 15.9 20.0 8.5 106.3

1960-70 7.3 25.0 6.42 14.3

1960-90 11.7 50.0 9.1 35.1

* 1960-1990 full-time personnel

Abbildung

Table 1.1: Total Public Employment, Population and Labor Force Ratios, 1950-2002   Year  Public Employment
Table 1.2: Core Public Administration and Semi-State Employment (in 1,000), 1950-2002  Year  Core   Public Adm
Tab. 2.2: Federal Departmental Staff, 2003   Department  1)  2)  3)  4)  Chancellory  464       277  59.7    140  30.2      48     14      6       1  Foreign Affairs  2,190  1,466  66.9 516  23.6  123  24  14  2  Interior 1,521  1,131 74.4 473 31.1 132  19
Table 2.5: State Personnel by Land, 1991-2002   1991  1992  1993  1994  1996  1998  2000  2002  difference 1991-20023     abs
+7

Referenzen

ÄHNLICHE DOKUMENTE

These shifts in the local conceptions of crime, in the conception of citizenship and in the conception of the legitimacy of state violence are embedded in global

This paper considers corruption in higher education as a product of interrelations between the government and academia and argues that suppressed university autonomy is used by the

The point is that only the human sciences are entangled with normativity in a special and much more far-reaching way, namely simply because only the human sciences deal

According to Alejandro Quiroz Flores, the modern state holds two comparative advantages over other forms of political organization — it is far better at directing large and

China has used the move as a pretext to challenge Japanese administration of the islands by deploying ships and aircraft to patrol the adjacent waters.. In a departure from

Together, these two conditions – the advance of technology due to international anarchy and the Hegelian struggle towards symmetrical recognition – make a world state

We exploit the fact that the economies of medieval and early modern Europe were predominantly agrarian and use exogenous variation in temperature during the growing season to

In the history of political and economic culture of the world, facts have suggested that, while considering the relevant issues, intellectual effect can very well prevent the