• Keine Ergebnisse gefunden

Characterization of potato plants overexpressing plastidic transporters involved in starch metabolism

N/A
N/A
Protected

Academic year: 2021

Aktie "Characterization of potato plants overexpressing plastidic transporters involved in starch metabolism"

Copied!
134
0
0

Wird geladen.... (Jetzt Volltext ansehen)

Volltext

(1)

overexpressing plastidic transporters involved in starch metabolism

Inaugural-Dissertation zur

Erlangung des Doktorgrades

der Mathematisch-Naturwissenschaftlichen Fakultät der Universität zu Köln

vorgelegt von

Lizhi Zhang

aus Hebei Provinz, China

Köln 2005

(2)

Prof. Dr. S. Waffenschmidt

Tag der letzten mündlichen Prüfung: 07. 12. 2005

(3)

CONTENTS

1. INTRODUCTION……….. 1

1.1. History of the cultivated potato……… 1

1.2. Taxonomy and characteristics of potato………... 1

1.3. Importance of potato……… 2

1.4. Metabolic pathway relevant to starch synthesis………... 2

1.5. Starch degradation……… 6

1.6. Transgenic plants……….. 7

1.6.1. Genetic modification (GM) technology………. 7

1.6.2. Methods of transformation………. 8

1.6.3. Transgenic potato plants………. 8

1.7. Promoters………. 9

1.7.1. Cauliflower mosaic virus 35S (CaMV 35S) promoter…………... 9

1.7.2. Patatin promoter B33………. 9

1.7.3. Bidirectionalization of polar promoters………. 10

1.8. Plastidic translocators………... 10

1.8.1. Phosphate translocators……….. 11

1.8.1.1. Glucose 6-phosphate/phosphate translocator (GPT)………… 11

1.8.2. Plastidic ATP/ADP translocator (NTT)……….. 12

1.9. Outline of the thesis………. 13

2. MATERIALS AND METHODS……….. 14

2.1. Materials………... 14

2.1.1. Chemicals and Enzymes………. 14

2.1.2. Commercial Kits……… 14

2.1.3. Plant material……… 14

2.1.4. Bacterial strains and cloning vectors……….. 15

2.1.5. Primers………... 15

2.1.6. Media……….. 17

2.1.7. Buffers and Solutions………. 18

2.2. Methods……… 19

2.2.1. DNA extraction from agarose……… 19

2.2.2. Plasmid DNA extraction from E.coli……….. 19

(4)

2.2.3. Nucleic acid manipulation……….. 20

2.2.3.1. A-tailing of PCR products……… 20

2.2.3.2. Dephosphorylation……… 21

2.2.3.3. Ligation………. 21

2.2.4. Transformation………... 22

2.2.4.1. Transformation of E.coli………... 22

2.2.4.1.1. Preparation of TSS-competent host cells……….. 22

2.2.4.1.2. Transformation……….. 22

2.2.4.1.3. Screening………... 23

2.2.4.2. Transformation of A. tumefaciens………. 23

2.2.4.2.1. Preparation of electro-competent cells……….. 23

2.2.4.2.2. Transformation……….. 24

2.2.4.3. Transformation and regeneration of transgenic potato plants.. 24

2.2.5. Plant growth conditions……… 26

2.2.6. Isolation of plant genomic DNA for PCR……….. 26

2.2.7. Isolation of plant total RNA………... 27

2.2.7.1. Isolation of total RNA from potato leaves……… 27

2.2.7.2. Isolation of total RNA from potato tubers……… 28

2.2.8. Concentration measurement of DNA and RNA………. 28

2.2.9. PCR amplification analysis……… 28

2.2.9.1. PCR amplification of plasmid DNA………. 28

2.2.9.2. PCR amplification assays of transformed plants……….. 29

2.2.10. Reverse transcription PCR amplification analysis……….. 29

2.2.10.1. Reverse transcription……… 29

2.2.10.2. PCR amplification……… 30

2.2.11. RNA Northern blot analysis……… 30

2.2.12. Radioactive labeling of DNA probes………... 31

2.2.13. Extraction and measurement of potato tubers’ starch, sugar and phosphorylated intermediates………... 32

2.2.13.1. Extraction and measurement of potato tubers’ starch……….. 32

2.2.13.2. Extraction and measurement of potato tubers’ sugar………... 33

2.2.13.3. Extraction and measurement of potato leaves’ sugar and

starch………. 34

(5)

2.2.14. Measurement of transporters’ activities……….. 37

2.2.14.1. Measurement of glucose-6-phosphate/phosphate transloctor’s activity……….. 37

2.2.14.1.1. Purification of phospholipids………. 37

2.2.14.1.2. Preparation of liposomes……… 38

2.2.14.1.3. Extraction of proteins and preparation of proteoliposomes……….. 38

2.2.14.1.4. Transport experiment………. 39

2.2.14.2. Measurement of ATP/ADP translocator’s activity……….. 40

2.2.14.2.1. Extraction of proteins and preparation of proteoliposomes……….. 40

2.2.14.2.2. Transport experiment……….. 41

2.2.15.

14

CO

2

feeding experiments……….. 41

2.2.16. Photosynthesis measurement………... 42

2.2.17. Histochemical detection of GUS activity……… 42

3. RESULTS……… 44

3.1. Comparison of the starch content in tubers of different size………… 44

3.2. Comparison of the expression level of an introduced gene in transgenic potato tubers of different size... 44

3.3. Overexpression of AtNTT using the patatin promoter B33 in potato plants (BA)………... 45

3.3.1. Cloning of the AtNTT into the B33-pBin19 vector………. 45

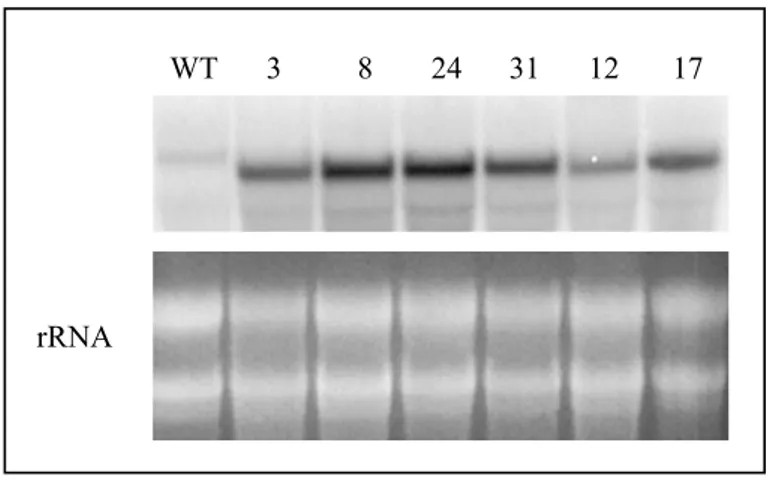
3.3.2. Analysis of AtNTT expression levels in potato tubers of BA plants……… 46

3.3.3. Analysis of BA tuber yield……….. 47

3.3.4. Analysis of starch and soluble sugar content in tubers of BA plants……… 47

3.3.5. Determination of phosphorylated intermediates in tubers of BA plants……… 48

3.4. Overexpression of pea GPT using the CaMV 35S promoter in potato plants (EW)………... 49

3.4.1. Analysis of pea GPT expression levels in EW plants…………. 49

3.4.2. Expression analysis of potato endogenous GPTs in tubers of EW plants………. 50

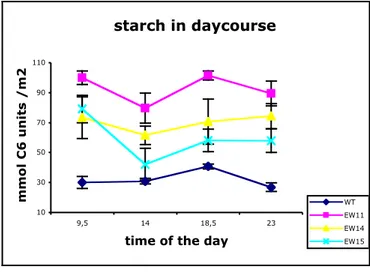
3.4.3. Time course of starch and soluble sugar content in leaves of EW plants………. 51

3.4.4. Time course of the phosphorylated intermediates in leaves of EW plants………. 52

3.4.5. Partitioning of

14

CO

2

into starch and sucrose of EW leaves…... 54

3.4.6. Analysis of yield, starch and soluble sugar content in tubers of

EW plants………. 54

(6)

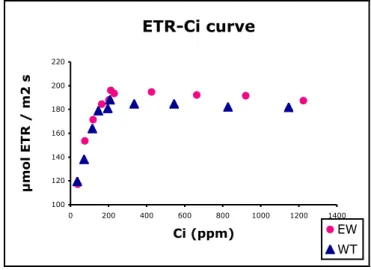
3.4.7 Determination of phosphorylated intermediates in tubers of EW plants………. 55 3.4.8. Photosynthesis of EW plants………... 56 3.5. Overexpression of pea GPT using the patatin promoter B33 in potato

plants (BG)………... 57 3.5.1. Analysis of pea GPT expression levels in tubers of BG plants... 57 3.5.2. Expression analysis of endogenous potato GPTs in tubers of

BG plants………. 58 3.5.3. Analysis of the GPT activity in tubers of BG plants…………... 59 3.5.4 Analysis of BG tuber yield……….. 59 3.5.5. Analysis of starch and soluble sugar contents in tubers of BG

plants………... 60 3.5.6. Analysis of phosphorylated intermediates in tubers of BG

plants……… 62 3.6. Overexpression of pea GPT in JT62 plants……….. 62

3.6.1. Overexpression of pea GPT using the CaMV 35S promoter in JT62 plants (SA62SG)……… 63 3.6.1.1. Analysis of pea GPT expression levels in SA62SG plants…... 63 3.6.1.2. General characteristics of SA62SG plants... 64 3.6.1.3. Analysis of SA62SG tuber yield... 65 3.6.1.4. Analysis of starch and soluble sugar contents in leaves and

tubers of SA62SG plants……….. 66 3.6.2. Overexpression of pea GPT using patatin promoter B33 in JT62

plants (SA62BG)……… 67 3.6.2.1. Analysis of pea GPT expression levels in SA62BG plants….. 67 3.6.2.2. General characteristics of SA62BG plants………... 68 3.6.2.3. Analysis of SA62BG tuber yield……….. 68 3.6.2.4. Analysis of starch and soluble sugar contents in tubers of

SA62BG plants………. 69 3.7. Overexpression of pea GPT and AtNTT together using the patatin

promoter B33……… 71 3.7.1. Overexpression of pea GPT and AtNTT in wild-type plants

(BGBAM)……… 71

3.7.1.1. Analysis of pea GPT and AtNTT expression levels in BGBAM plants………. 71 3.7.1.2. Analysis of BGBAM tuber yield……….. 72 3.7.1.3. Analysis of starch and soluble sugar contents in tubers of

BABGM plants………. 72 3.7.1.4. Determination of phosphorylated intermediates in tubers of

BABGM plants………. 72

3.7.2. Overexpression of the AtNTT in BG1 plants (BG1BA)………. 75

(7)

3.7.2.2. Analysis of activities of plastidic GPT and NTT in tubers of

BG1BA plants……….. 76

3.7.2.3. Analysis of BG1BA tuber yield……… 77

3.7.2.4. Analysis of starch and soluble sugar contents of BG1BA tubers……… 78

3.7.2.5. Determination of phosphorylated intermediates in tubers of BG1BA plants………... 79

3.7.2.6. Photosynthesis measurements of BG1BA plants……….. 81

3.8. Overexpression of pea GPT and AtNTT under control of a bidirectionalized B33 patatin promoter……… 82

3.8.1. Construction of a vector containing a bidirectionalized patatin promoter B33………... 82

3.8.2. Cloning GUS and GFP into the bidirectionalized B33-pBin19 binary vector……… 84

3.8.3. Determination of GUS and GFP expression levels………. 86

3.8.4. Cloning of pea GPT and AtNTT into the bidirectionalized B33 – pBin19 binary vector………. 88

3.8.5. Analysis of pea GPT and AtNTT expression levels……… 88

4. DISCUSSION……….. 91

4.1. Potato transformation………... 91

4.2. Comparison of the three promoters used in transformants…………... 91

4.3. Comparison of transgenic potato plants with different plastidic transporters involved in starch synthesis……….. 93

4.3.1. Comparison of potato plants overexpressing AtNTT under control of different promoters……….. 93

4.3.2. Comparison of potato plants overexpressing pea GPT under control of different promoters……….. 95

4.3.3. Comparison of potato plants overexpressing pea GPT under control of different promoters in JT62 plants……….. 99

4.3.4. Comparison of potato plants overexpressing pea GPT and AtNTT under control of the patatin promoter B33 and other transgenic plants with increased tuber starch contents………… 101

5. SUMMARY………. 104

6. ABBREVIATIONS………. 105

7. REFERENCES……… 108

(8)

1. INTRODUCTION

1. 1. History of the cultivated potato

The cultivated potato is one of the most important world food crops. Potato was first cultivated in the Andes Mountains of Peru and Bolivia. Spanish conquerors introduced potato in Europe as early as 1565 (Thornton, 1980) from Northern Colombia. In 17

th

and 18

th

centuries, potato population was increased in other parts of Europe (Bradshaw and Mackeny, 1994) and introduced to China, India, Japan and parts of Africa. Potato plants being originally adapted to short day conditions of tropical highlands were restricted to cooler climates. After a few centuries of natural and unconscious selection, potato plants were able to produce tubers under long day photoperiodic conditions and became a popular crop in the world.

1. 2. Taxonomy and characteristics of potato

Cultivated potato (Solanum tuberosum L.) belongs to the family Solanaceae and genus Solanum (Correll, 1962). This genus consists of about 2,000 species. Potato is one of as many as 235 tuber-bearing Solanum species recognized to date, of which 228 are wild and seven are cultivated (Hawkes, 1990). Potato is an annual herbaceous plant. It has a series of ploidy levels, based on a haploid number of 12 chromosomes (Dodds, 1962). The cultivated potatoes are autotetraploid (4n=48) (Ross, 1986).

Potato plants undergo several developmental stages during their life cycle involving

stolon formation, tuberisation, tuber filling, dormancy and tuber sprouting (Ewing and

Struik, 1992). According to the classical hypothesis (Gregory, 1956), a not defined

substance is synthesized in leaves under short day conditions and transported to the

stolons, where it triggers tuber formation. During tuberisation, the tuber is highly

metabolically active (Ewing and Struik, 1992), and two major biochemical changes

occur: accumulation of starch and formation of storage proteins (Appeldoorn et al.,

1997; Li, 1985). The most abundant of these proteins is a 40kD glycoprotein called

patatin, which is a lipid acyl hydrolase (Racusen, 1983; Rosahl et al., 1987; Andrew et

al., 1988; Jefferson et al., 1990). Potato tubers serve as sink organs where assimilates

accumulate. The size of tubers differs with age and cultivar. Commercial potato

cultivars are all reproduced vegetatively as clones. This necessarily means that once a

(9)

1. 3. Importance of potato

Potato is a source of food in almost every nation of the world. The reason is, first, it ranks fourth in terms of total world crops after wheat, maize and rice (FAO production yearbook, 1999), and it is grown in many countries (Kruger, 1997; Maldonado et al., 1998). Second, potato is an especially rich source of energy. There are high-quality proteins (2% of fresh weight) and substantial amounts of essential vitamins, minerals and trace element in potato tubers. However, the most important value of potato tubers is their high starch content (Tarn et al., 1992). Starch can account for 80% of the dry weight of mature potato tubers (Kruger, 1997). Moreover, potato can be used in a wide variety of processed, livestock feed and industrial applications. Besides the great economic impact, research on potato has many advantages: it is easily transformable and therefore amenable to genetic manipulation, and it can be rapidly propagated both in tissue culture and through cuttings (Jackson, 1999). Overall, potato tubers are the agronomic product of potato cultivation while starch is the major component of the potato tubers. High starch yield is an important target in potato breeding.

1.4. Metabolic pathway relevant to starch synthesis

Starch is the major reserve carbohydrate of higher plants and is found as a water- insoluble granule. Granules usually contain two D-glucose homopolymers: amylose and amylopectin. Amylose contains 600-3000 1,4-α-glucosyl residues with a 1,6-α- glucosyl branch every 1000 residues and makes up about 30% of starch (Kruger, 1997; Martin and Smith, 1995; Hovenkamp-Hermelink et al., 1988). This proportion may vary considerably with the plant species and variety (Detherage et al., 1955) and also with the plant organ, the developmental age of that organ, and the growth condition of the plant (Shannon and Garwood, 1984). Amylopectin contains 6000- 60000 glucosyl residues with an average of one 1,6-α-glucosyl linkage every 20 to 26 units and makes up about 70% of starch (Kruger, 1997; Martin and Smith, 1995). In nearly all types of plants, starch occurs in two forms, the transitory starch in chloroplasts of leaves (Mares et al., 1978; Levi and Preiss, 1976; Robinson and Preiss, 1987; Preiss, 1991), and the storage starch in amyloplasts of specialized heterotrophic tissues (MacDonald et al., 1983; Mohabir et al., 1988; Ziegler and Beck, 1989).

Starch biosynthesis starts from photosynthetic carbon fixation. Photosynthetically

(10)

fixed carbon can be metabolized in different ways.

First, within the chloroplast, CO

2

and H

2

O are combined with ribulose-1,5-

bisphosphate to form 3-phosphoglycerate (3-PGA) in a reaction catalyzed by Rubisco

(Ribulose-1,5-bisphosphate carboxylase/oxygenase). 3-PGA is further converted to

1,3-bisphosphoglycerate through use of ATP in a reaction catalyzed by 3-

phosphoglycerate kinase. 1,3-bisphosphoglycerate is reduced to glyceraldehyde-3-

phosphate (GAP) through use of NADPH in a reaction catalyzed by

NADP:glyceraldehyde-3-phosphate dehydrogenase. GAP is converted via triose

phosphate isomerase to dihydroxyacetone-3-phosphate (DHAP) in an isomerization

reaction. DHAP undergoes aldol condensation with GAP in a reaction catalyzed by

aldolase to give fructose-1,6-bisphosphate (Fru1,6P

2

). Fructose-6-phosphate (Fru6P)

is formed from Fru1,6P

2

in a reaction catalyzed by fructose-1,6-bisphosphatase. Fru6P

is further converted to glucose-6-phosphate (Glc6P) by glucose phosphate isomerase

(PGI). Glucose-1-phosphate (Glc1P) is formed from Glc6P in a reaction catalyzed by

phosphoglucomutase (PGM). ADP-glucose pyrophosphorylase (AGPase; Preiss

1988) catalyzes the conversion of Glc1P and ATP to ADP-glucose (ADPG) and

inorganic pyrophosphate (PPi). The glucose moiety of ADPG is then transferred to

starch by starch synthases. Alternatively, photosynthetically fixed carbon is exported

as triose phosphate (trioseP) or 3-PGA into the cytoplasm in exchange with inorganic

phosphate via the triose phosphate/phosphate translocator (TPT). Fru1,6P

2

is also

formed from trioseP, and then Fru6P, Glc6P and Glc1P are produced by the same

sequence of reactions in the cytoplasm as in the chloroplast. UDP-glucose (UDPG) is

formed from Glc1P and UTP in a reaction catalyzed by UDP-glucose

pyrophosphorylase (UGPase) (Zrenner et al., 1993). It donates the glucose moiety on

Fru6P to yield sucrose-6-phosphate in a reaction catalyzed by sucrose-phosphate

synthase (SPS). Finally, sucrose-6-phosphate is hydrolyzed to sucrose by sucrose-6-

phosphate phosphatase. Sucrose moves from the photosynthesizing cells in the

mesophyll to the vicinity of the sieve elements in the smallest veins of the leaf mainly

through the symplast via the plasmodesmata or through the apoplast (Frommer and

Sonnewald, 1995) for short distance transport. Sucrose is transported into the sieve

elements and companion cells for sieve element loading. The uptake of sucrose into

companion cells is mediated by an H

+

-sucrose co-transporter (SUT) (Hitz et al., 1986;

(11)

by a plasma membrane H

+

-ATPase activity which maintains an electrochemical proton gradient across the membrane. Finally, sucrose being inside the sieve element is translocated through long-distance transport from source to sink organs by a pressure flow mechanism and is unloaded in storage tissues from the phloem either via symplasmic connections or via the apoplast (Oparka et al., 1992). In potato tubers, it is mainly used to synthesize starch.

Amyloplasts are plastids present in storage cells that accumulate starch (MacDonald et al., 1983; Mohabir et al., 1988). In potato tubers, starch biosynthesis takes place in amyloplasts. Since it is unable to generate hexose phosphates from C3-compounds owing to the absence of Fru1,6P

2

ase activity (Entwistle et al., 1990; Flügge, 1999), it relies on the import of cytosolically generated hexose phosphates that are formed from sucrose delivered from source tissues. Translocated sucrose arriving at potato tubers is hydrolyzed to glucose and fructose by an invertase (Hawker et al., 1965;

Russell et al., 1982), or it is converted by sucrose synthase (SuSy; Zrenner et al., 1995) to fructose and UDPG. Glucose and fructose are phosphorylated in developing tubers to Glc6P and Fru6P, respectively (Renz et al., 1993), and UDPG is converted to Glc1P via a pyrophosphate (PPi) dependent reaction catalyzed by UGPase. After interconversion of hexose-phosphates, Glc6P enters the amyloplast by the glucose 6- phosphate/phosphate translocator (Hill et al., 1991; Schott et al., 1995; Naeem et al., 1997; Kammerer et al., 1998; Wischmann et al., 1999). Since ATP can’t be generated in amyloplasts, uptake of ATP is required as a driving force for starch synthesis. ATP is synthesized in mitochondria, is subsequently transported into the cytosol, and from there into amyloplasts via an ATP/ADP translocator (Heldt, 1969; Schuenemann et al., 1993; Kampfenkel et al., 1995; Tjaden et al., 1998a, b; Geigenberger et al., 2001).

Within amyloplasts, Glc1P is formed from Glc6P. ADPG is synthesized from Glc1P

and ATP by the AGPase reaction. The final polymerizing steps are catalyzed by

different classes of starch synthases, soluble, or granule-bound isoforms, which

incorporate glucose moieties of ADPG into the elongating glucan chains of the

granule (Martin and Smith, 1995; Smith et al., 1997). A lot of starch is accumulated in

mature potato tubers (Figure 1.1).

(12)

Fru1,6P2

3-PGA RuBP

Chloroplast

Cytosol CO2

Fru1,6P2

Fru6P Glc6P

Glc1P

Starch ADPG

H2O ATP

Calvin cycle

PPi Pi

Pi

1

3 2 5

UTP

Suc TrioseP

Fru6P

Glc6P

UDPG

SucP Glc1P

Pi Pi H2O

3

6

5 7 4

8

10 16

Branched glucans Linear glucans

Maltose Glc1P

Maltotriose

TrioseP

Maltose

Glucose 17

18

Glucose

19

20

Heteroglycan 16

21

11

TrioseP TPT

MEX1

PPi

GT GAP

DHAP

UDP

UDPG

Glucose

Fructose Fru6P

Glc6P Glc1P

13 13

Cytosol Amyloplast

ADP Glc6P

Glc1P

ADPG

Starch

ADP

ATP Pi

Pi Pi

PPi 2

TrioseP TrioseP

NADPH

Oxidative Pentose phosphate pathway

ADP UTP PPi

Nitrogen metabolism Glutamate synthesis Fatty acid biosynthesis

10

15

7 15

8

ATP

GPT

ADP ATP

ATP

Suc

UDP

Ru5PCO2

6

N T T

Suc

PHLOEM

Suc

Suc

APOPLAST

14

Glucose Fructose 5

6

6

12

13 22

TPT

4 GAP DHAP

Figure 1.1: Pathway of starch synthesis and degradation in plants

9

9

Preiss, 1991; Flügge, 1999; Taiz & Zeiger, 2002; Smith et al., 2005

14

15

(13)

TrioseP, Triose phosphate; 3-PGA, 3-phosphoglycerate; TPT, Triose phosphate/phosphate translocator;

GAP, Glyceraldehyde 3-phosphate; DHAP, Dihydroxyacetone phosphate; RuBP, ribulose 1,5- bisphosphate; Fru1,6P

2

, Fructose1,6-bisphosphate; Fru6P, Fructose 6-phosphate; Glc6P, Glucose 6- phosphate; Glc1P, Glucose 1-phosphate; ADPG, ADP-Glucose; ATP, Adenosine triphosphate; ADP, Adenosine diphosphate; UTP, Uridine triphosphate; UDP, Uridine diphosphate; UDPG, UDP-Glucose;

SucP, Sucrose 6-phosphate; Suc, Sucrose; GPT, Glucose 6-phosphate/phosphate translocator; NTT, ATP/ADP transporter; GT, Glucose translocator; MEX1, Maltose translocator; SUT, Sucrose translocator; Pi, Inorganic phosphate; PPi, Inorganic pyrophosphate; GWD, Glucan, water dikinase;

PWD, Phosphoglucan, water dikinase; Ru5P, Ribulose 5-phosphate

Enzymes:

1, Rubiso; 2, Triose phosphate isomerase; 3, Aldolase; 4, Fructose1,6-bisphosphatase;

5, phosphoglucoisomerate; 6, Phosphoglucomutase; 7, ADP-Glucose pyrophosphorylase; 8, Starch synthase and starch branching enzyme; 9, Pyrophosphatase; 10, UDP-Glucose pyrophosphorylase; 11, Sucrose phosphate synthase; 12, Sucrose phosphate phosphatase; 13, Invertase; 14, Sucrose synthase;

15, Hexokinase; 16, Glucan water dekinase; Phosphoglucan water dekinase; 17, Debranching enzyme (ISA3); 18, ß-amylase; 19, Disproportionating enzyme (DPE1); 20, Cytosolic transglucosidase (DPE2);

21, Cytosolic glucan phosphorylase ?; 22, plastidic glucan phosphorylase (PHS1)

1.5. Starch degradation

Starch is degraded during the dark in leaves and during tuber sprouting, respectively.

The pathway of starch degradation is not as clear as the starch synthesis pathway in all organs of plants. However, some groups identified it in Arabidopsis leaves at night recently (Figure 1.1) (Mikkelsen et al., 2004; Niittylae et al., 2004; Koetting et al., 2005; Smith et al., 2005). In chloroplasts at night, glucan release from starch granules remains unknown since α-amylases are not required in this process (Yu et al., 2005;

Smith et al., 2005). The glucan water dikinase and the phosphoglucan water dikinase add phosphate groups to amylopectin (Ritte et al., 2002; Mikkelsen et al., 2004;

Baunsgaard et al., 2005; Koetting et al., 2005). Linear glucans are formed from

branched glucans in a reaction catalyzed by debranching enzyme (ISA3). The

degradation of linear glucans in the Arabidopsis chloroplast usually proceeds via β -

amylase rather than glucan phosphorylase (Zeeman et al., 2004). Maltose is derived

from linear glucans in a reaction catalyzed by β-amylase, and subsequently is

exported to the cytosol by a maltose transporter (MEX1). Maltose is the main starch

breakdown product (Weise et al., 2004). Plastidic starch phosphorylase is not involved

in transitory starch breakdown (Zeeman et al., 2004; Weber et al., 2005). In addition,

(14)

glucose is formed from maltotriose in a reaction catalyzed by the disproportionating enzyme (DPE1), and then it is transported to the cytosol by the glucose transporter (GT). In the cytosol, exported maltose is further metabolized via a transglucosylation reaction to produce glucose and a glucosylated acceptor molecule. Both glucose residues derived from cytosolic maltose and glucose exported from chloroplasts are finally fed into the hexose phosphate pool, and then go to sucrose and cellular metabolism. This pathway of starch degradation in Arabidopsis leaves was suggested to be the same or similar in leaves of other plants and nonphotosynthetic tissues in which starch is stored transiently, but not to be possible for any other plant organ, e.g.

some starch-storing organs in which starch is a major, long-term reserve compound (Smith et al., 2005). In sprouting potato tubers, starch degradation occurs in amyloplasts, but the pathway of degradation of soluble glucan derived from starch remains unclear (Duwenig et al., 1997; Lloyd et al., 2004; Takaha et al., 1998).

1.6. Transgenic plants

1.6.1. Genetic modification (GM) technology

Because of the continuously increasing need for food and raw materials due to a

growing world population and long-term reduction of land suitable for growing crops,

it is increasingly becoming a task for biological research to increase yield of crops and

their food content. Prior to genetic engineering, most of the genetic variation is

created through crossing (Huffman, 2004). The advent of genetic modification (GM)

technology in the early 1970s allowed further development of the genetic variation

(Royal Society of London, 2000). GM technology can generate more useful and

productive crop varieties containing new combinations of genes. A feature of GM

technology is that it involves the introduction of one or, at most, a few well-defined

genes rather than the introduction of whole genomes or parts of chromosomes as in

traditional plant breeding. Additionally, GM technology can introduce genes from

diverse organisms. Desirable genes may provide features such as higher yield or

improved quality by modification of metabolic pathways. On the other hand, together

with suppression of endogenous gene expression, transgenic plants can be used to

study regulation of gene expression (Gatehouse, 1997). Without molecular tools such

(15)

1.6.2. Methods of transformation

Stable transformation is the heritable change in a cell or organism brought about by the uptake and establishment of introduced DNA. There are three main methods of transforming plant cells and tissues: the Agrobacterium-mediated transfer (Hooykas and Schilperoot, 1992; Zambryski, 1988; Hinchee et al., 1993), direct gene uptake through protoplasts (PEG-mediated, electroporation) (Negrurtiu et al., 1987; Fromm et al., 1985) and uptake of naked DNA into intact tissue (particle gun) (Gordon-Kamm et al., 1990). Agrobacterium-mediated gene transfer is well established in solanaceous species for obtaining transgenic plants and is now in use in laboratories throughout the world. However, Agrobacterium does not infect all host plants with equal efficiency, and will not infect monocots at all (Avigad and Dey, 1997). Genetic engineering of cereal crops is thus not possible by this route at present, although it is possible to force the bacterium to infect some monocot tissues by chemical treatment. In order to distinguish between the transformed and untransformed tissues efficiently, e.g.

antibiotic resistance genes have been used as selective markers in the process of genetic modification. Kanamycin (Toepfer et al., 1988) is one of the most commonly used selection markers for plant transformation.

1.6.3. Transgenic potato plants

Potatoes were one of the first crop plants in which transgenic plants were successfully regenerated (An et al., 1986; Shanin and Simpson, 1986). Potato transformation has since become well developed, and now offers a real alternative approach for cultivar improvement. The advantage of this approach is that it theoretically allows the incorporation of single genes into otherwise elite clones to achieve cultivar improvement (Conner and Christey, 1994).

Agrobacterium-mediated transformation using binary vectors is the preferred transformation method for potato (Sheerman and Bevan, 1988; Stiekema et al., 1998;

Wenzler et al., 1989; Conner et al., 1991). In virtually all transgenic potato plants

developed to date, kanamycin resistance has been commonly used as marker system

for selection of transformed cells and their subsequent regeneration into complete

plants. In addition, other selectable marker systems like hygromycin (Becker, 1990)

and methotrexate (Jacobs et al., 1994) have been successfully used for potato

transformation.

(16)

1.7. Promoters

Promoters have been cloned and widely used for both biotechnological application and basic research in plants. Promoters determine the spatio-temporal expression as well as the strength of expression.

1.7.1. Cauliflower mosaic virus 35S (CaMV 35S) promoter

The CaMV 35S promoter was obtained from the virus that causes cauliflower mosaic disease in several vegetables (Odell et al., 1985). This promoter is upregulated by cell division, and thus is expressed at some time in a life of all cells. Since the CaMV 35S promoter was the first promoter showing a strong expression in almost all plant tissues, that is not greatly influenced by environmental conditions and developmental state, it became almost universal to constitutively express foreign genes in genetically engineered plants (Kuipers et al., 1997). However, this “constitutive” and strong promoter also has several drawbacks. The gene of interest is also expressed in tissues and at times when it is not necessary or even unwanted.

1.7.2. Patatin promoter B33

Since the CaMV 35S promoter has some drawbacks, a second generation of promoters became available in the beginning of the 1990’s. These promoters were somewhat better adapted to particular requirements (Matsuoka and Sanada, 1991;

Jefferson et al., 1990; Chen and Beachy, 1987). Several potato tuber promoters were isolated such as patatin (Wenzler et al., 1989: Koester-Toepfer et al., 1989), starch phosphorylase (St-Pierre and Brisson, 1995; von Borcke and Kruger, 1999), ADP- glucose pyrophosphorylase (Mueller-Roeber et al., 1994), granule bound starch synthase (GBSS) (Dai et al., 1996; Rohde et al., 1990; Visser et al., 1991) and sucrose synthase (Fu and Park, 1995). In genetically engineered potato plants, the patatin promoter was most often chosen to drive gene expression.

Patatin is a family of glycoproteins with an apparent molecular weight of 40 kD from

potato (Solanum tubersoum L.) tubers. It is present in all cultivars so far examined

and accounts for 30-40% of the total soluble protein (Rosahl et al., 1986; Paiva et al.,

1983; Racusen, 1983; Racusen et al., 1980). Patatin appears to serve as a storage

protein, and it also has esterase activity (Rosahl et al., 1987). Based on structural

(17)

al., 1988). Class I accounts for 98-99% of the patatin mRNA in tubers (Mignery et al., 1988), but normally is not expressed in leaves, roots or stems (Paiva et al., 1983;

Rosahl et al., 1986). However, it can be induced to express at high levels in these organs (when they were detached) by high exogenous concentrations of sucrose (Racusen, 1983; Paiva et al., 1983; Wenzler et al., 1989; Rocha-Sosa et al., 1989; Kim et al., 1994; Müller-Röber et al., 1992). The B33 class I gene is highly expressed in vascular tissue at early stages of tuber development and in both vascular and parenchyma tissue during later stages of development (Liu et al., 1991; Sonnewald et al., 1989; Kuehn et al., 2003) The class I patatin gene contains promoter repeat sequences, which are critical for developmental and metabolic regulation (Fu et al., 2001). The B33 class I gene carries a strong tuber-specific promoter (Rocha-Sosa et al., 1989; Liu et al., 1990; Jefferson et al., 1990; Kim, et al., 1994). Therefore, class I patatin promoter B33 is considered to be a tuber-specific, sucrose-inducible promoter.

1.7.3. Bidirectionalization of polar promoters

It is often necessary to introduce multiple genes into plants for metabolic engineering and trait stacking (Ye et al., 2000). In order to minimize or avoid repeated use of a single promoter that may cause transcriptional gene silencing (De Wilde et al., 2000), a polar plant promoter was first bidirectionalized in Arabidopsis. To get a bidirectional plant promoter, a unidirectional promoter may be fused with either a homogeneous or heterogeneous minimal promoter at its 5’ end in opposite orientation.

One bidirectionalized promoter can direct the expression of two genes, one on each end of the promoter (Xie et al., 2001).

1.8. Plastidic translocators

Plastids are plant-specific organelles, which are able to perform many specialized

functions that are essential for plant growth and development. All plastids of higher

plants are double membrane organelles. Three types of membrane transporters

enhance the movement of solutes across membranes: channels, carriers and pumps. In

plastids, the outer membrane contains different channel-like proteins that act as

metabolite-regulated selectivity filters (Boelter and Soll, 2001). The inner envelope

membrane is the actual permeability barrier between the plastid and the surrounding

cytosol and is the site of numerous metabolite translocators that coordinate the

metabolism in both compartments (Flügge, 1999). These metabolite translocators are

(18)

carriers. Metabolite exchange between plastids and the surrounding cytosol has been identified to be achieved by four known subfamilies of plastidic phosphate translocators and different other nonphosphate transporters, e.g. the adenylate translocator. The controlled exchange of metabolites between plastids and the cytosol depends on the activity of transport proteins (Weber, 2004).

1.8.1. Phosphate translocators

Plastidic phosphate translocators exchange various phosphorylated C3-, C5- and C6- carbon compounds with inorganic phosphate between plastids and cytosol. All phosphate translocators belong to the TPT / nucleotide sugar transporter (NST) superfamily. Functionally known plastidic phosphate translocators can be grouped into four classes: the triose phosphate/phosphate translocator (TPT) (Flügge et al., 1989), the phosphoenolpyruvate/phosphate translocator (PPT) (Fischer et al., 1994, 1997), the glucose 6-phosphate/phosphate translocator (GPT) (Kammerer et al., 1998) and the xylulose 5-phosphate/phosphate translocator (XPT) (Eicks et al., 2002). These four distinct subfamilies have been identified and characterized until now. All of them are antiporters and they share inorganic phosphate as common substrate, but have different spectra of counter exchange substrates to fulfill the metabolic needs of individual cells and tissues (Flügge et al., 2003). The TPT functions predominantly in photosynthetic tissues (Flügge et al., 1989), GPT in roots and reproductive organs (Kammerer et al., 1998), whereas PPT appears to be ubiquitously expressed (Fischer et al., 1997). Moreover, XPT’s possible function is to provide the plastids’ pentose phosphate pathways with cytosolic carbon skeletons in the form of Xul-5-P (Eicks et al., 2002). However, GPT and PPT are main and important transporters in potato tubers.

1.8.1.1. Glucose 6-phosphate/phosphate translocator (GPT)

The glucose 6-phosphate/phosphate translocator was purified from maize endosperm

(Flügge, 1995; Kammerer et al., 1998). The corresponding cDNA was isolated from

maize endosperm, pea roots, potato tubers and other heterotrophic tissues. GPT

proteins of different higher plants share a high degree of identity with each other. GPT

expression is mainly restricted to heterotrophic tissues. In potato plants, only tubers

(19)

phosphate as counter-exchange substrates (Kammerer et al., 1998). Other hexose phosphates, such as Glc1P and Fru6P, are not transported by the GPT (Kammerer et al., 1998; Schott et al., 1995; Flügge et al., 2003). The main physiological function of the GPT is the import of Glc6P into plastids of heterotrophic tissue. Inside the plastids, Glc6P can serve two different functions. First, Glc6P is a precursor for starch biosynthesis during which inorganic phosphate is released. Second, it is a substrate for the oxidative pentose phosphate pathway (OPPP) yielding triose phosphate (Kammerer et al., 1998; Flügge, 1998, 2003; Weber, 2004). The GPT is considered to be important in controlling the supply of carbon precursors for starch synthesis.

1.8.2. Plastidic ATP/ADP translocator (NTT)

Non-green plastids depend on the supply of energy for the synthesis of starch and

fatty acids (Hill and Smith, 1991; Kang and Rawsthorne, 1994; Kleppinger-Sparace et

al., 1992; Moehlmann et al., 1994). ATP represents the universal energy currency of

all living cells. In heterotrophic cells, the bulk of ATP is synthesized in mitochondria,

subsequently transported into the cytosol, and from there into various organelles. Due

to both size and charge, adenylates do not cross biomembranes freely (Neuhaus and

Emes, 2000). ATP import into all types of plastids is mediated by a specific ATP/ADP

translocator – the plastidic nucleotide transporter (NTT) (Heldt, 1969; Neuhaus et al.,

1993a; Schuenemann et al., 1993; Linka et al., 2003). NTT was first found in the

inner envelope membrane of spinach chloroplasts (Heldt, 1969). However, NTTs exist

in all higher and lower plants analyzed so far (Linka et al., 2003). All orthologs of the

NTT, e.g. the two isoforms of Arabidopsis or a potato ortholog, exhibit similar

transport properties with respect to substrate specificity and substrate affinity

(Moehlmann et al., 1998; Tjaden et al., 1998a, 1998b; Linka et al., 2003). It has been

identified that NTTs represent a second type of eukaryotic adenylate transporters,

which is not related to the adenylate translocator from mitochondria (Klingenberg,

1989; Schuenemann et al., 1993; Neuhaus et al., 1997). Generally, mitochondrial

adenylate carriers (AACs) serve to supply the cytosol with ATP synthesized at the

cristae site of the mitochondria through oxidative phosphorylation in strict counter

exchange with cytosolic ADP (Vignais, 1976; Klingenberg, 1989). By contrast, the

NTT catalyzes the uptake of ATP in exchange for organellar ADP. It is also an

antiporter. ATP uptake into isolated plastids occurs in a counter-exchange mode

(Heldt, 1969; Schuenemann et al., 1993; Neuhaus et al., 1997; Tjaden et al., 1998b).

(20)

Therefore, the main function of NTT is the supply of storage plastids with ATP (Schuenemann et al., 1993; Kang and Rawsthorne, 1994; Neuhaus and Emes, 2000).

In potato plants, the highest accumulation of NTT mRNA is found in tubers. NTT may have a high flux control coefficient within the starch metabolic pathway (Tjaden et al., 1998a; Geigenberger et al., 2001).

1.9. Outline of the thesis

Potato is one of the most important crops in the world. Starch is the major component of potato tubers (John, 1992). Carbon and energy are essential substrates for starch synthesis in amyloplasts of potato tubers. Transporters play an important role in plant cellular metabolism. GPT transports carbon from the cytosol to amyloplasts, while NTT transports energy to amyloplasts. The aim of this project is to increase starch content and yield of potato tubers. To achieve this goal, pea GPT and AtNTT genes would be overexpressed in potato plants individually or together using either the CaMV 35S promoter, the patatin promoter B33 or a bidirectionalized B33 promoter.

Tjaden et al. (1998) created plants that overexpressed an Arabidopsis NTT in potato under control of the CaMV 35S promoter. The CaMV 35S promoter is a powerful promoter that strongly mediates gene expression in almost all plant tissues. The CaMV 35S promoter was used to overexpress pea GPT in different potato plants.

The patatin promoter B33 is a tuber-specific, sucrose-inducible promoter. It strongly mediates gene expression in tubers, and normally no expression in other organs.

However, it can be induced to express in other detached organs by high exogenous concentrations of sucrose. Patatin promoter B33 was chosen to overexpress pea GPT and AtNTT in different potato plants.

In order to avoid possible transcriptional gene silencing when multiple genes were introduced to plants simultaneously, plasmids with a bidirectionalized patatin promoter B33 were constructed. One contained GUS and GFP reporter genes; another one contained pea GPT and AtNTT genes. Transgenic plants harboring these plasmids were analyzed on molecular level.

All transgenic plants were grown in a greenhouse and analyzed for their (I) tuber yield

and (II) starch content of the tubers. Furthermore, a detailed analysis including soluble

sugars, phosphorylated intermediates, transport activities,

14

CO

2

feeding and

(21)

2. MATERIALS AND METHODS 2.1. Materials

2.1.1. Chemicals and Enzymes

Restriction enzymes were purchased from MBI Fermentas (St. Leon-Rot, Germany), Promega (Mannheim, Germany), Invitrogen (Karlsruhe, Germany); Taq-polymerase were purchased from Qiagen GmbH (Hilden, Germany), Takara (Gennevilliers, Frankreich) and Promega and used with the 10x buffer supplied, unless otherwise stated. Laboratory reagents were obtained from Roche (Mannheim, Germany), Fluka (Buchs, CH), Merck (Darmstadt, Germany) and Sigma (Muechen, Germany), unless otherwise stated. dNTP were from Pharmacia. Filter papers were obtained from Whatwan. Radioisotopes [α-

32

P]-dATP (10 µCi/µl), [

32

P]-orthophosphate (10 µCi/µl) and

14

CO

2

(56 mCi/mmol) were purchased from Amersham Buchler and ICN (Braunschweig, Germany). Reagents for tissue culture were purchase from Duchefa (Haarlem, Netherlands). Biochemical enzymes were obtained from Roche and Sigma.

2.1.2. Commercial Kits

QIAquick Gel Extraction Kit (Qiagen GmbH, Hilden, Germany) MiniElute Gel Extraction Kit (50) (Qiagen GmbH, Hilden, Germany) QIAquick PCR Purification Kit (Qiagen GmbH, Hilden, Germany) MinElute PCR Purification Kit (Qiagen GmbH, Hilden, Germany)

QIAgen plasmid Mini, Midi and Maxi. Kit (Qiagen GmbH, Hilden, Germany) Quantum Prep Plasmid miniprep Kit (BioRad, München, Germany)

Big Dye Terminator v1.1 cycle Sequencing Kit (Applied Biosystems, Foster City, USA)

2.1.3. Plant material

Solanum tuberosum cv. Desirée

ATP/ADP transporter overexpressors (JT62; Tjaden et al. 1998)

(22)

2.1.4. Bacterial strains and cloning vectors

E.coli DH5α

supE44 Δ lacU169 ( φ 80, lacZ Δ M15) hsdR17 recA1 endA1 gyrA96 thi-1 rel A1 (Hanahan, 1983)

Agrobacterium tumefaciens C58C1 (GV2260)

Cloning vectors

TOPO TA cloning vector (Invitrogen) for cloning and sequencing PGEM-T easy (Promega) for cloning and sequencing

pBluescriptII (SK

-

) (Stratagene) for plasmid amplification B33-pBin19 (Flügge group) for plant transformation

Microscope

Nikon Eclipse E800

Filter GFP (R)-BP EX 460-500; DM 505; BA 510-560 2.1.5. Primers

AtNTT:

primer NTT1 AAG GAT CCA TGG AAG CTG TGA TTC AAA CC primer NTT2 AAG TCG ACT TAT AAG TTG GTG GGA GCA GAT TTC

35S minimal promoter:

primer 1 AAG AGC TCT CGC AAG ACC CTT CCT CTA TAT AAG G primer 2 AAA CTA GTA GGC CTC GTG TCC TCT CCA AAT GAA ATG CaMV terminator:

primer 3: AAA CTA GTA CCG GTT AAT TCG GGG GAT CTG GAT TTT AG

(23)

“35S minimal promoter + CaMV terminator” cassette

primer 5: AAG AAT TCT CGC AAG ACC CTT CCT CTA TAT AAG G primer 6 (4): AAG AAT TCG ATG TGT CGA TCG ACA AGC TCG

GUS in construct A:

primer 7: AAG GAT CCA TGT TAC GTC CTG TAG AAA CCC C primer 8: AAG TCG ACT CAC ACG TGG TGG TGG TGG

GFP in construct A:

primer 9: AAA CTA GTA TGG TAG ATC TGA CTA GTA AAG G primer 10: AAA CCG GTT CAC ACG TGG TGG TGG TGG

GUS in construct B:

primer 11: AAA CTA GTA TGT TAC GTC CTG TAG AAA CCC C primer 12: AAA CCG GTT CAC ACG TGG TGG TGG TGG

GFP in construct B:

primer 13: AAG GAT CCA TGG TAG ATC TGA CTA GTA AAG G primer 14: AAG TCG ACT CAC ACG TGG TGG TGG TGG

600 bp GUS:

primer 11: AAA CTA GTA TGT TAC GTC CTG TAG AAA CCC C primer 11’: AAA TTG GCC ACC ACC TGC CAG TCA AAC

pea GPT:

primer 15: AAA CTA GTA TGA TTT CCT CGT TGA GAC AAC C

primer 16: AAA CCG GTC TAT TGT TTT GCC TGT GAG TAT AAG

(24)

2.1.6. Media

Luria-Bertani (LB)

10 g/l Tryptone

5 g/l Yeast extract 5 - 10 g/l NaCl

15 g/l Agar for plating

Add distilled water and adjust pH to 7.0 with NaOH, bring to 1 liter with distilled water. Autoclave was at 120°C for 20 min. For plating, 15 g agar was added before autoclaving. After autoclaving, cool to 50°C, and then pour the plates either directly without adding antibiotic, or alternatively, with ampicillin added to a final concentration of 100 µg/ml or kanamycin added to final concentration of 25 µg/ml.

White and blue selection medium (1 liter) 1000 ml LB with 15 g agar

2 ml 50 mg/ml Amplicillin

2 ml 20 mg/ml X-gal

40 µl 200 mg/ml IPTG

Make the LB plating medium as above, supplement with ampicillin, X-gal and IPTG when the medium is cooled to 50°C, and then pour the plates.

YEB

5,0 g/l Beef extract 1,0 g/l Yeast extract 5,0 g/l Peptone (Bacto)

5,0 g/l Sucrose

0,5 g/l MgSO

4

*7H

2

O

15 g/l Bacto agar for plating

(25)

plates. In the case of potato, carbenicillin was added to final concentration of 100 µg/ml (dissolved in 1 M Tris-HCl pH 8,0), rifampicin added to final concentration of 150 µg/ml and kanamycin added to final concentration of 100 µg/ml before pouring the plates.

2.1.7. Buffers and Solutions

10 x stop (loading) buffer 20% (w/v) Ficoll 400

100 mM EDTA

1,0% (w/v) SDS

0,05% (w/v) Bromphenolblue 0,05% (w/v) Xyleneblue 40 mM Tris-HCl pH 7,5

50 x TAE buffer

2 M Tris-HCl pH 7,5

50 mM EDTA

Ethidiumbromide solution (EtBr)

5% (w/v) Ethidiumbromide in methanol

1 x TE

10 mM Tris-HCl pH 8,0

1 mM EDTA

0,1% (v/v) DEPC water

DEPC in water, left overnight with stirring at room temperature, and then autoclaved.

P : C : I

phenol : chloroform : isoamyl alcohol 25 : 24 : 1

(26)

C : I

chloroform : isoamyl alcohol 24:1

Stock solutions

Name Stock concentration (mg/ml) Dissolve Store

Amplicillin 50 H

2

O -20°C

Kanamycin 25 H

2

O -20°C

Rifampicin 30 DMSO RT

HygromycinB 410 (commercial) Hepes 4°C

Cefotaxime - H

2

O 4°C

Carbenicillin 50 1 M Tris pH 8 -20°C

NAA 1 1 M NaOH 4°C

BAP 1 H

2

O 4°C

Zeatin 1 1 M NaOH -20°C

GA3 1 H

2

O -20°C

2.2. Methods

2.2.1. DNA extraction from agarose gel

PCR fragments, which were used for cloning or labeling as probes, were gel-extracted using QIAquick Gel Extract Kit. The extraction procedures followed the supplier’s protocol. The concentration of extracted DNA was estimated as in section 2.2.8.

2.2.2. Plasmid DNA extraction from E.coli

Solution I

25 mM Tris-HCl pH 8,0

10 mM EDTA

Solution II

0,2 M NaOH

(27)

Solution III

3 M KOAc pH 4,8

Plasmid DNA minipreparations were based on the alkaline lysis method (Birnboim and Doly, 1979) with some modifications.

5 ml sterile LB medium was inoculated with a single bacterial colony and incubated at 37°C with shaking overnight. 2 ml of a saturated culture was transferred to a 2 ml eppendorf tube and the cells were precipitated at 13000 rpm for 5 min in a microcentrifuge (Eppendorf 5417). The supernatant was discarded. The pellet was resuspended in 100 µl solution I and incubated at room temperature for 5 min. 200 µl solution II was added and incubated at room temperature for another 5 min (denature bacterial protein, chromosomal and plasmid DNA). 150 µl solution III was added and incubated on ice for 10 min to neutralize the mixture. The mixture was centrifuged at 13000 rpm for 10 min (chromosomal DNA, bacterial proteins and SDS were in pellet, plasmid DNA in supernatant). The supernatant was treated with following procedures:

400 µl P:C:I was added and spun down at 13000 rpm for 5 min; 400 µl C:I was added and spun down at 13000 rpm for 5 min; 1ml absolute EtOH was added and spun down at 13000 rpm for 30 min. The pellet was washed with 70% EtOH two times, dried at room temperature for 10 min and dissolved in 40 µl bidest-H

2

O.

In order to eliminate the contamination of RNA, 5 µl RNaseA boiled (10 mg/ml) was added to the minipreparation product and incubated at 37°C for 30 min. The mixture was purified with P:C:I and C:I and precipitated by absolute EtOH. The pellet was washed by 70% EtOH and dissolved in bidest-H

2

O. This plasmid can be used for digestion and sequencing.

Qiagen midi- and maxi-plasmid Kit were used to prepare plasmid of low copy DNA for sequencing and plant transformation. The processes followed the supplier’s protocols.

2.2.3. Nucleic acid manipulation

2.2.3.1. A-tailing of PCR products

The pGEM-T easy and TOPO TA cloning vectors need an A-tailed PCR product for

ligation. Since Taq polymerase has the function of adding deoxyadenosine at the end,

it was not necessary to add the A-tailing in PCR product. Otherwise, A-tailing was

(28)

done in 40 µl volume as follows before ligation:

1 µg purified PCR product 4 µl (2 mM) dATP

4 µl 10 x buffer 1 µl (1 U/µl) Taq

The mixture was incubated at 70°C for 30 min. To precipitate the product, 4 µl 3 M NaOAc (pH 5,2), 100 µl 100% EtOH was added and left at –20°C for 20 min. The mixture was centrifuged at 13000 rpm for 30 min at room temperature and washed with 70% EtOH two times, and then dissolved in 10 µl H

2

O.

2.2.3.2. Dephosphorylation

The removal of the 5'-terminal phosphates from the dsDNA ends prevents vector self- ligation and improves ligation results. After the vector was digested with restriction enzyme in 15 µl volume at 37°C for 30 min, the mixture was heated to 65° for 15 min to stop the reaction. 2,5 µl 10 x SAP buffer and 1 µl SAP (1 U/µl) was added to 25 µl volume and incubated at 37°C for 10 min for dephosphorylated reaction. SAP was completely and irreversibly inactivated by heating at 65°C for 15 min. 2,5 volumes EtOH and 1/10 volume 3 M NaOAc was added to precipitate the pellet. The pellet was dissolved in 50 µl bidest-H

2

O.

2.2.3.3. Ligation

A molar ratio 3:1 of insert : vector was adopted to calculate the amount of PCR product for the ligation reaction according to the following formula:

PCR product (ng) = 3 x (50 - 200 ng vector) x (size of PCR product in kb) / size of vector (kb).

Ligation was done in 20 µl as follows:

1 µl vector (concentration optimized) 1 µl fragment (concentration optimized) 4 µl 10 x ligation buffer

1 µl (3 U/µl) T4 DNA ligase

The mixture was incubated at 12°C overnight before transformation.

(29)

2.2.4. Transformation

2.2.4.1. Transformation of E.coli

2.2.4.1.1. Preparation of TSS-competent host cells

The methods were according to the methods of Chung et al. (1993) with some modifications.

TSS buffer

3 g PEG 8000

1,2 ml 1 M MgCl

2

1,5 ml DMSO

30 ml LB

pH 6,5 - 6,8

PEG and MgCl

2

were diluted in 25 ml LB and pH was adjusted to 6,5 - 6,8. The volume was filled to 28,5 ml with LB. The solution was sterilized by filter and then DMSO was added to the solution.

A glycerol stock of E.coli strain DH5α was streaked on LB medium and incubated at 37°C overnight. A single colony was picked and cultured overnight in 5 ml of LB liquid medium followed by subculture of 600 µl in 100 ml LB. The culture was shaken at 37°C overnight. When optical density (OD) was in the range of 0,3 - 0,4, the culture was transferred to two clean and cold tubes and centrifuged at 4°C, 2500 g for 5 min. The cells were resuspended in 3 - 5 ml cold TSS buffer. The cell suspension was divided into 100 µl –aliquot and frozen in liquid nitrogen and stored at –80°C.

2.2.4.1.2. Transformation

For each transformation, 100 µl competent cells of E.coli strain DH5 α , thawed on ice,

were mixed with 1 - 5 µl of ligation mixture and incubated on ice for 30 min. The

cells were incubated at 42°C for 90 sec and subsequently put back on ice for another 1

- 2 min. 900 µl LB was added and incubated at 37°C for 1 h. The culture was spun

down at 14000 rpm for 1 min and 800 µl supernatant was discarded. 100 - 200 µl

bacteria were plated on LB medium containing the appropriate antibiotic and were

(30)

incubated at 37°C for 14 - 20 h.

2.2.4.1.3. Screening

Single colonies were picked out with a sterile tip and dipped in a PCR master mix to amplify the target insert of the plasmid using appropriate primer sets as in section 2.2.9.1. In parallel, the single colony was also streaked on a LB plate. Once the correct PCR product was obtained, the corresponding colony was propagated for plasmid DNA isolation and sequence.

2.2.4.2. Transformation of A. tumefaciens 2.2.4.2.1. Preparation of electro-competent cells

MGL buffer

5 g Bacto peptone

2,5 g Yeast extract

5 g NaCl

5 g Mannitol

1,16 g Na-glutamate

0,25 g KH

2

PO

4

0,1 g MgSO

4

*7H

2

O

1 mg Biotin

add distilled water to 1 liter, and then autoclave.

Agrobacteria were cultured in 5 ml MGL buffer containing rifampicin (150 µg/ml) and carbenicillin (100 µg/ml) for 1 - 2 days at 28°C with 200 rpm shaking until saturation and then were diluted with 100 ml MGL buffer to an OD

600

=0,04 - 0,08.

When bacteria were cultured to an OD

600

=0,5 (ca 4 h), cells were centrifuged at 5000

rpm, 4°C for 5 min (Rotor GS, Sorball RC5B) and resuspended in 40 ml 1 mM Hepes

(pH 7,0). Following centrifugation at 4°C, 5000 rpm for 5 min, cells were

resuspended in 40 ml 1 mM Hepes / 10% Glycerin (v/v). After another centrifugation,

cells were resuspended in 2 ml 1 mM Hepes / 10% Glycerin (v/v). The suspension

(31)

resuspended in 200 µl Hepes / 10% Glycerin (v/v) of each eppendorf tube. The cell suspension was divided into 50 µl –aliquot and frozen in liquid nitrogen and stored at –80°C.

2.2.4.2.2. Transformation

50 µl competent cells of A.tumefaciens strain GV 2260, thawed on ice, were mixed with 100 - 200 ng (about 2 µl) plasmid DNA and incubated on ice for 2 min. The mixture was transferred to a 0,2 cm electroporation cuvette (pre-cooled on ice) avoiding bubbles. Electroporation was done at 25 µF, 400 Ω, 2,5 kV on an electroporator (Bio-Rad). 1 ml YEB was added immediately and removed to a 2 ml Eppendorf tube and incubated at 28°C for 2 h with shaking. The culture was spun down at 14000 rpm for 1 min and 800 µl supernatant was discarded. 100 - 200 µl bacteria were plated on YEB medium containing the appropriate antibiotic and were incubated at 28°C for 2 days.

Single colonies were checked by colony PCR as in sections 2.2.4.1.3 and 2.2.9.1. A positive colony was cultured on a new YEB plate at 28°C for another 2 days for plant transformation.

2.2.4.3. Transformation and regeneration of transgenic potato plants

3MS medium (1 liter)

4,6 g MS244

30,0 g Sucrose

3,0 g Gelrite

pH 5,6 - 5,8

2MS solid medium (1 liter)

4,6 g MS244

20,0 g Sucrose

3,0 g Gelrite

pH 5,6 - 5,8

Add distilled water and adjust pH 5,6 - 5,8 with 2M NaOH, bring to 1 liter with

(32)

distilled water. Autoclave was at 120°C for 20 min. For plating, 3,0 g Gelrite was added before autoclaving. After autoclaving, cool to 50°C, and then pour the jars with or without antibiotic.

CG-76 solid medium (200 ml)

0,88 g MS245

3,2 g Glucose

0,6 g Gelrite

pH 5,6 - 5,8

1 ml 1 mg/ml NAA

20 µl 1 mg/ml BAP

100 mg Cefotaxime

CG-75 solid medium (1 liter)

4,4 g MS245

16,0 g Glucose

3,0 g Gelrite

pH 5,6 - 5,8

20 µl 1,0 mg/ml NAA

2 ml 1,0 mg/ml Zeatin

20 µl 1,0 mg/ml GA3

500 mg Cefotaxime

Add distilled water and adjust pH to 5,6 - 5,8 with 2 M NaOH, bring to appropriate

volume with distilled water. Add 3,0 g/l Gelrite and subsequently autoclave at 120°C

for 20 min. For CG-76 medium, when medium was cooled to 50°C, pour the plates

with NAA added to final concentration of 5 g/l, BAP added to final concentration of

0,1 g/l and cefotaxime added to final concentration of 500 mg/l. For CG-75 medium,

pour the jars with NAA added to final concentration of 0,02 mg/l, Zeatin added to

final concentration of 2,0 mg/l, GA3 added to final concentration of 0,02 mg/l and

cefotaxime to final concentration of 500 mg/l.

(33)

Agrobacterium was transferred to an Eppendorf tube containing 1 ml 3MS liquid medium (Murashige and Skoog, 1962) and mixed well. The sterile plant material was grown on 2MS solid medium for 4 - 6 weeks. Potato leaves were cut and placed in 12 ml 3MS liquid medium. 1 ml bacterial culture was added and incubated with potato leaves in the dark for two days at room temperature. Leaves were then removed carefully from solution, and laid topside down on CG-76 solid medium with 7,5 mg/l hygromycin or 50 mg/l kanamycin and incubated in a tissue-chamber (22°C, 16 / 8 h of light / dark) for one week to select for growth of transgenic cells. Then leaves were transferred to CG-75 solid medium with 7,5 - 15 mg/l hygromycin or 50 mg/l kanamycin, left in the same tissue-chamber. Between 3 - 4 weeks following incubation, calli formed at the periphery of the leaves, and shoots subsequently appeared. Every three weeks the leaves were placed on fresh CG75 medium. Once shoots were 0,5 - 1,0 cm in size, they were removed and placed into jars (11cm x 10cm) containing 60 - 80 ml 3MS solid medium with 30 mg/l hygromycin or 100 mg/l kanamycin, left in the same tissue-chamber. When sufficient root formation had occurred, the plantlets were removed to pots and transferred to a greenhouse for further growth and analysis.

2.2.5. Plant growth conditions

Potato plants were grown in soil of RHP15 (Klasmann) and watered daily under a greenhouse conditions as follows: the temperature was not less than 20°C during the day, and about 17 – 18°C during the night. The additional light (100-200 µmol photons m

-2

s

-1

) was given from 5:00 am to 21:00 pm (16 h) every day, but just when the sunshine was not efficient.

2.2.6. Isolation of plant genomic DNA for PCR

Genomic DNA quick-extraction buffer 200 mM Tris-HCl pH7.5

250 mM NaCl

25 mM EDTA

0,5% (w/v) SDS

Autoclave

(34)

Two pieces of potato leaf discs (r=0,4 cm) were used to isolate genomic DNA after the plants had been transferred from tissue culture to a greenhouse for four weeks.

The discs were macerated in a 1.5 ml Eppendorf tube at room temperature with a homogenizer, and then 400 µl quick-extraction buffer was added and the sample was vortexed for 5 sec. The mixture was incubated at room temperature for at least one hour until all samples had been extracted. 100 µl 3M KOAc was added to the extract and incubated at room temperature for 5 min and centrifuged for 2 min at 13000 rpm.

300 µl supernatant was transferred to a new Eppendorf tube containing 300 µl isopropanol and incubated at room temperature for at least 2 min. A centrifugation at 13000 rpm for 5 min followed. The pellet was dried at room temperature and dissolved in 50 µl 1xTE.

2.2.7. Isolation of plant total RNA

2.2.7.1. Isolation of total RNA from potato leaves

Total RNA extraction buffer (with distilled water)

8 M Guanidinium-HCl pH 7.0

20 mM EDTA

20 mM MES

0,7% (v/v) β-Mercaptoethanol, added directly before extraction

0,3 - 0,5 g potato leaves were ground with mortar and pestle in liquid nitrogen. 3

volumes (g/ml) extraction buffer was added to the fine powder. 700 µl mixture was

transferred to an Eppendorf tube containing 700 µl P:C:I and centrifuged for 5

minutes at 12000 rpm at room temperature. The total RNA was precipitated by mixing

the supernatant with 0,7 volume absolute ethanol, 1/20 volume 1M HAc. The pellet

was washed with 3M NaOAc (pH 5.2) and 75% EtOH, finally the pellet was

dissolved in DEPC-treated water and incubated at 65°C for 20 min to dissolve in

water. After another centrifugation, the supernatant was taken to a new Eppendorf

tube and stored at –20°C.

(35)

2.2.7.2. Isolation of total RNA from potato tubers

The process of isolating total RNA from potato tubers was modified according to the methods of isolating total RNA from potato leaves. There is much more starch in tubers than in leaves, so the fine powder with quick-extraction buffer should be centrifuged at 14000 rpm for a short time to discard the starch before transferring the supernatant to the P:C:I solution. RNA was dissolved in 500 µl DEPC-H

2

O after precipitation and incubated at 65°C for 10 min. After that a centrifugation at 13000 rpm for 10 min was carried out. Supernatant was moved to a new tube containing 550 µl LiCl (5 M), mixed and left at 4°C overnight. The mixture was centrifuged at 13000 rpm for another 10 min at room temperature. The pellet was treated as in section 2.2.7.1.

2.2.8. Concentration measurement of DNA and RNA

The quality and quantity of DNA was measured by comparison of band-intensity on ethidium bromide stained agarose gels with a DNA molecular weight standard, or alternatively, by the absorbance at 260 nm (Pharmacia LKB Ultrospec III). The quality and quantity of RNA were measured by the absorbance at 260 nm.

2.2.9. PCR amplification analysis

2.2.9.1. PCR amplification of plasmid DNA

PCR amplification from plasmid or colony (E.coli and Agrobacterium) template was performed in 50 µl volume as follows:

10 ng plasmid DNA or a single colony 5 µl 10 x Taq buffer

2 µl (10 mM) dNTPs (dATP, dGTP, dCTP, dTTP) 1 µl (10 pM) each primer

1 µl (1 U/µl) Taq DNA polymerase Amplification was carried out under the following conditions :

3 min at 94°C initial denaturation 5 sec at 94°C denaturation

30 sec at 55°C annealing 45 sec at 72°C extention

The last three stages were cycled 30 times, followed by a longer extention of 2 min at

(36)

72°C to ensure all reaction had been completed.

2.2.9.2. PCR amplification assays of transformed plants

Genomic DNA was taken (section 2.2.6) to perform the PCR reaction in 25 µl volume as follows:

0,5 µl genomic DNA 1 µl (10 pM) each primer 2,5 µl 10 x Ex Taq

TM

buffer 2 µl (2,5 mM each) dNTPs 0,1 µl (1 U/µl) Taq (Takara)

Amplification was carried out under the same conditions as in section 2.2.9.1.

2.2.10. Reverse transcription PCR amplification analysis

2.2.10.1. Reverse transcription

The following reaction was set up in 50 µl volume 5 µg total RNA

10 µl 5 x reverse transcriptase buffer 2 µl (10 U/µl) DNase I

The mixture was incubated at 37°C for 30 min, 5 µl 25 mM EDTA was added and heated to 65°C for 10 min to stop the reaction.

The following reaction was set up in 50 µl volume:

12,5 µl samples of above reaction 7,5 µl 5 x reverse transcriptase buffer 2 µl (500 µg/µl) oligo dT(12-15) 10 µl (2,5 mM) dNTPs

5 µl (0,1 M) DTT

1 µl (300 U/µl) Reverse transcriptase (SUPERSCRIPT

RT

, GIBCO, BRL)

The solution was incubated at 42°C for 1 h. The reaction was stopped by heating to

70°C for 15 min. The mixture was quick-chilled on ice. It can be used directly or

stored at –20°C for further use.

(37)

2.2.10.2. PCR amplification

PCR amplification from cDNA first strand templates was performed in 25 µl volume:

2,5 µl cDNA (from last step) 2,5 µl (320 mM) NH

4+

0,75 µl (50 mM) Mg

2+

0,75 µl (10 mM each) dNTPs 0,25 µl (1 U/µl) home Taq 0,75 µl (10 pM) each primers

Amplification was carried out under the same conditions as in section 2.2.9.1.

2.2.11. RNA Northern blot analysis

10 x running buffer (with distilled water, stored at 4°C)

2 M MOPS

0,05 M NaOAc

0,01 M EDTA

Hybridization stock solution (A+B) A, 1 M NaH

2

PO

4

, pH7,2 + 2 mM EDTA B, 14% SDS

Autoclave

20 x SSC

3 M NaCl

300 mM sodium citrate

For RNA work, an electrophoresis tank was designated as being for RNA work only

and kept free from RNase contamination. 40 µg total RNA was denatured in 7,5 µl 10

x running buffer, 9 µl formaldehyde, 30 µl formamide at 65°C for 10 min and then 2

µl 2 x stop buffer and 1 µl EtBr (1 mg/ml) were added for loading on gel. The

denatured RNA samples were electrophoresed in a 1,5% (w/v) agarose gel containing

6% (v/v) formaldehyde, 1 x running buffer. RNA was visualized under UV light and a

photograph was taken. The samples were then blotted onto a Hybond nylon

Abbildung

Figure 3.1:  Relation between potato tuber size and starch content Values are given in µmol C6 units g -1  Fwt.
Figure 3.4:  Northern blot analysis of potato tubers of BA and wild-type plants
Figure 3.6:  Starch and soluble sugar content in tubers of BA and wild-type plants
Figure 3.7:  Phosphorylated intermediates in tubers of BA and wild-type plants
+7

Referenzen

ÄHNLICHE DOKUMENTE

The stray starch metabolises relatively fast in the process water so that only a small amount of the starch introduced together with the recovered paper is retained in the

A meta- bolic scheme for the formation of UN-bearing compounds was proposed, in which nitric oxide and peroxynitrite derived from NO 2 or endogenous nitrogen oxides are involved

When comparing the number of leaves it was recognizable that there were no differences between atstr14 and wtcol but atstr1, atstr2 and atstr15 showed higher amount

Carrying the emulsification at lower temperatures did reduce the ag- glomerate production by allowing a quicker gelation and using pea starch that gels at higher temperature also

Sicher scheint, dass sich der Auszahlungspreis für Stärkekartoffeln künftig stärker an den volatileren Getreidepreisen orientieren wird, da einerseits die Stärkekartoffel auf

Skeletal muscle from SRP35TG mice under Chow diet did not present any significant change in fatigue resistance, however EDL and soleus muscles obtained from

Transgenic Potato Plants Expressing Soybean β -1,3-Endoglucanase Gene Exhibit an Increased Resistance to Phytophthora infestans.. Maria Borkowska, Magdalena Krzymowska,

Figure 3 Analysis of selected At GRP7 candidate target transcripts in transgenic lines with elevated or reduced At GRP7 levels. A) AtGRP7-ox and wt plants were grown in LDs