The Impact of Economic Uncertainty on Housing, Labor and Financial Markets
Dissertation zur Erlangung des Grades eines Doktors der Wirtschaftswissenschaft
eingereicht an der Fakultät für Wirtschaftswissenschaften der Universität Regensburg.
Vorgelegt von:
Binh Nguyen Thanh
Berichterstatter:
Prof. Dr. Gabriel Lee, Universität Regensburg Prof. Dr. Rolf Tschernig, Universität Regensburg
Tag der Disputation: 26.07.2017
First of all, I am deeply grateful for the guidance, advices and support from my first supervisor Prof. Dr. Gabriel Lee. I am also indebted to my sec- ond supervisor Prof. Dr. Rolf Tschernig for his support and advices. Moreover, I would like to thank Michael Heinrich, Stephan Huber, Stefan Rameseder and Johannes Strobel. For financial support, I thank the Bavarian Grad- uate Program in Economics. Finally, I am grateful to my family for their outstanding support.
ii
Contents in Brief
1 Introduction 1
2 Uncertainty, the Option to Wait and IPO Issue Cycles 9 3 Real Options Effect of Uncertainty and Labor Demand Shocks
on the Housing Market 38
4 Uncertainty and Trade 61
5 Conclusion 78
References 80
iii
Contents in Brief . . . ii
Contents . . . v
List of Figures . . . vi
List of Tables . . . viii
1 Introduction 1 1.1 Overview and Motivation . . . 2
1.2 The Notion of Uncertainty and Uncertainty Measures . . . . 3
1.3 Descriptive Statistics and Causality of the Uncertainty Mea- sures . . . 6
2 Uncertainty, the Option to Wait and IPO Issue Cycles 9 2.1 Introduction . . . 10
2.1.1 Related IPO Literature . . . 12
2.1.2 The Impact Mechanism of Uncertainty on the IPO Deci- sion . . . 13
2.2 Data and Econometric Specification . . . 16
2.2.1 IPO Activity Data . . . 16
2.2.2 Uncertainty Measures . . . 17
2.2.3 Descriptive Statistics . . . 17
2.2.4 Control Variables in Estimations . . . 20
2.2.5 Econometric Specification . . . 20
2.3 Uncertainty and IPO Activity . . . 21
2.3.1 The Impact of Uncertainty on the Number of IPOs . . 21
2.3.2 The Impact of Uncertainty on the IPO Timing . . . 25
2.3.3 Robustness Checks . . . 27
2.4 Uncertainty and the IPO Market Conditions . . . 28 iv
2.5 Conclusion . . . 30
3 Real Options Effect of Uncertainty and Labor Demand Shocks on the Housing Market 38 3.1 Introduction . . . 39
3.2 Data, Bartik Index and Uncertainty Measures . . . 43
3.2.1 Data . . . 43
3.2.2 Bartik Index . . . 43
3.2.3 Uncertainty Measures . . . 44
3.3 Estimation Methodology and Results . . . 47
3.3.1 Estimation Methodology . . . 47
3.3.2 Baseline Results . . . 48
3.3.3 Grouping States by Housing Price Volatility . . . 54
3.3.4 Grouping States by the Impact of Local Labor Demand Shocks . . . 55
3.3.5 Robustness Checks . . . 56
3.4 Conclusion . . . 56
4 Uncertainty and Trade 61 4.1 Uncertainty and Trade: Evidence from Germany . . . 61
4.1.1 Introduction . . . 62
4.1.2 Data and Econometric Specification . . . 63
4.1.3 Estimation Results . . . 64
4.1.4 Conclusion . . . 66
4.2 Vertical Specialization in the EU and the Causality of Trade. 69 4.2.1 Introduction . . . 70
4.2.2 Data and Comparative Advantage . . . 71
4.2.3 Causality . . . 72
4.2.4 Concluding Remarks . . . 75
5 Conclusion 78
References 80
v
1.1 Development of the Uncertainty Measures, 1990M1-2015M12. 7
2.1 Macro Uncertaintyand the Number of IPOs . . . 11
2.2 Real Option of Waiting . . . 15
3.1 House Price Growth Rates and Uncertainty Proxies . . . 39
3.2 Unemployment Rate and Labor Demand Shocks . . . 40
3.3 Periods of High Uncertainty . . . 46
3.4 The Impact ofMacro Uncertainty . . . 50
3.5 The Impact of Bartik andMacro Uncertainty . . . 52
3.6 The Impact of Bartik andState Uncertainty . . . 52
4.1 Impulse Response Function of Import Variables to aGerman Macro UncertaintyShock . . . 65
4.2 Forecast Error Variance Decomposition Due to an Innovation inGerman Macro Uncertainty . . . 66
4.3 Response of Import Variables to a One Standard Deviation Macroeconomic Uncertainty Shock Which Is Proposed by Rossi and Sekhposyan (2015) . . . 68
vi
List of Tables
1.1 Summary Statistics of the Uncertainty Measures . . . 6 1.2 Correlation of Uncertainty Measures . . . 7 1.3 Granger Causality Tests . . . 8 2.1 Summary Statistics of IPO Activity Variables and Uncertainty
Measures . . . 19 2.2 Correlation of IPO Number and the Uncertainty Measures 19 2.3 Time Series Analysis of IPO Number . . . 23 2.4 The Individual Impact of Different Uncertainty Measures on
IPO Number . . . 24 2.5 The Simultaneous Impact of Different Uncertainty Measures
on IPO Number . . . 25 2.6 The Impact of Different Uncertainty Measures on Number of
Filed IPOs and Number of Withdrawn IPOs . . . 27 2.7 Correlation of Macro Uncertainty and IPO Market Determi-
nants . . . 28 2.8 The Impact of Different Uncertainty Measures on IPO Mar-
ket Determinants . . . 30 2.9 Time Series Analysis of IPO Number with Two Lags . . . . 34 2.10 Time Series Analysis of IPO Number with One Lag . . . 35 2.11 Time Series Analysis of IPO Number without Monthly GDP 36 2.12 Time Series Analysis of IPO Number without GDP 1980M1-
2015M12 . . . 37 3.1 Number of Months Defined as Uncertain. . . 46 3.2 Long-run Effects of Uncertainty, Bartik and Interaction Term 49
vii
3.4 Long-run Effects of Bartik and Interaction Term Grouped by
the Magnitude of the Housing Price Volatility Over Time . . 54
3.5 Long-run Effects of Bartik and Interaction Term Grouped by the Impact of the Bartik in Each State . . . 55
3.6 Uncertainty Proxies . . . 57
3.7 Dependent Variables . . . 57
3.8 Control Variables . . . 58
3.9 Descriptive Statistics of the Housing Market Variables. . . . 58
3.10 Descriptive Statistics of the Uncertainty Measures and the bartik. . . 59
3.11 Sorted States, According to their Unconditional Housing Price Volatility over Time. . . 59
3.12 Sorted States, According to the Impact of thebartikin Each State. . . 60
4.1 Revealed Comparative Advantage in Parts, Components and Final Goods . . . 72
4.2 Summary of the Causality Analysis using SIC (AIC) . . . . 74
4.3 Example of Goods Categorized as Parts, Components or Final Goods . . . 77
viii
CHAPTER 1
Introduction
This dissertation comprises five chapters on economic uncertainty1. Chapter 1 provides a brief overview of the literature and the motivation for this dis- sertation. Moreover, the chapter also introduces the concept of uncertainty and presents different measures of uncertainty. Chapter 2 examines the role of economic uncertainty in explaining the U.S. Initial Public Offering (IPO) issue cycles, while chapter 3 analyzes the impact of uncertainty on the U.S. housing market. Chapter 4 quantifies the effects of uncertainty on (disaggregated) import flows using German data and is accompanied by an analysis on the revealed comparative advantage in trade of the EU-27 countries. Chapter 5 concludes.
The first section of this chapter provides an overview of the research on uncertainty and explains the motivation behind the dissertation, while the section 1.2 introduces the notion of uncertainty and presents various proxies for economic uncertainty which are used frequently in the dissertation. Sec- tion 1.3 presents descriptive statistics and causality tests of the uncertainty measures.
1In this dissertation, the terms “economic uncertainty" and “uncertainty" are used inter- changeably.
1
1.1 Overview and Motivation
“Uncertainty is largely behind the dramatic collapse in demand. Given the uncertainty, why build a new plant, or introduce a new product? Better to
pause until the smoke clears."
Oliver Blanchard2(The Economist, January 29, 2009, p. 84.)
In recent years, research on economic uncertainty as a factor influencing decisions of economic agents has enjoyed increased popularity, reflecting the recent growth of this strand of literature following the financial crisis. There are two main factors behind this boost in interest in uncertainty. First, the policy attention on the topic has increased due to the fact that uncertainty was likely a major driver of the Great Recession. Second, the increased availability of empirical proxies for uncertainty has facilitated empirical in- vestigations.
Two main transmission mechanisms through which uncertainty might affect real economic activities have been discussed intensely. Real options ef- fect arises in periods with high uncertainty under the assumption of (partial) irreversibility of investments (e.g., Bernanke, 1983; McDonald and Siegel, 1986; Pindyck, 1991; Bloom, 2009). The authors argue that firms look at their investment choices as a series of option and emphasize the importance of waiting: in periods of high uncertainty, firms wait and gather more infor- mation before making an irreversible investment decision. For example, if a firm is uncertain about the future demand for its products it may not want to invest in a new plant to increase production capacity, but prefers to wait and postpone the investment to future periods when uncertainty dissolves.
This real options effect relies on firms possessing the ability to wait and irre- versible (or at least costly to reverse) investment decisions; if the investment can be easily reverted without substantial costs or the firms immediately want to launch a new product, the option to wait may not be valuable.
Moreover, models combining uncertainty shocks with some sort of finan- cial frictions have also attracted a lot of attention in the past few years (e.g., Dorofeenko et al., 2008, 2014; Arellano et al., 2012; Christiano et al., 2014;
Gilchrist et al., 2014), which is most likely motivated by the recent global economic and financial crisis. For instance, Christiano et al. (2014) include a Bernanke-Gertler-Gilchrist financial accelerator mechanism in a standard
2Formerly Chief Economist of the IMF.
1.2. The Notion of Uncertainty and Uncertainty Measures 3
monetary dynamic general equilibrium model. In this setup, entrepreneurs transform raw capital into productive capital with uncertainty about the suc- cess of the transformation for each entrepreneur prior to the transformation process. Uncertainty is modeled as the time-varying second moment of the technology which converts raw capital into productive capital and only firms with high productive capital experience success. The authors show that this type of uncertainty shock accounts for a large share of the fluctuations in GDP.
While the aforementioned literature are primarily theoretical works on the impact of uncertainty, there are only a limited number of empirical stud- ies in this relatively new strand of literature. The goal of this dissertation is to widen the understanding of the impact of uncertainty on the economy by analyzing empirical data. In particular, the focus of this dissertation lies on quantifying the impact of uncertainty on financial, housing and trade markets.
1.2 The Notion of Uncertainty and Uncertainty Measures
Frank Knight (1921), the famous Chicago economist, provides the modern definition of uncertainty and defines uncertainty as peoples inability to fore- cast the likelihood of events happening (Knight, 1921). In contrast, he relates risk to the known probability distribution over a set of events. For example, flipping a fair coin does not qualify as uncertain since the likelihood of heads or tails is known; it is, however, risky because there is a 50% chance of ob- taining heads with a coin flip (Bloom, 2014). The disentanglement of risk and uncertainty is certainly often not possible with empirical data: Never- theless, it helps to clarify the difference between risk and uncertainty. In the empirical analyses, however, I follow the literature on uncertainty and use uncertainty measures which also incorporate elements of risk. I refer to Bloom (2014) for a more elaborated discussion of uncertainty and risk.
Uncertainty is an amorphous concept for which no objective measure ex- ists. In the following, I present different economic uncertainty measures which have been used frequently in studies analyzing the impact of uncer- tainty on the economy. These measures are also used frequently as proxies for different aspects of economic uncertainty in this dissertation.
Macroeconomic uncertainty proposed by Jurado et al. (2015) The macroeconomic uncertainty (Macro Uncertainty) measure proposed by Ju- rado et al. (2015) builds on the unforecastable components of a broad set of macroeconomic variables. Jurado et al. (2015) estimateMacro Uncertaintyas the conditional standard deviation “of the purely unforecastable component of the future value”. More specifically, they calculate for Ny=132 macroeco- nomic time series yjt∈Y =y1t, ...,y132tthe conditional standard deviation of the unpredictable component of theh-step-ahead realization:
Uy
jt(h)= q
E[(yjt+h−E[yjt+h|It])2|It], (1.1) whereyjt+h−E[yjt+h|It] denotes the h-step-ahead forecast error andE[.|It] the expectation taken conditional on the information setIt which is available at time t. TheMacro Uncertaintyis then computed as:
Uty(h)=
Ny
X
j=1
1 NyUy
jt(h). (1.2)
To computeUy
jt(h), Jurado et al. (2015) first form factors from a large set of economic and financial3indicators, which represent It. These factors are used to estimate the expected squared forecast errorE[(yjt+h−E[yjt+h|It])2|It].
This measure captures the predictability of the overall macroeconomic envi- ronment; the less predictable the macroeconomic variables, the higher the macroeconomic uncertainty. I use the one-month-ahead measure throughout the dissertation, since the data are at the monthly frequency.
Financial uncertainty proposed by Ludvigson et al. (2016) The com- putation of the financial uncertainty (Finance Uncertainty) measure by Lud- vigson et al. (2016) follows Jurado et al. (2015) but is based on 147 financial variables instead of 132 macroeconomic variables.
Economic policy uncertainty proposed by Baker et al. (2016) The economic policy uncertainty (Policy Uncertainty) measure proposed by Baker et al. (2016) proxies for movements in policy-related economic uncertainty.
The index quantifies the frequency of articles in 10 leading U.S. newspapers
3For the computation ofMacro Uncertainty, Jurado et al. (2015) also include 25 financial variables.
1.2. The Notion of Uncertainty and Uncertainty Measures 5
that contain the following triple of words: “economic" or “economy"; “un- certain" or “uncertainty"; and one or more of “congress", “deficit", “Federal Reserve", “legislation", “regulation" or “White House".
Chicago Board Options Exchange Volatility Index The Chicago Board Options Exchange Volatility Index (VIX) estimates the 30-day expected volatil- ity of the S&P 500 index. The formula4used in theVIX calculation is:
σ2= 2 T
X
i
∆K K2
i
eRTQ(Ki)− 1 T[ F
K0−1]2, (1.3) where
• T is the time to expiration,
• F the forward index level derived from index option prices,
• K0the first strike below the forward index levelF,
• Ki the strike price of the i-th out-of-the-money option; a call ifKi>K0; and a put ifKi<K0; both out and call ifKi=K0,
• ∆Ki the interval between strike prices,
• Rthe risk-free interest rate to expiration,
• Q(Ki) the midpoint of the bid-ask spread for each option with strikeKi,
• andσ=V I X100.
TheVIX is thereforeVIX=σ∗100. The underlying components of the VIX calculation are put and call options with more than 23 days and less than 37 days to expiration. For a more detailed explanation of theVIX, see the “VIX White Paper" on the homepage5of the Chicago Board Options Exchange.
4The formula is taken from the “VIX White Paper".
5https://www.cboe.com/products/vix-index-volatility/vix-options-and-futures/vix- index/the-vix-index-calculation.
1.3 Descriptive Statistics and Causality of the Uncertainty Measures
Table 1.1 shows the descriptive statistics of the four aforementioned uncer- tainty measures. Although the computation procedures for Macro Uncer- taintyandFinance Uncertaintyare the same, the mean as well as the volatil- ity of Finance Uncertaintyare substantially higher. This reflects the more unpredictable nature of the underlying 147 financial variables compared to the 132 macroeconomic series.
The column ERS (Elliott-Rothenberg-Stock) test statistic contains the test statistics of the Dickey-Fuller GLS unit root test which is proposed by Elliott et al. (1996)6. The lag lengths for the individual tests are chosen based on the Schwarz criterion. The null hypothesis of containing a unit root can be rejected for all time series. Moreover, using the Augmented Dickey-Fuller test also leads to the same conclusions.
Figure 1.1 depicts the evolution of the four uncertainty measures over time for the period 1990M1-2015M12, while Table 1.2 displays the cross- correlation of the measures. All uncertainty measures are positively cor- related and show dramatic increases during the financial crisis. Finance Uncertainty and the VIX are particularly highly correlated, which is not surprising, since both measures proxy the financial market uncertainty.
Table 1.1: Summary Statistics of the Uncertainty Measures
Obs Mean Std.
Dev.
Min Max
ERS test statistic Macro Uncertainty 312 0.664 0.088 0.557 1.083 -3.01***
Finance Uncertainty 312 0.900 0.184 0.643 1.542 -2.92***
Economic Policy Uncertainty 312 106.4 33.87 57.20 245.1 -4.31***
VIX 312 19.834 7.641 10.821 62.642 -4.61***
Descriptive statistics of the uncertainty measures, 1990M1-2015M12.
6The authors show that this test dominates the conventional Dickey-Fuller test in terms of small-sample size properties and power.
1.3. Descriptive Statistics and Causality of the Uncertainty Measures 7
-20246Normalized Uncertainty
1990m1 2000m1 2010m1
date
Macro Uncertainty Policy Uncertainty Finance Uncertainty VIX
Normalized Uncertainty Measures
Figure 1.1: Development of the Uncertainty Measures, 1990M1-2015M12.
Table 1.2: Correlation of Uncertainty Measures Macro Un-
certainty
Finance Uncer- tainty
Policy Un- certainty
VIX
Macro Uncertainty 1
Finance Uncertainty 0.714 1
Policy Uncertainty 0.352 0.381 1
VIX 0.650 0.853 0.456 1
Correlation of the uncertainty measures, 1990m1-2015M12.
Table 1.3 summarizes the p-value of the Granger causality test results for all uncertainty measures. For example, in order to obtain the test results in column (2), the following equation was estimated7:
7Two lags are recommended by the Schwarz criterion.
MUt=
2
X
j=1
αjMUt−j+
2
X
j=1
βjFUt−j+
2
X
j=1
δjPUt−j+
2
X
j=1
γjV I Xt−j+ut8. (1.4)
Subsequently, the null hypotheses β1=0&β2=0, δ1=0&δ2=0 and γ1= 0&γ2=0 were tested to determine ifFinance Uncertainty,Policy Uncertainty and theVIXare Granger causal forMacro Uncertainty, respectively. Corre- sponding estimations and tests were also performed to obtain the remaining columns. There is a high level of interconnectedness between the different uncertainty proxies. First, at the 5% significance level,Macro Uncertaintyis significantly explained by all other measures of uncertainty. Second,Finance Uncertaintyand theVIX significantly affect one another. Moreover,Finance Uncertaintyhelps to predict all remaining uncertainty proxies and, therefore, seems to be an important driver of the overall level of economic uncertainty.
Table 1.3: Granger Causality Tests (2) Macro
Uncer- tainty
(3) Finance
Uncer- tainty
(4) Policy Uncer- tainty
(5) VIX
Macro Uncertainty 0.365 0.800 0.380
Finance Uncertainty 0.016** 0.019** 0.000***
Policy Uncertainty 0.022** 0.025** 0.537
VIX 0.015** 0.005*** 0.1343
Causality tests of the uncertainty measures, 1990m1-2015M12. * indicates significance at 10% level, ** indicates significance at 5% level, *** indicates significance at 1% level.
8MUdenotesMacro Uncertainty,FU Finance UncertaintyandPU Policy Uncertainty.
CHAPTER 2
Uncertainty, the Option to Wait and IPO Issue Cycles
Abstract: This paper uses recently developed uncertainty measures to ex- amine the role of economic uncertainty in explaining the U.S. Initial Public Offering (IPO) issue cycles. Time series estimations reveal a strong and robust negative impact of macroeconomic and financial uncertainty on the IPO activity. For instance, an increase in macroeconomic uncertainty by one standard deviation lowers the number of monthly IPOs by roughly four in the long-run, which equals 20% of the average number of monthly IPOs. In response to an uncertainty shock, both the reduction of the number of IPO filings and the rise of withdrawn IPOs contribute to the lower number of IPOs. These results support the view that firms value the option to wait and tend not to go public during periods of high uncertainty, which is akin to the occurrence of the real options effect in periods of high uncertainty if investments are irreversible. However, there is no significant impact of eco- nomic policy uncertainty on the IPO market. The study also finds that high uncertainty worsens the IPO market condition by depressing stock prices, output, investor optimism and consumer sentiment.
9
2.1 Introduction
The cyclical nature of the number of initial public offerings (IPO number) is a highly debated phenomenon. Ibbotson and Jaffe (1975) and Ibbotson et al. (1988, 1994) highlight the substantial fluctuation of new IPO issues and more recent studies provide numerous explanations for the hot and cold IPO markets. Notably, the comprehensive empirical studies of Lowry (2003) and Ivanov and Lewis (2008) identify economic growth, stock market return, investor optimism and consumer sentiment as the most important determi- nants of IPO number. This paper provides an alternative view and argues that uncertainty surrounding the overall economy is also a key driver of IPO issue cycles.
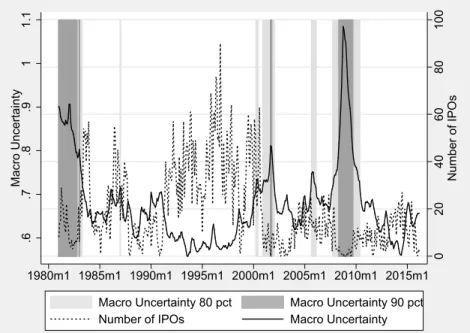
Figure 2.1 shows the evolution of IPO number and the macroeconomic uncertainty (Macro Uncertainty) measure by Jurado et al. (2015) for the period 1981M1-2016M3: there is a negative correlation of -0.43 between the two series and both variables exhibit pronounced cycles. If macroeconomic uncertainty is very high and exceeds for example its 80-th percentile1, the high level of uncertainty lasts for a considerable amount of periods before it dissolves2. For instance, the macroeconomic uncertainty exceeds its 80-th percentile for 32 consecutive months during the financial crisis (2007M10- 2010M5); for 28 consecutive months between 1981M1-1983M4 and for 14 consecutive months between 2000M12-2002M1. During those periods of high uncertainty IPO number drops quickly.
In fact, the president of NASDAQ, Adena Friedman, also relates IPO number to uncertainty and states3
“It’s an uncertain environment to go public in ...”
(Wall Street Journal, January 20, 2016.)4
to comment the sharp drop in the number of U.S. IPOs by 75% in the first quarter of 2016. However, neither the statistical reliability of the impact
1Exceeding its 80-th percentile means thatMacro Uncertaintyis greater than 80% of the values ofMacro Uncertaintyin the sample.
2Jurado et al. (2015), Ludvigson et al. (2016) and Lee et al. (2016) have documented and extensively discussed the high persistence of uncertainty shocks.
3https://www.wsj.com/articles/nasdaqs-friedman-says-ipo-environment-still-uncertain- 1453295483
4There are numerous popular press articles which relate IPO activity to uncertainty including the Wall Street Journal, the Financial Times, CNBC and the Washington Post.
2.1. Introduction 11
.6.7.8.911.1Macro Uncertainty 020406080100 Number of IPOs
1980m1 1985m1 1990m1 1995m1 2000m1 2005m1 2010m1 2015m1 Macro Uncertainty 80 pct Macro Uncertainty 90 pct Number of IPOs Macro Uncertainty
Figure 2.1:Macro Uncertainty and the Number of IPOs
Time series of the number of IPOs and Macro Uncertainty, 1981M1- 2016M3. “Macro Uncertainty 80 pct" and “Macro Uncertainty 90 pct" denote the periods in which Macro Uncertainty is greater than 80% and 90% of the values of Macro Uncertainty in the sample, respectively. Data on IPO number are provided by Jay Ritter (https://site.warrington.ufl.edu/ritter/ipo-data/), while Macro Uncertainty is collected from the website of Sydney Ludvigson (http://www.sydneyludvigson.com/data-and-appendixes/).
of economic uncertainty on the IPO activity nor the mechanisms of impact have been examined. The lack of appropriate uncertainty measures may have hindered an in-depth statistical analysis. This study fills this gap by using recently developed uncertainty measures and evaluate their impact on the IPO market. More specifically, I use the Macro Uncertaintyby Jurado et al. (2015), theFinance Uncertaintyby Ludvigson et al. (2016), thePolicy Uncertainty by Baker et al. (2016) and the VIX to quantify the impact of uncertainty on the IPO number, the number of filed IPOs and the number of withdrawn IPOs. Moreover, I also present a stylized model in which the impact mechanisms of uncertainty on the IPO decision can be retraced. The
model considers an IPO as an irreversible investment with the possibility of delay, and borrows from the literature on irreversibility of investment and uncertainty (e.g., Pindyck, 1991; Bloom, 2009).
Using the sample period 1990M1-2015M12 and controlling for a broad set of IPO market determinant variables, I find that a one standard deviation increase in macroeconomic uncertainty decreases IPO number by roughly four, which is 20% of the average number of IPOs per month. This result is driven by both the reduction of the number of filed IPOs and the rise of the number of withdrawn IPOs, and suggests that firms value the option of waiting instead of immediately going public during periods of high uncer- tainty. Furthermore, I find that uncertainty also distresses the overall IPO market condition by depressing stock prices, output, investor optimism and consumer sentiment. The results are qualitatively similar and robust for the VIX,Macro UncertaintyandFinance Uncertaintyin numerous specifications.
Policy Uncertainty, however, does not display a significant effect on the IPO activity.
2.1.1 Related IPO Literature
Numerous explanations for the hot and cold IPO markets have been proposed in the finance literature. Ritter (1991) relates IPO waves to the sentiments of investors, whereas Rajan and Servaes (1997) note that more firms complete IPOs when analysts are overoptimistic. Choe et al. (1993) and Yung et al.
(2008) focus on the role of adverse selection but arrive at contradicting con- clusions, since they make different assumptions about the serial dependence of innovation. However, the results of Helwege and Liang (2004) suggest that hot markets are not driven by adverse selection costs but are more likely af- fected by greater investor optimism. Lowry and Schwert (2002), Benveniste et al. (2003) and Alti (2005) highlight the role of information spillovers of pioneer IPOs which facilitate the pricing of subsequent issues and thus at- tract more firms to the IPO market. Pástor ˘a and Veronesi (2005) emphasize the importance of firms’ expectation about (aggregated) profitability in ex- plaining IPO number and Chemmanur and He (2011) argue that firms go public to grab market share from competitors after a productivity shock. The comprehensive studies of Lowry (2003) and Ivanov and Lewis (2008) test the empirical relevance of numerous explanations and identify past initial returns of IPOs, economic growth, stock market return, the term spread, the optimism of investors and consumer sentiment as the most important deter-
2.1. Introduction 13
minants of IPO number. I, thefore, include theses factors as control variables in the regression analyses.
2.1.2 The Impact Mechanism of Uncertainty on the IPO Decision
Typically the literature on uncertainty distinguishes between uncertainty and risk; risk is related to the known probability distribution over a set of events, whereas uncertainty is associated with peoples’ inability to forecast the likelihood of events happening (Knight, 1921). In this context, flipping a fair coin is not uncertain, since the likelihood of head or tail is known, but it is risky because there is a 50% chance to obtain head with a coin flip (Bloom, 2014). The disentanglement of risk and uncertainty is certainly often not possible with real world data. Nevertheless, it helps to clarify the difference between risk and uncertainty, and therefore facilitates the theoretical con- sideration of how uncertainty might affect the IPO decision in the current subsection. In the empirical analysis, however, I follow the literature on uncertainty and use uncertainty measures which also incorporate elements of risk.
Economic uncertainty could impact the IPO activity through different ways. First of all, given the irreversible nature of an IPO and the option to go public at a different point in time, high uncertainty may increase the option value of waiting of firms which consider the timing of their IPOs. For instance, a firm goes public only if it expects to raise at least as much capital as the firm is worth. However, if an uncertainty shock occurs and the firm is uncertain about how much it can expect to raise from the IPO, the firm may delay the IPO until uncertainty subsides. In addition, Lowry (2003) finds that firms go public if the business outlook is good and their demand for new capital to boost investment is high. If firms are uncertain about the economic development and thus uncertain about their own capital demand and associated new investments, they may wait and gather more information instead of immediately going public to raise capital for new investments. The reasoning that firms decrease investments in periods of high uncertainty is also supported by numerous studies (e.g., Bernanke, 1983; Pindyck, 1991;
Gulen and Ion, 2015).
The rationale that firms tend not to go public in periods of high uncer- tainty is consistent with the occurrence of the real options effect due to
uncertainty if investments are irreversible as described in Pindyck (1991):
"There will be a value to waiting (i.e., an opportunity cost to investing today rather than waiting for information to arrive) whenever the investment is irreversible and the net payoff from the investment evolves stochastically over time". In other words, when a firm makes an irreversible investment expenditure, it essentially gives up the possibility of waiting for new informa- tion that might affect the desirability or timing of the expenditure; it cannot disinvest should market conditions change adversely. Going public also rep- resents a form of “irreversible investment”, since a firm typically has only one IPO with an associated payoff which depends on the (time-varying) mar- ket condition. The higher the uncertainty about the market conditions, the more valuable the option to wait. A comparable waiting attitude can also be observed in the merger market as suggested by Bhagwat et al. (2016). They find that a one standard deviation increase in theVIX, a proxy for financial uncertainty, is associated with a 6% drop in public merger deal activity. Sim- ilarly, Jovanovic and Rousseau (2001) highlight the value of waiting in the IPO market. In their model, however, the option to delay an IPO is valuable if waiting allows a firm to gather more information about its own production function.
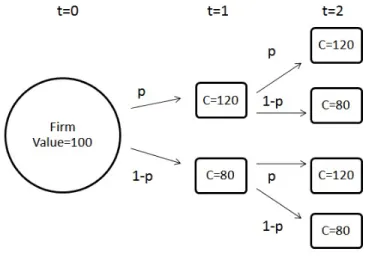
Figure 2.2 illustrates a stylized model of a firm’s decision about the tim- ing of its IPO and how uncertainty might affect this decision. Consider a firm with a true firm value of $100, and this firm could raise $120 (good market condition) with probability of pand $80 (bad market condition) with probability 1−pin an IPO. According to the notion of risk and uncertainty from above, going public is risky in general but not uncertain. It takes one period of time to prepare the IPO. For example, if in t=0 the firm decides to go public the factual IPO takes place in t=1. The firm decides to go public only if it expects to raise at least as much capital as the firm is worth. For simplicity, the discount rate is zero. In t=0, if there is no uncertainty at all, the firm assigns a value to pand decides to go public if p≥50%. However, if there is a one-period uncertainty shock in t=0 in the spirit of Knight (1921), the firm is not able to assign a value to pand postpones the IPO decision to period t=1 when the uncertainty shock subsides.
Analogously, if all IPO-interested firms are homogeneous and are all hit by the same one-period uncertainty shock in period t=0, there will be no IPOs in t=1. As the uncertainty shock disappears in t=1 and p≥0.5, all firms go public in t=2. For a set of heterogeneous firms a common uncertainty shock may still reduce the number of IPOs in the subsequent
2.1. Introduction 15
period if a fraction of those firms experience the shock similarly.
Figure 2.2: Real Option of Waiting
pis the probability to raise $120 as capital (C) in an IPO.
As suggested by Figure 2.1 and the literature on uncertainty, high uncer- tainty shocks are persistent and thus are likely to impede the IPO number for a considerable amount of time contributing to the creation of cold IPO market phases. As uncertainty eventually dissolves, IPO-interested firms start to go public in the same time slot, which in turn could give rise to IPO hot market phases.
Last but not least, high uncertainty could overshadow the IPO market condition by deteriorating the business outlook. For instance, Bloom (2009), Bansal et al. (2014) and Christiano et al. (2014) conclude that high uncer- tainty decreases output, consumption and investment5, while other studies find that uncertainty is negatively related to aggregated growth and asset prices (e.g., Ozoguz, 2009; Pástor ˘a and Veronesi, 2012; Segal et al., 2015). As pointed out by Pástor ˘a and Veronesi (2005) and Pástor et al. (2009), firms tend to go public if the expected (aggregate) profitability is high. Therefore,
5Some other studies on the impact of uncertainty on the real economy are Bernanke (1983), Pindyck (1991), Caballero and Pindyck (1996), Bachmann and Bayer (2013), Caggiano et al. (2014), Dorofeenko et al. (2014) and Leduc and Liu (2016). See Bloom (2014) for a more comprehensive review of the literature on uncertainty.
IPO-interested firms may anticipate a decline in expected profitability follow- ing an uncertainty shock and choose not to go public during periods of high uncertainty. In context of the presented stylized model, following an uncer- tainty shock a decline of the business outlook may translate to a decrease of
pand a decline of the payoffs in good and bad IPO market conditions. Both the drop of the probability to raise capital in a good market condition and the fall of the potential payoffs make firms less willing to go public.
The rest of the paper is organized as follows. Section 2.2 describes the data, analyses the time-series properties of the key variables and presents the econometric model. Section 2.3 examines the impact of uncertainty on the IPO activity. Section 2.4 investigates the effects of uncertainty on IPO mar- ket condition variables including S&P 500 return, output growth, investor optimism and consumer sentiment. Finally, section 2.5 concludes.
2.2 Data and Econometric Specification
The sample for this study is 1990M1-2015M126 and include monthly data on IPO activity, four different uncertainty measures and numerous control variables. Detailed information on the data is presented in the Appendix.
2.2.1 IPO Activity Data
The number of IPOs per month and the average, equal-weighted monthly IPO initial returns are fetched from the Ibbotson, Sindelar and Ritter (ISR) database. The initial returns represent the mean, across all IPOs each month, of the percentage difference between a closing price within the first month after the IPO and the offer price. A more complete description of the construc- tion of the data is in Ibbotson et al. (1994). Data on the number of filed IPOs and the number of withdrawn IPOs are provided by NASDAQ, and cover IPO activity on the NYSE and the NASDAQ for the period 1997M1-2015M12.
6Since the VIX and the monthly GDP data are not available for earlier periods. However, analyses with the sample 1980M1-2015M12 omitting monthly GDP deliver qualitatively the same results forMacro UncertaintyandFinance Uncertainty.
2.2. Data and Econometric Specification 17
2.2.2 Uncertainty Measures
Finding an appropriate uncertainty measure is a challenging task, since uncertainty is an amorphous concept for which no objective measure exists.
This study uses four uncertainty proxies which are based on different ap- proaches to approximate the latent stochastic process of uncertainty includ- ingMacro Uncertainty(Jurado et al., 2015),Finance Uncertainty(Ludvigson et al., 2016),Policy Uncertainty(Baker et al., 2016) and theVIX.
TheMacro Uncertaintyby Jurado et al. (2015) captures the predictability of the overall macroeconomic environment; the less predictable the macroeco- nomic variables, the higher the macroeconomic uncertainty. I decided to use the one-month-ahead measure, since the data are at a monthly frequency.
The computation of Finance Uncertainty (Ludvigson et al., 2016) follows Jurado et al. (2015) but uses 147 financial variables instead of 132 macroe- conomic variables as before. The Policy Uncertainty measure by Baker et al. (2016) proxies for movements in policy-related economic uncertainty by quantifying the frequency of articles in 10 leading U.S. newspapers which contain certain combinations of key words on economic policy uncertainty.
TheVIX estimates the 30-day expected volatility of the S&P 500 index. See section 1.2 for a more detailed description of the four uncertainty measures.
One could argue that the presented uncertainty measures capture a mix- ture of both uncertainty and risk. However, since these measures are fre- quently applied in studies that examine the effects of (economic) uncertainty, I refrain from disentangling (Knightian) uncertainty and risk in the empiri- cal part of the current paper and refer to a broader definition of uncertainty which also incorporates components of risk.
According to Lowry (2003), Pástor ˘a and Veronesi (2005) and Ivanov and Lewis (2008), firms consider the condition of both the real economy and the financial market before they go public. Macro Uncertainty, which also in- corporates uncertainty components of 25 financial variables, may therefore be the most potent uncertainty measure to explain the IPO activity, since it incorporates uncertainty about the real economy and the financial market.
2.2.3 Descriptive Statistics
Table 2.1 displays descriptive statistics of the IPO activity variables and the measures of uncertainty. There is substantial variation of the IPO number as well as of the number of filed IPOs. The number of withdrawn IPOs reached
its all time high of 40 in March 2001, in a period in which Macro Uncertainty exceeds its 90th percentile. Although the computation procedures forMacro UncertaintyandFinance Uncertaintyare the same, the mean as well as the volatility of Finance Uncertainty are substantially higher. This reflects the more unpredictable nature of the underlying 147 financial variables used for the computation ofFinance Uncertaintycompared to the 132 macroeconomic series7which underlie the computation ofMacro Uncertainty.
The column ERS (Elliott-Rothenberg-Stock) test statistic contains the test statistics of the Dickey-Fuller GLS unit root test which is proposed by Elliott et al. (1996)8. The lag length for the individual tests are chosen with respect to the Schwarz criterion. The null hypothesis of containing a unit root can be rejected for all time series. Using the Augmented Dickey-Fuller test leads to the same conclusions. The finding that IPO number is stationary is very much in line with Ivanov and Lewis (2008) who also use monthly data.
The cross-correlation of the uncertainty measures and the IPO number are presented in Table 2.2. Although the different uncertainty measures may capture different aspects of economic uncertainty, they are highly positively correlated indicating common sources of uncertainty or/and spillover effects of one type of uncertainty on another. Finance Uncertainty and the VIX exhibit a notably high correlation of 0.85, which is not surprising, since the VIX also proxies uncertainty surrounding the financial market. Moreover, all uncertainty measures are strongly negatively correlated with the number of initial public offerings suggesting an inverse relation between uncertainty and IPO activity.
7The 132 macroeconomic variables already contain 25 of financial indicators.
8The authors show that this test dominates the conventional Dickey-Fuller test in terms of small-sample size properties and power.
2.2. Data and Econometric Specification 19
Table 2.1: Summary Statistics of IPO Activity Variables and Uncertainty Measures
Obs Mean Std.
Dev.
Min Max ERS test statistic
Number of IPOs (IPO number) 312 19.669 17.562 0 100 -2.21**
Number of filed IPOs 228 36.236 19.824 5 128 -3.03***
Number of withdrawn IPOs 228 8.820 6.896 0 40 -6.84***
Macro Uncertainty 312 0.664 0.088 0.557 1.083 -3.01***
Finance Uncertainty 312 0.900 0.184 0.643 1.542 -2.92***
Policy Uncertainty 312 106.43 33.87 57.20 245.12 -4.3***
VIX 312 19.834 7.641 10.821 62.642 -4.61***
Sample statistics on IPO number,Macro uncertainty,Finance uncertainty,Policy uncertainty andVIX for the period 1990M1-2015M12. Sample statistics on the number of filed IPOs and the number of withdrawn IPOs for the period 1997M1-2015M12. Data on the number of filed IPOs and the number of withdrawn IPOs are provided by NASDAQ. ERS test statistic denotes the test statistics of the Dickey-Fuller GLS unit root test proposed by Elliott et al. (1996). The null hypothesis of containing a unit root can be rejected for all time series variables. * indicates significance at 10% level, ** indicates significance at 5% level, ***
indicates significance at 1% level.
Table 2.2: Correlation of IPO Number and the Uncertainty Measures Number
of IPOs
Macro Uncer- tainty
Finance Uncer-
tainty
Policy Uncer- tainty
VIX
Number of IPOs 1
Macro Uncertainty -0.508 1
Finance Uncertainty -0.312 0.714 1
Policy Uncertainty -0.477 0.352 0.381 1
VIX -0.327 0.649 0.852 0.456 1
Correlation of the IPO number and uncertainty measures, 1990M1-2015M12.
2.2.4 Control Variables in Estimations
The results of Lowry (2003) and Ivanov and Lewis (2008) suggest that the business condition, the investor and the consumer sentiments are the most important drivers of IPO cycles9. Demand for capital should be higher when business conditions are more promising. For example, firms have higher demand for capital in order to make (new) investments in times of economic growth, and if the financing costs from traditional bank loans are too high, the firms may raise money from the public. Moreover, companies are more likely to go public if investors are overoptimistic and willing to pay more for those companies than they are worth. For example, Lee et al. (1991) and Rajan and Servaes (1997) find that investor sentiment affect the IPO activity over time. Additionally, Lowry and Schwert (2002) find a robust and significant impact of past average initial returns on the IPO number. This relationship is attributed to the information learned during the registration period. In particular, they argue that more companies file IPOs following periods of high initial returns because the high returns are linked to positive information learned during the registration periods, indicating that compa- nies can raise more money in an IPO than they had previously thought.
Accounting for the findings of the literature, I include the S&P 500 return, the real GDP growth, the real industrial production growth, the term struc- ture, the average initial return, the investor sentiment and the consumer sentiment as control variables.
2.2.5 Econometric Specification
Given the stationarity of the IPO activity variables and the uncertainty mea- sures, the following econometric model is estimated:
I PON umbert=β0+
k
X
i=1
αiI PON umbert−i+
k
X
i=1
βiU ncertaint yt−i+
k
X
i=1
Xt−iδi+ut, (2.1)
where I PON umber is the number of IPOs, U ncertaint y denotes the chosen uncertainty measure,Xt−i is a vector containing the aforementioned control variables in t−iandδi is the corresponding coefficient vector.
9See Lowry (2003) for further discussions of how the business condition and investor sentiment affect the number of firms going public.
2.3. Uncertainty and IPO Activity 21
In order to guard against endogeneity issues, all explanatory variables are lagged. I include the first three lags of all explanatory variables in the benchmark specification. Three lags are a conservative choice, since a large set of explanatory variables are included. Using monthly data, Lowry and Schwert (2002) include three lags in a model with two explanatory variables, while Ivanov and Lewis (2008) use up to two lags. In specifications with two or one lag(s) the impact of the uncertainty measures are even more significant10.
I present the long-run effects of each variable in the estimation results section to ease interpretation11. For example, instead of presenting every individual ˆβi coefficient of the impact of uncertainty, I present the long-run impact of uncertaintyP3
i=1βˆi and the corresponding standard error.
2.3 Uncertainty and IPO Activity
This section investigates the impact of economic uncertainty on IPO activity.
Throughout the remainder of the paper, Newey-West standard errors (Newey and West, 1987) are used in order to account for possible heteroskedasticity and autocorrelation of the error term. I decided to useMacro Uncertaintyas the measure in the benchmark specification, since it quantifies the overall macroeconomic uncertainty including uncertainty about financial and real variables. Note that the initial return is missing in months when no IPOs occur.
2.3.1 The Impact of Uncertainty on the Number of IPOs
Table 2.3 displays the impact ofMacro Uncertainty on the number of IPOs per month controlling for a large set of variables. Column (1) represents the benchmark specification withMacro Uncertaintyas uncertainty measure and all control variables included, while the other columns present alterna- tive specifications. Macro Uncertainty significantly impedes IPO number throughout specifications and its impact magnitude also remains moderately constant. A standard deviation increase in Macro Uncertainty lowers the
10The results are presented in the Appendix.
11Presenting estimations of a large set of explanatory variables with there corresponding first three lags in one table may be confusing and impedes readability.
number of IPOs on average by roughly four IPOs12. Moreover, specifications withMacro Uncertaintyalways dominate corresponding specifications with- out it in terms of explanatory power as suggested by the adjusted R, the Akaike criterion and the Schwarz criterion.
Column (2) presents the estimation results for a specification without Macro Uncertainty. Naturally, the adjusted R falls and the Akaike criterion and the Schwarz criterion rise in this specification compared to column (1), which indicates thatMacro Uncertaintyhas a very high explanatory power.
In absence ofMacro Uncertaintyin column (2), the consumer sentiment gains more explanatory power and its long-run coefficient and t-statistic increase, so that its impact even becomes significant at the 10% significance level. This result indicates a notable dependence between Macro Uncertaintyand the consumer sentiment and suggests that the explanatory power of consumer sentiment is based on its considerable correlation withMacro Uncertainty;
the correlation is -0.44.
There is also a significant autoregressive component in the IPO number itself. Alti (2005) provides a possible explanation for this finding. He argues that the outcomes of pioneers’ IPOs contain private information on common valuation factors of investors. This facilitates the pricing of subsequent is- sues and attracts more firms to go public soon after. The level of initial return also has a significant impact on the number of IPOs in the benchmark specification. Lowry and Schwert (2002) attribute this relationship to the in- formation learned during the registration period. Moreover, S&P 500 returns show a significant impact on the IPO number, which reflects that the number of IPOs increases if the financial market returns are higher. In summary, the significant impact of the control variables are very much in line with Lowry and Schwert (2002), Lowry (2003) and Ivanov and Lewis (2008).
To compare the impact ofMacro Uncertaintywith those of the other uncer- tainty measures, Table 2.4 displays the impact of each uncertainty measure on the number of IPOs in the benchmark specification with all control vari- ables. Both financial market uncertainty indicators Finance Uncertainty and theVIX have statistically significant adverse effects on the number of IPOs. In economic terms, a one standard deviation increase inFinance Uncer- tainty and the VIX decrease the number of IPOs on average in the long-run
12(P3
i=1βˆi,MacroU ncertaint y) ∗ σˆMacroU ncertaint y = −39.7 ∗ 0.088 ≈ 3.5, where σˆMacroU ncertaint yis the standard deviation of Macro Uncertainty
2.3. Uncertainty and IPO Activity 23
Table 2.3: Time Series Analysis of IPO Number
Explanatory Variables (1) (2) (3) (4) (5) (6)
Macro Uncertainty -39.7*** -41.1*** -44.4***
(12.83) (11.91) (12.90)
Control variables
IPO number .7730*** .7634*** .7774*** .8261*** .7797*** .8670***
(.0578) (.0624) (.0611) (.0613) (.0591) (.0542)
Underpricing .0676** .0394 .0734* .0509 .0794* .0657
(.0326) (.0496) (.0417) (.0472) (.0463) (.0488)
Term structure .0095 .3848 -.149 .5127 -.294 .4756
(.6255) (.6684) (.5426) (.6411) (.5850) (.5898)
SP 500 return 70.95* 85.78* 56.75* 101.0**
(39.88) (44.46) (31.71) (43.10) Industrial production growth 88.70 443.9* 79.83 311.3
(246.1) (247.6) (241.1) (242.0)
GDP growth -400. -249. -400. -287.
(295.7) (281.4) (275.3) (282.3)
Consumer sentiment .0426 .1616* -.047 .0189
(.1002) (.0948) (.0830) (.0803)
Investor sentiment -3.31 -7.71 4.643 3.478
(8.119) (8.332) (6.545) (6.704)
N 257 257 257 257 279 279
Adjusted R .6647 .6192 .6699 .6427 .6616 .6371
Akaike Criterion 4.776 4.889 4.740 4.829 4.716 4.776
Schwarz Criterion 5.163 5.221 5.044 5.175 4.950 4.971
The table shows regressions in which the number of IPOs is the dependent variable. Robust standard errors are in brackets. * indicates significance at 10% level, ** indicates signifi- cance at 5% level, *** indicates significance at 1% level. The sample is 1992M1-2015M12, since the monthly GDP variables are not available prior to 1992. Regressions with a sample 1990M1-2015M12 without GDP growth deliver very similar results.
by roughly three and three, respectively13. This result is intuitive, since a firm wants to raise as much public capital as possible in an IPO and high financial market uncertainty is likely to depress investors’ willingness to invest. The impact ofPolicy Uncertaintyis, however, only significant at the 10% significance level and the estimation withPolicy Uncertaintyshows the lowest explanatory power as indicated by the Adjusted R, Akaike criterion and Schwarz criterion. In contrast, Macro Uncertaintycontains the high- est explanatory power which supports the view that firms take into account the uncertainty from the real economy and the financial market when they
13Finance Uncertainty: (P3
i=1βˆi,F inanceU ncertaint y)∗σˆF inanceU ncertaint y=15.01∗0.184≈ 2.76.VIX: (P3
i=1βˆi,V I X)∗σˆV I X=0.447∗7.641≈3.41.
consider an IPO. The finding thatMacro Uncertaintyis the most important uncertainty driver of IPO activity is further supported by Table 2.5, which shows the estimation results of a specification in which all control variables and all uncertainty measures are included. In this specification, only the macroeconomic uncertainty measure displays a significant negative impact on the IPO number.
Given the robust negative impact of uncertainty on the IPO number, a persistent and high uncertainty shock could impede the IPO activity for a con- siderable amount of periods. As high uncertainty disappears IPO-interested firms, who valued the option to wait during periods of high uncertainty, start to go public in the same time slot. The empirical results strongly support the view that time-varying uncertainty is an important driver of IPO issue cycles.
Table 2.4: The Individual Impact of Different Uncertainty Measures on IPO Number
Uncertainty measure Impact on IPO number
N Adjusted
R
Akaike Criterion
Schwarz Criterion
Macro Uncertainty -39.7*** 257 .6647868 4.776425 5.163095 (12.838)
Finance Uncertainty -15.01*** 257 .6532018 4.810401 5.197072 (4.9390)
Policy Uncertainty -.0418* 257 .6419197 4.842416 5.229085 (.02294)
VIX -.4469*** 257 .6536126 4.809216 5.195886
(.14168)
The table shows the individual impact of the different uncertainty measures on the num- ber of IPOs. The control variables in all estimations are the first three lags of S&P 500 return, GDP growth, industrial production growth, term structure, consumer sentiment and investor sentiment. Robust standard errors are in brackets. * indicates significance at 10% level, ** indicates significance at 5% level, *** indicates significance at 1% level.
The sample is 1992M1-2015M12, since the monthly GDP variables are not available prior to 1992. Regressions with a sample 1990M1-2015M12 without GDP growth deliver very similar results.
2.3. Uncertainty and IPO Activity 25
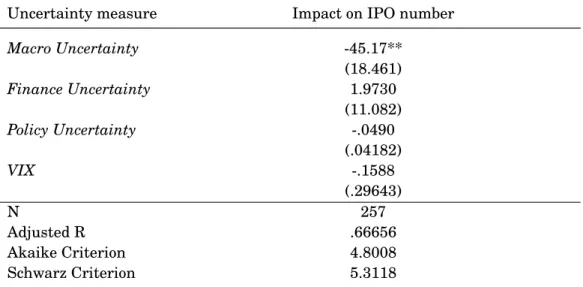
Table 2.5: The Simultaneous Impact of Different Uncertainty Measures on IPO Number
Uncertainty measure Impact on IPO number
Macro Uncertainty -45.17**
(18.461)
Finance Uncertainty 1.9730
(11.082)
Policy Uncertainty -.0490
(.04182)
VIX -.1588
(.29643)
N 257
Adjusted R .66656
Akaike Criterion 4.8008
Schwarz Criterion 5.3118
The table shows the impact of the different uncertainty measures on the number of IPOs in a model where all uncertainty measures and control variables are included . The control vari- ables in all estimations are the first three lags of S&P 500 return, GDP growth, industrial production growth, term structure, consumer sentiment and investor sentiment. Robust standard errors are in brackets. * indicates significance at 10% level, ** indicates signifi- cance at 5% level, *** indicates significance at 1% level. The sample is 1992M1-2015M12, since the monthly GDP variables are not available prior to 1992. Regressions with a sample 1990M1-2015M12 without GDP growth deliver very similar results.
2.3.2 The Impact of Uncertainty on the IPO Timing
In general, companies and/or underwriters have three ways to influence the timing of an IPO. First, companies can choose the time to file the issue.
Second, the planned issue date can be changed. Third, they can withdraw the issue. The strong negative relationship between uncertainty and the subsequent number of IPOs indicate that firms time their IPOs in response to the level of uncertainty. This subsection sheds light on the IPO timing of firms and investigates the relation between uncertainty and the number of IPO filings and the number of withdrawn IPOs.
Table 2.6 presents the estimation results for the number of filed and the
number of withdrawn IPOs which are explained by different uncertainty measures, controlling for the whole available set of control variables from Equation (2.1). In other words, the I PON umber from Equation (2.1) is re- placed by the number of filed and the number of withdrawn IPOs, respectively.
Here, the number of withdrawn IPOs are weighted by the sum of the number of filed IPOs in the four previous months. This weighting approach is analo- gous to Lowry and Schwert (2002) and scales the number of withdrawn IPOs by the number of firms which could have possibly withdrawn their IPOs14. However, no weighting or weighting with less than four months lead to the same qualitative conclusion. I include the first two lags of all explanatory variables, considering the smaller sample size and the recommendation of the Schwarz criterion.
All uncertainty measures have significant negative impact on the IPO timing, except for Policy Uncertainty. The insignificance of Policy Uncer- taintyis expected, sincePolicy Uncertaintydoes not impact the IPO number significantly in the analysis of the previous subsection. An increase in un- certainty leads to a lower number of firms who file an IPO and raises the number of withdrawn IPOs. The latter is particularly notable, since with- drawing an IPO has numerous associated costs. First, withdrawing an IPO may delay profitable investment due to financing shortage. This cost is par- ticularly high for firms in nascent industries in which an early entrance ensures first-mover advantages. A second cost of withdrawing an IPO is the increased uncertainty about the firm valuation and an associated bad repu- tation, which may hinder raising capital from the public securities markets in the future. Lerner (1994) argues that even if the stated reason for the IPO withdrawal is poor market conditions, the firm may still be lumped with other companies whose offerings did not sell because of questionable accounting practices or gross overpricing. In the same vein, Dunbar and Foerster (2008) discover that only about 9% of withdrawn IPOs are able to return to have a successful IPO and Lian and Wang (2009) find that the negative connotations of the first-time withdrawal translate into lower valuations for second-time IPOs. Therefore, high uncertainty seems to be of significant importance to the firms, so that they withdraw their IPO in response to an uncertainty shock despite the potential withdrawal costs.
14By using the scaled number of withdrawn IPOs in the regression, the magnitude of impact cannot be easily calculated. However, the sign and significance of impact can still be interpreted straightforwardly: A positive and significant coefficient of uncertainty indicates that an increase in uncertainty leads to an increase in withdrawn IPOs on average.
2.3. Uncertainty and IPO Activity 27
Table 2.6: The Impact of Different Uncertainty Measures on Number of Filed IPOs and Number of Withdrawn IPOs
Uncertainty measure Impact on Number of filed
IPOs
Impact on the weighted Number of withdrawn IPOs
N
Macro Uncertainty -43.92*** .16705** 205
(15.498) (.06942)
Finance Uncertainty -11.25** .07937*** 205
(5.1210) (.02894)
Policy Uncertainty -.0093 .00006 205
(.02840) (.00012)
VIX -.4245** .00198** 205
(.16599) (.00093)
The table shows the individual impact of the different uncertainty measures on the number of filed IPOs and number of withdrawn IPOs. The control variables in all estimations are the first three lags of S&P 500 return, GDP growth, industrial production growth, term structure, consumer sentiment and investor sentiment. Robust standard errors are in brackets. * indicates significance at 10% level, ** indicates significance at 5% level, ***
indicates significance at 1% level. The sample is 1997M1-2015M12.
2.3.3 Robustness Checks
The empirical results are qualitatively similar under numerous specifications.
Specifically, I use different lag specifications, include the NBER recession dummy, include the business condition variables as leads, exclude some ex- planatory variables, include an alternative investment sentiment measure15, perform F-test on the joint impact of the lags of each explanatory variable and alternate the maximum lag of autocorrelation in the error term. More- over, estimations of corresponding autoregressive conditional count models also deliver qualitatively comparable results. Estimation methods include Poisson Maximum-Likelihood, Binomial Maximum-Likelihood, Exponential
15The alternative investment sentiment measure is computed by using the data on the fraction of bullish investors minus the fraction of bearish investors from Investors Intelli- gence (http://www.investorsintelligence.com/x/default.html).
Quasi-Maximum-Likelihood and Normal Quasi-Maximum-Likelihood. Last but not least, I estimate the impact ofMacro UncertaintyandFinance Uncer- taintywith the sample 1981M1-2015M12 without monthly GDP as control variable and obtain similar results16.
2.4 Uncertainty and the IPO Market Conditions
The finding that companies do not go public and even cancel their IPO is- sue in response to high uncertainty suggests that uncertainty may have a depressing effect on the (subsequent) IPO market condition. Therefore, this section investigates the impact of uncertainty on the variables which are con- sidered to be the key determinants of the IPO market conditions (e.g., Lowry, 2003; Ivanov and Lewis, 2008). Table 2.7 presents the correlations ofMacro Uncertaintywith the IPO market condition variables.Macro Uncertaintyis negatively correlated with all market condition variables, while the market condition variables are positively correlated with each other.
Table 2.7: Correlation of Macro Uncertainty and IPO Market Determinants Macro
Uncer- tainty
S&P 500 return
Ind.
Pro- duc- tion growth
GDP growth
Investor senti- ment
Consumer senti- ment
Macro Uncertainty 1
S&P 500 return -0.201 1
Ind. Production growth -0.422 -0.005 1
GDP growth -0.155 0.0939 0.216 1
Investor sentiment -0.263 0.442 0.170 0.154 1
Consumer sentiment -0.440 0.121 0.232 0.131 0.503 1
Correlation of Macro uncertainty and IPO market determinants for the period 1992M1- 2015M12.
16The estimation results forMacroU ncertaint yare presented in the Appendix.