1
Regulation of services industries and ICT diffusion:
Accounting for upstream and downstream linkages
Iain Patterson*
Ana Rincón-Aznar**
Richard Sellner*
Bianca Brandl*
Catherine Robinson**
Abstract
Excess regulation is often considered to be a barrier to growth because it stifles competition and prevents the market from and efficient functioning in the allocation of resources. Recently, empirical research has focused on the forward or “knock-on” impact that regulation of key input-providing services industries has across the economy. Our main results suggest that a) Regulation hinders ICT capital accumulation but only when accounting for the harmful effects of both forward and backwards linkages between heavily-regulated sectors the rest of sectors. This is found mainly in the services sectors where most of the productivity differences between high-regulation and low-regulation countries seem to lie. We find that in addition to regulatory effects being transmitted forward (“knocked-on) they may induce negative effects on production through backward linkages b) Regulation significantly harms the ability to translate ICT into productivity gains.
** IHS Viena, Austria; ** The National Institute of Economic and Social Research (NIESR)
2
1. Introduction
The ICT revolution of the 1990s resulted in a surge of productivity growth in the US economy, reversing a post war trend of catch-up in EU nations (O’Mahony and Timmer, 2010). ICT technologies were available worldwide at decreasing prices, but many European countries showed a lower ability to invest in and benefit from the new information and communication technologies. It was thus puzzling that nations that shared similar structural characteristics, namely education of the workforce, openness to trade etc were unable to capitalise in productivity terms to the same extent as the US (Gust and Marquez, 2004).
Some attributed this to a first mover advantage in investing in the upcoming technology (Jorgenson and Stiroh, 2000), and consensus soon emerged that the main problem faced by many European countries was how to the raise productivity effects of ICT investments (Daveri, 2003); it has been widely argued that the institutional settings in which firms operate may have played a role in these developments.
Since the start of the current crisis, the labour productivity gap with respect to the US has been aggravated, and the experiences of the European countries have been increasingly uneven, with countries such as Ireland, the southern countries and United Kingdom lagging behind (Mackinsey, 2011). In these times there is some imperative to understanding the causes of the productivity gap and any role that regulation may play.
Productivity performance in many European countries has lagged behind the US, driven by a relatively poor performance of market services. These sectors are characterised by a higher level of ICT diffusion (O'Mahony and van Ark, 2003; Timmer et al 2010). From a policy perspective, economic reforms have been central to the European Union’s single market programme. Economic gains were thought to stem from the single market, as a result of the intensification of competition in markets, efficiency gains resulting from reduction of trade barriers and economies of scale induced by expansion of the market (Nicodème and Sauner-Leroy, 2007). Reforms have been central to the Lisbon strategy launched in 2000, in which they were identified as a means of directly increasing productivity in the EU. More recently, the Europe 2020 agenda set out by the June 2010 European Council emphasizes the need to deepen the internal market for services which given the importance of the service sector as input provider to other sectors. The Annual Growth Survey
12011, which monitors the progress in the implementation of the early stages of the Europe 2020 agenda, considers that more priority has to be given to those structural reforms needed to foster long-run growth and job creation.
Attempts to quantify the widespread implications that strict regulatory environment has on economic performance have been hampered by the fact that regulations are wide-ranging, in some cases sector specific, and are likely to fall more on certain sectors than others). While some research analyses the implications of de-regulating sectors previously sheltered from competition on economic performance, recently the literature recognises the broader economic role of lack of competition in key sectors. As well as a direct effect on productivity, it is increasingly recognised that there are indirect impacts to industry regulations as they feed through the supply chain (see Bourles et al, 2010). Recent papers have sought to understand the role that regulation of upstream sectors has on productivity further downstream in the supply chain by examining input-output relationships with other sectors (Barone and Cingano, 2011).
We contribute to the literature by investigating the impact that upstream regulations in key services sectors have on performance across other sectors. But rather than ...In this paper we focus on a number of outcomes.. Our empirical analysis draws on cross-country evidence from measures of regulation regulation. These are then used to augment industrial productivity account accounts data from EUKLEMS for the period spanning from 1975 to 2007.
1
http://ec.europa.eu/europe2020/pdf/1_en_annexe_part1.pdf
3 The paper is organised as follows: in section 2 we present a synthesis of existing empirical evidence in relation to sector productivity growth, regulation and ICT capital. Section 3 outlines the main data sources used in our analysis. Sections 4, 5 and 6 specify the models estimated for each of our dependent variables (investment, productivity) and contain the results. Section 7 draws our findings together, highlighting key policy insights emerging from this work
2. Empirical evidence
The relationship between competition and productivity has been explored extensively (c.f. Aghion and Griffith, 2005) and yet there is still a tendency to keep productivity quite separate from the competitive environment in empirical microeconomic studies of the determinants of productivity. Bourles et al (2010) highlight the three channels through which productivity and competition interact. These are innovation, technology adoption and reallocation. Innovation and technology adoption relate to firms at the technology frontier, competing neck and neck to produce most for least – these may be regarded as within-sector competitive pressures but are likely to be in part determined by the providers of intermediate inputs and the competitive conditions in which these providers operate as well as the relationship firms have with their intermediate input suppliers. It is specifically with this relationship and its effect on performance on which this paper focuses. The reallocation element is consistent with the Schumpetarian creative destruction as the least efficient firms exit, allowing the reallocation of resources to existing and new firms. Jones (2011) illustrate how misallocation of resources can reduce TFP, and suggest that because the output of many firms are used as the inputs of other firms the effects of misallocation can be amplified.
The competitive environment is generally defined by the regulatory structures in place. Bourles et al (2010) argue that services sectors have attributes that make them more protected from competitive pressures than perhaps manufacturing sectors in that they may be subject to the need for proximity or that they require a national network infrastructure to function. If the nature of a firm’s relationship with its intermediate inputs provider is such that they face higher than optimal costs, there is a clear indirect impact of product market regulation through the supply chain. Moreover, increasing the value added in production requires more service input than ever before, so the links between manufacturing and services are increasingly strong. Earlier empirical research echoes this; the productivity growth differential was in part due to lack of competition in the product markets, and particularly in services, where the regulatory burden creates disincentives to innovate and invest (Alesina et al 2005; Allegra et al, 2004).
Bourles et al (2010) discuss the two channels through which product market regulation could negatively affect a downstream sector and ultimately lower productivity performance. Firstly, there may be a negative productivity effect when access to downstream markets requires upstream inputs, especially when import competition is limited and search costs (for a supplier) might be high. This sort of constraint may lead to barriers to entry and limit firm growth. Secondly, even if access is not restricted downstream as a result of regulation upstream, it may still distort incentives to downstream firms since imperfect markets may require longer negotiations between upstream suppliers and downstream firms, in which upstream suppliers will aim to capture any potential rents.
Arnold et al (2008) argue that the tight regulatory environment in the service sectors of EU countries has
adversely affected the so-called ICT-using sectors since they intensively require as inputs the outputs
from these heavily regulated sectors – thus producing a ‘knock-on’ effect. Their paper is able to explore
this issue using firm level data and identifies one of the main problems as being allocative efficiency as
movement of resources to more efficient uses is hampered by the regulation. Moreover, they find that
4 firms worst affected are those that are likely to contribute most to productivity growth – those that have the potential to reach the international technology frontier. Thus, their analysis suggests that not only is regulation in key services harmful, it is more harmful to the most able firms.
If regulation has limited the adoption of ICT one would expect to observe a direct effect of regulation on ICT investment. Indeed, regulation may well impact on other forms of investment as it distorts input prices. Using a panel of OECD countries, Alesina et al (2005) explore the interaction between regulation and investment in seven non-manufacturing sectors within transport, communications and utilities. They find that reforms have a positive and significant effect on investment in these sectors; however they note that small changes in heavily regulated sectors are unlikely to have significant impacts, suggesting that the changes to regulation have to be substantial and the sector already relatively competitive before it makes a difference.
Empirical evidence concerning services sectors is weak and the majority of empirical work focuses mainly on the direct effects of regulation on the most heavily regulated sectors of the economy (Alesina et al, 2005, Nicoletti and Scarpetta, 2003). For the manufacturing sector, Barone and Cingano (2011) have found recently that lower service regulation increases value added, productivity, and export growth in downstream service-intensive manufacturing industries; Barone and Cingano also find that the negative effects of anti-competitive regulation for manufacturing sectors is mainly driven by regulation in energy and professional services.
Competition is a multifaceted concept and competitiveness is defined not only by product market regulations; the lack of flexibility in labour markets is also an important part of the explanation for divergence in growth (c.f. Blanchard and Wolfers, 2000). Firing costs interfere with a firm’s optimal input choices making them cautious about hiring and also affecting decisions about other input accumulation choices (e.g. ICT capital) required to realise productivity gains. Although there has been de-regulation over recent years, Arnold et al (2008) point out that the timing of the de-regulation waves relative to the ICT boom may have caused diverging patterns of ICT adoption and total factor productivity performance. See Rincon-Aznar et al 2010 for a comprehensive literature review on the effects of product and labour market regulation on a wide range of economic outcomes.
Cette and Lopez (2012) compare ICT demand behaviour across countries and provide empirical explanations for the gaps in ICT diffusion. Using country-level data they find a negative impact of market rigidities and human capital on ICT diffusion, measured as the share of ICT in the total’s economy compensation. Also at macro level, Guerrieri et al (2011) examine the determinants of ICT diffusion from the 1990s onwards for developed countries. They find that tighter regulations depress ICT investments; they find that the regulations that matter the most are administrative barriers and regulation of services industries, while the role of employment protection legislation is not as important.. Other factors that play an important role include the human capital (in particularly the proportion of researchers in a country’s population) and the sectoral composition of an economy.
3. Data description
When examining the link between anti-competitive regulation and performance, the traditional approach followed in the empirical literature has been to relate some indicators of market structure (say price cost margins, concentration indices) to economic outcomes measures, such as productivity and innovative activity. One of the most common criticisms that this approach has received is that it is plagued with endogeneity problems and therefore the establishment of causal relationships is often compromised.
In recent years, a more novel approach proposed by Nicoletti and Scarpetta (2003) and followed by many
others, consist in the use indicators that proxy for the level of regulation, rather than in the use of direct
5 measures of intensity of competition. This method has been widely used lately in empirical economy-wide level and industry-level analyses. This kind of indicators aims to quantify a country’s (anti-competitive) regulatory burden and were developed to overcome problems of traditional indicators that capture the intensity of competition (e.g. measures of market power), mainly their endogeneity
2. However, the use of proxy indicators has also been subject to criticism. The main limitation is that the use of product market regulations indicators is often aggregated into a single summary measure. This can impose strong and possibly arbitrary considerations in the way individual regulations may affect economic performance (Griffith and Harrison, 2004). The use of several indicators that can capture different regulatory dimensions would possibly lead to more informative results.
The fist indicator characterising the stringency of the product market regulation that is considered in our analysis is the OECD Regulation Impact indicator (Conway et al 2006; Arnold et al, 2008). This is one of the first indicators available that measures regulatory conditions for the wide range of economic sectors.
The OECD Regulation Impact indicators measure the "knock-on" effects of anti-competitive regulation in key service input providing sectors in other sectors of the economy. The indicators are a reflection of two factors: a) the level of anti-competitive regulation in particular services sectors and b) the intensity of use of these sectors' service inputs by downstream industries (based on the input-output coefficients
3).
These indicators are available for more than 40 industries and 30 OECD countries for the period spanning from 1975 to 2007. See table A.1 in the Appendix for differences in RI across the economies of our sample.
In addition to using OECD Regulation Impact indicators we use in our regression analyses, alternative indicators of regulatory economic impact. These newly developed indicators (Paterson and Sellers, 2012) aim to capture two types of regulatory constraints imposed by forward and backward linkages across economic sectors (see section 3.1 for a more detailed account of construction of these indicators).
The source of our economic performance measures is the EUKLEMS database, which provides measures of output, inputs and productivity on an industry basis (see O’Mahony and Timmer, 2009). In our analysis output is real value added, labour input is total number of hours worked; capital input is capital services in real terms. Capital services are estimated in EUKLEMS using the Perpetual Inventory Method
4and applying user costs for individual assets classified in two broader groups: ICT assets (Computers, software and communications equipment) and non-ICT assets (structures, non-ICT equipment and transport equipment). In the estimation of production function we also use include a labour composition series which takes account of changes in the gender, age and skill composition of the workforce.
3.1 An alternative indicator of Regulation Impact: Backward linkages
3.1.1 Multi-sector Regulatory-Economic Impact Indicators
In this section we describe the methodology to derive new indicators of (potential) impact of sectoral regulation in some specific sectors on all other sectors of the economy. Our approach builds on and extends the ideas put forward in Conway and Nicoletti (2006). Conway and Nicoletti construct measures of regulatory impact for each sector of the economy, based on the effects of regulation in non-
2
The main argument given in the literature when proposing the use of this type of indicator is that they minimise endogeneity problems that may arise in the econometric estimation of the effects of regulation on productivity. This issue concerns the impact that productivity performance can have on the level of regulation itself; while productivity certainly can influence regulation over time, this is not likely highly an instantaneous effect as regulation tend to. respond gradually to the changes in economic conditions.
3
The 2008 revision of the Regulation Impact indicators is based on an updated set of input-output coefficients for a broader set of countries than in previous versions of the dataset. The set of input-output coefficients are derived using the 2000 I/O as compared with previous versions that made use of the 1995 tables. However, the coefficients are held constant over time with the objective that the indicators reflect changes in policies over time rather than changes in the weights.
4
The expression for the Perpetual Inventory Method for calculating capital stocks is:
( )6 manufacturing sectors – as measured by regulation indices in sectors that provide intermediate inputs – mediated by a measure of (backward) linkage with other sectors of the economy.
Conway and Nicoletti (2006) formalise the regulatory impact (RI) knock-on effects as follows
5:
∑
(1)
with
being an indicator of anti-competitive regulation in non-manufacturing sector at time and the weight
being the total input requirement of sector for intermediate inputs from non-manufacturing sector (i.e. the corresponding element of the Leontief inverse coefficient matrix ). The extent of anti- competitive regulatory impact in a sector is thus dependent on:
the extent of anti-competitive regulation in all other sectors that the sector receives inputs from, and
the importance of these sectors as suppliers of intermediate inputs.
Therefore, the indicator captures upstream effects of regulation (forward linkages)
The resulting measure is thus a sumproduct of the regulatory indicators and a measure of sectoral interlinkage, usually ranging on a scale from 0 to 6. Thus the higher the measure the higher the regulatory burden of the sector.
Extensions to the Indicator Definitions
6Replacement of s with s
The first modification involves the measurement of interlinkage between sectors. The matrix of lambdas (
) (cf. Paterson and Sellner 2012) replaces the Leontief inverse coefficient matrix (
) We note that
(ibid, Corollary 3).
7Taking downstream effects into account
The second modification extends the regulatory-economic impacts to take downstream as well as upstream effects into account. The basic idea is that, in addition to regulatory effects being transmitted forward (“knocked-on) they may induce negative effects on production through backward linkages (cf.
Riordan (2005) in the context of vertical integration, where a downstream monopolist may also be a monopsonist on the input market).
Taking the relative size of sectors into account
The third modification introduces a new consideration: Use of either the matrix (Conway and Nicoletti 2006) or the matrix essentially employs the marginal contribution (i.e. per unit) – knocked-on or
5
We have amended the notation of Conway and Nicoletti (2006) so that refer to rows and columns, respectively, of the Leontief inverse coefficient matrix ( )
6
Wrt. the definition (1).
7
In Conway and Nicoletti (2006) it states that
, whereby non-diagonal elements ( ) are presumably referred to (since
) However it is possible, even although unlikely in large input-output tables, that
for some (cf. Paterson and Sellner 2012).
7 supplied – to each sector. It is clear that economically larger sectors induce potentially more significant effects than smaller sectors. We use the sector weight
∑8
Regulation in each sector itself is accounted for separate from derived effects
The knocked-on and supplier effects take into account the regulatory-economic effects induced by direct and indirect interlinkages between sectors. The combined effect of these is obtained by aggregation over sectors. However the primary effect of regulation is manifested in the sector itself, and this must be added to the foregoing sum.
The correlation between the OECD Regulation Impact indicator and our Upstream Regulation indicator is 0.7376. The correlation between the OECD Regulation Impact indicator and the Upstream- Downstream regulation indicator is 0.7494. And the correlation with the Downstream regulation indicator is 0.7625.
4. The impact of service regulation on ICT investment: Distinguishing between upstream and downstream linkages
In this section we look at whether differences in the speed to which ICT capital accumulation was accumulated during the period 1995-2007 can be related to cross-country differences in prevailing regulatory conditions. We undertake this analysis at industry level, and therefore we are able to control for country, industry and time specific factors that are likely to have affected to a large extent the way ICT was incorporated to production processes.
Despite the overwhelming evidence showing that ICT capital played a pivotal role in explaining divergent productivity performance across countries from mid 90s, and furthermore, this could be traced to the performance of a few services industries, evidence on the factors explaining the patterns of accumulation of this key input isstill limited. Some recent studies provide evidence on factors affecting ICT diffusion at country-level (Cette and Lopez, 2012; Guerrieri et el, 2011). Existing industry-level studies focus on measures of ICT diffusion such as the ratio of ICT over output, and the share of total investment accounted by expenditure in ICT assets (Conway et al, 2006).
Here to assess the impact of regulation on the accumulation of ICT capital inputs we use an econometric model which is consistent with the neoclassical theory of optimal capital accumulation and accounts for changes in prices of ICT capital over time. Alesina et al (2005) have recently looked at the effect of regulation on investment for a group of heavily-regulated services industries within electricity, transport and communications, drawing on a model of imperfect competition in the output market. Our aim is to contribute to explaining differences in ICT capital accumulation that apply to broader range of economic activities.
In Table A.2 we provide an account of the substantial differences in annual investment rates for ICT assets (measured as gross fixed capital formation in t scaled by the real capital stock in t-1
9) across countries in selected services industries for the period 1995-2007.
The annual average ICT investment rate across all services across all countries was approximately 31%
during the period 1975-2007. Those countries with the highest ICT investment rates on average are the US, and within Europe, Denmark, the UK, and Finland. Amongst the countries with lowest annual rates
8
This use of does not correspond to its use in Conway and Nicoletti (2006), which in turn corresponds here to
9
Capital stock in period refers to the capital stock at the end of period .
8 are Spain, Italy and also the Netherlands. The industry with a higher annual investment rate are financial intermediation and renting of machinery and equipment and other business activities (36% is the cross- country average in both industries), followed by wholesale and retail (33%). The service industry with the lowest annual ICT investment rate is post and telecommunications (22%).
4.1.1 Modelling ICT investment
Jorgenson (1963, 1967) argue that it is possible to derive a demand function for investment assets relying purely on neoclassical considerations, such as profit maximisation, where demand for investment can be taken to depend on the cost of capital. The firm supplies capital services to itself through the acquisition of investment goods, and the rate of change in the flow of capital services is proportional to the rate of acquisition of investment goods less the rate of replacement of previously acquired investment goods.
The maximisation of profits leads to the following optimal equation for the desired capital stock in time ):
( )
( )
In an absence of substantial adjustment costs equation (2) can be written as a log-linear function of output and the cost of capital (Bond et al, 2003) where is a constant:
(1)
And taking first differences of equation (1) we have:
(
) (2)
Considering the expression for the Perpetual Inventory Method
10,
( ), we can write the flow of capital services as a proportion of the stock of capital goods, obtained by the summing of the stream of past investments
11:
(3)
10
Under the assumption that capital goods depreciate at a constant rate .
11
Jorgenson (1967) argues that the concept of capital services is not essential to the neoclassical theory, as a production
function that relates output at each point in time to labour and capital services inputs can be substituted by a production
function that relates output at every point in time to inputs of investment goods at every point in time. We thus consider here
a production technology that meets these conditions.
9 Applying the approximation
to equation (4) we obtain the following expression to estimate the determinants of investment in a particular asset (or group of assets) denoted by (again lower cases denote the logarithms of the variables):
( )
(4)
4.1.2 Estimating the effect of regulation on ICT investment:
Equation (4) represents an investment equation that is fully consistent with neoclassical assumptions; in this framework the role of anti-competitive regulation can be interpreted as a factor that might hamper the adjustment to the investment to its long-run equilibrium value. In a competitive environment the cost of adjusting capital stocks and reorganising production processes will be lower and the downward pressure on the cost of ICT will promote its diffusion (Conway et al 2006). According to these considerations we augment equation (4) with an indicator of Regulation Impact and present it in a dynamic form. An AR(1) model for the ICT investment rate
12is thus given by equation below:
( )
(5)
where
represents the gross fixed capital formation for ICT assets;
represents the stock of ICT assets in real terms; is an indicator of Regulation Impact; the term denotes year-specific effects, denotes country-industry specific effects and is the standard error term; refers to country, refers to industry, refers to year, where . The country-industry specific fixed effects control for factors that vary by industry and country and that do not vary over time
13.
The time-specific effects control for the business cycle. The introduction of a lag in the dependent variable accounts for the dynamics of the investment process, that is, the slow adjustment to desired levels of capital. The remaining set of explanatory variables in equation (5) include: a) the price of ICT good in real terms (calculated by dividing the investment deflator of ICT assets by the value added deflator
14) denoted by the term ( ) in logs; b) the growth in real value added ( ); c) a vector of country/sector/time specific variables with a potential influence on the investment rate, for example, profits. Our proxy measure for profitability is calculated as the industry capital compensation
15over the stock of ICT assets (see Bond et al, 2003); the inclusion of this variable as a control in the capital investment equation does not relate directly to the neoclassical theory, however it accounts for the event that information on profits may help forecast output and desired levels of capital, and in a simple model like the one outlined here, also investment spending. The existence of substantial adjustment costs in the short-run and the presence of financial constrains leads us to include of the profit measure as a determinant of investment. All variables in the regressions (with the exception of the Regulation Impact indicators) are drawn from the EUKLEMS database.
12
The ICT investment rate is calculated as the ratio of the gross fixed capital formation over one year relative to the stock of capital at the start of the same year.
13
Depreciation rates are omitted from equation (5) as they only show variation by industry. Depreciation rates based on calculations by the BEA (Bureau of Economic Analysis) for the US are assumed for all countries.
14
The investment and value added deflators in the EUKLEMS database are available for each country on a sectoral and annual basis.
15
The capital compensation indicators available in the EUKLEMS database have been calculated by subtracting labour
compensation from value added (both values in current terms). The main limitation we encounter when using this variable
as a measure of profitability relies on the fact that it includes remuneration of self-employment and that it is not possible to
disentangle gross operating surplus from tax payments.
10 We undertake the estimation of equation (5) with ordinary least squares (OLS). OLS technique assumes stationarity of all the variables and homogeneity of the coefficients; however, we estimate the coefficients of our regressions by groups of industries, thus recognising the heterogeneous impact that regulation can have on economic performance across industries. In addition, we account for heterocestasticity-robust standard errors.
Table 1 presents the results of estimating parameters in equation (5) for our baseline specification. From column (1) it can be seen that the impact of the OECD Regulation Impact indicator on the investment rate is negative, but not statistically significant. In columns (2) to (4) we show the results when we introduce our alternative indicators developed by Paterson and Sellers (2012). In column (2) we report the results for the indicator of Upstream regulation only, column (3) considers the indicator that encompasses both upstream and downstream regulation and column (4) considers downstream regulation alone. The coefficient of the Upstream regulatory impact is negative and significant (-0.236) as also the one on upstream and downstream regulation, although smaller (-0.168). Both are statistically significant at standard levels of confidence. The coefficient on the Downstream regulation is negative too but not significantly different from zero.
The coefficients on the remaining variables of equation (5) appear in line with predictions. As we would expect, the influence of the price of the ICT assets in relation to output prices (measured as the ratio of the corresponding deflators) is negative and significant in all specifications (around -0.4). The coefficient on the price of Non-ICT assets is positive and significant. It can be that value added growth has a positive influence on the ICT investment rate across all four specifications. The coefficient on the profitability measure is positive and statistically significant, although fairly small in magnitude (having a larger influence in other services). Other estimated coefficients also emphasize the importance of accounting for dynamics in the analysis of investment; the estimated coefficient on the lagged dependent variable is generally positive and significant and ranges between 0 and 1 as expected.
The coefficient is estimated to be -0.236 (column 2). The magnitude of the long-run effect of regulation on ICT investment is calculated as
and this is estimated to be -0.34. This figure suggests that a decrease in 1% in the Regulation Impact indicator will lead to an increase in the investment rate in 0.034 percentage points.
In summary, once we control for a number of observed and unobserved factors that may determine ICT capital accumulation, we do not find evidence that differences in the OECD Regulation Impact indicator significantly explains differences in ICT capital growth. This is in contrast to results in Conway et al (2006) who find that regulation has detrimental consequences for ICT investment, using the same indicators. However, the two sets of results are not directly comparable as Conway et al's sectoral results focus in five countries only; in addition, they use the share of ICT investment in total investment as an indicator of ICT diffusion, and existing levels of capital stock and prices are not accounted for in their framework.
However when we include separate indicators of Upstream and Downstream regulation, we can obtain
different results. We find that Upstream regulation harms investment in other industries to a larger extent
than downstream regulation. Next, we present the results when splitting our sample of industries into
manufacturing and industries. Table 2 presents the results for manufacturing industries and table 3 for
services. The tables show that these results hold for services while not for manufacturing.
11 Table 1. Regulation impact and ICT investment, period 1995-2007, All industries.
(1) (2) (3) (4)
Dep variable:
I
ICTt/K
tOECD Reg Impact
Upstream Reg Impact
Upstream- Downstream
Reg Impact
Downstream Reg Impact
Lagged 0.319*** 0.318*** 0.319*** 0.320***
Dep variable (0.0589) (0.0590) (0.0588) (0.0589)
Price ICT assets -0.385*** -0.385*** -0.386*** -0.385***
(0.0609) (0.0609) (0.0610) (0.0610)
Price Non-ICT assets 0.102* 0.103* 0.103* 0.102*
(0.0584) (0.0583) (0.0583) (0.0583)
Output growth 0.212*** 0.211*** 0.211*** 0.213***
(0.0630) (0.0629) (0.0628) (0.0630)
Profitability 0.226*** 0.226*** 0.226*** 0.227***
(0.0603) (0.0600) (0.0603) (0.0605)
OECD Regulation -0.0996
Impact (0.0761)
Upstream Regulatory -0.236**
Impact (0.102)
Upstream-Downstream -0.168*
Regulatory Impact (0.0946)
Downstream -0.0810
Regulatory Impact (0.0936)
Constant 0.215*** 0.217*** 0.214*** 0.203***
(0.0496) (0.0484) (0.0481) (0.0468)
Country*industry FE Yes Yes Yes Yes
Year FE Yes Yes Yes Yes
Observations 3,241 3,241 3,241 3,241
R-squared 0.562 0.563 0.563 0.562
Robust standard errors in parentheses
*** p<0.01, ** p<0.05, * p<0.1
12 Table 2. Regulatory economic impact and ICT investment, period 1995-2005, Manufacturing.
(1) (2) (3) (4)
Dep variable:
I
ICTt/K
tOECD Regulatory
Impact
Upstream Regulatory
Impact
Upstream- Downstream
Reg Impact
Downstream Regulatory
Impact
Lagged 0.133* 0.132* 0.133* 0.131*
Dep variable (0.0721) (0.0723) (0.0722) (0.0723)
Price ICT assets -0.367*** -0.366*** -0.365*** -0.362***
(0.0791) (0.0786) (0.0785) (0.0781)
Price Non-ICT assets 0.286*** 0.284*** 0.283*** 0.280***
(0.0870) (0.0871) (0.0869) (0.0868)
Output growth 0.0912 0.0927 0.0939 0.102
(0.0716) (0.0713) (0.0713) (0.0708)
Profitability 0.224** 0.218** 0.224** 0.237**
(0.0916) (0.0926) (0.0939) (0.0940)
OECD Regulation -0.453
Impact (0.456)
Upstream Regulatory -0.867
Impact (0.851)
Upstream-Downstream 0.0136
Regulatory Impact (0.798)
Downstream 3.620
Regulatory Impact (2.751)
Constant 0.349*** 0.346*** 0.304*** 0.280***
(0.0571) (0.0597) (0.0584) (0.0379)
Country*code FE Yes Yes Yes Yes
Year FE Yes Yes Yes Yes
Observations 1,692 1,692 1,692 1,692
R-squared 0.437 0.437 0.437 0.437
Robust standard errors in parentheses
*** p<0.01, ** p<0.05, * p<0.1
13 Table 3. Regulatory economic impact and ICT investment, period 1995-2005, Services.
(1) (2) (3) (4)
Dep variable:
I
ICTt/K
tOECD Regulatory
Impact
Upstream Regulatory
Impact
Upstream- Downstream
Reg Impact
Downstream Regulatory
Impact
Lagged 0.273*** 0.271*** 0.273*** 0.273***
Dep variable (0.0685) (0.0679) (0.0672) (0.0681)
Price ICT assets -0.400*** -0.400*** -0.401*** -0.400***
(0.0779) (0.0780) (0.0783) (0.0780)
Price Non-ICT assets 0.0485 0.0507 0.0510 0.0499
(0.0663) (0.0662) (0.0663) (0.0663)
Output growth 0.414*** 0.412*** 0.413*** 0.415***
(0.0896) (0.0901) (0.0894) (0.0894)
Profitability -0.0992 -0.109 -0.105 -0.101
(0.150) (0.150) (0.149) (0.150)
OECD Regulation -0.108
Impact (0.0827)
Upstream Regulatory -0.238**
Impact (0.0994)
Upstream-Downstream -0.175*
Regulatory Impact (0.0977)
Downstream -0.158
Regulatory Impact (0.104)
Constant 0.311*** 0.310*** 0.307*** 0.291***
(0.0595) (0.0459) (0.0451) (0.0450)
Country*code FE Yes Yes Yes Yes
Year FE Yes Yes yes Yes
Observations 1,126 1,126 1,126 1,126
R-squared 0.678 0.679 0.679 0.678
Robust standard errors in parentheses
*** p<0.01, ** p<0.05, * p<0.1
14
5. Regulation, ICT and productivity: A production function approach
5.1 Estimation of a production function
Our model is based on a Cobb-Douglas production function where regulation has an impact on total factor productivity:
(
)
(6)
where denotes output, denotes labour input, denotes capital services
16, denotes a technology shift or TFP (which is influenced by the level of regulatory constrains); denotes country, industry and year. We assume that the production technology is characterised by constant returns to scale ( ) and that it takes place in perfectly competitive markets The parameter represents the elasticity of output with respect to labour and represents the elasticity with regards to capital.
In this section we set out the framework in which we investigate the impact of regulation on industry productivity growth. After taking logs and first differences of the variables in expression ( ) we obtain a linearised production function equation which is augmented by the introduction of the different indicators regulation impact. Our dependent variables is real value added and we have measures of labour and capital inputs as explanatory variables; we allow for the total capital to be divided into two types of capital (ICT and non-ICT capital).
The baseline estimating production function equation is given by expression below (lower case denote natural logarithms of all variables):
( )
where is output (value added); is labour input (hours worked); is capital services input; is an indicator of Regulation Impact, denotes a vector of control variables; refers to the sector-specific effects; refers to country-specific effects and is the error term; , , and denote country, industry and year respectively.
The signs on the coefficients and will quantify the parameters of the production function; the sign on the coefficient will provide an indication to the extent to which anti-regulation of upstream services has an effect on productivity. An advantage of such an econometric approach relative to a growth accounting method is its flexibility when consider additional influences on output beyond the use of inputs.
Next, we augment our specification set out in (7) with the inclusion of indicator terms between the regulation variables and ICT capital (tow-way interactions between two continuous variables). We aim to capture the differential impact that ICT has on output, depending on the value of a third variables, the regulation impact. We would expect that for high values of regulation, which hinders allocation of resources and lack of flexibility in re-organising production to adapt to a new technology, the productivity impact of ICT would be lower. This is what we aim to test empirically.
16
The flow of output is a function of flows of labour and capital services.
15
( )
( )
Table 4 reports the results of estimating the levels production function specified in ( ) using Ordinary Least Squares (OLS) and heterocedasticity-robust standard errors. The results show plausible coefficients for the factors of the production function (labour, ICT capital and non-ICT capital), although the coefficients of labour appears smaller than expected. This may be explained for the inclusion of country- industry fixed effects to control for those unobserved determinants of productivity that vary by country and industry. The coefficient on ICT capital ranges between 0.02 and 0.05 but is smaller than those reported by other industry level studies (O’Mahony and Vecchi, 2005; Venturini, 2009). This may be explained by the heterogeneous sample of countries.
In this setting, the coefficient of the regulation impact indicators on productivity is not significant in any of the specifications considered. The effects are negative but still not significant when using our alternative indicators.
In our interaction-augmented specification set out in equation (7’) the results appear somewhat different.
When we include an interaction term between the level of Regulation Impact and the ICT capital, the coefficient on ICT capital raises. This is the case in all specifications. Also, the coefficient of the Regulation variables becomes negative and significant also in all four models.
In this model, the impact of ICT is then calculated as: ̅ . For example, taking the estimated from column 1 we would obtain that the impact of ICT capital is 0.03. (evaluated on the average sample value of regulation impact). Similarly, the impact of regulation impact is calculated to be around -0.06.
These results show that regulation harm the potential role of ICT for boosting productivity growth. So,
those countries with a higher level of regulation are able to translate less effectively ICT capital stocks
into productivity gains.
16 Table 4. Production function estimation in levels, FE panel regressions baseline model, 1995- 2007.
(1) (2) (3) (4)
Dep. variable:
OECD
Reg Impact
Upstream Reg Impact
Upstream- Downstream
Reg Impact
Downstream Regulatory
Impact
ICT-capital 0.0291** 0.0495*** 0.0497*** 0.0502***
(0.0132) (0.0140) (0.0140) (0.0141)
Non-ICT capital 0.235*** 0.203*** 0.201*** 0.201***
(0.0274) (0.0315) (0.0312) (0.0310)
Hours 0.342*** 0.325*** 0.327*** 0.328***
(0.0353) (0.0394) (0.0392) (0.0392)
OECD Regulation 0.0325
Impact (0.0306)
Upstream Regulation -0.0214
Impact (0.0306)
Upstream-Downstream Regulation -0.0313
Impact (0.0360)
Downstream Regulation Impact -0.0313
(0.0320)
Constant 4.516*** 4.832*** 4.807*** 4.741***
(0.179) (0.232) (0.242) (0.286)
Observations 4,173 3,887 3,887 3,887
R-squared 0.996 0.996 0.996 0.996
Country*code FE Yes Yes Yes Yes
Year FE Yes Yes Yes Yes
17 Table 5. Production function estimation in levels, FE panel regressions Two-way interactions model, 1995-2007.
(1) (2) (3) (4)
Dep. variable :
OECD
Reg Impact
Upstream Reg Impact
Upstream- Downstream
Reg Impact
Downstream Regulatory
Impact
ICT-capital 0.0807*** 0.0674*** 0.0700*** 0.0912***
(0.0183) (0.0172) (0.0169) (0.0169)
Non-ICT capital 0.240*** 0.203*** 0.201*** 0.196***
(0.0272) (0.0315) (0.0311) (0.0307)
Hours 0.337*** 0.317*** 0.317*** 0.308***
(0.0354) (0.0409) (0.0408) (0.0400)
OECD Regulation -0.137**
Impact (0.0531)
Upstream Regulation -0.0837**
Impact (0.0413)
Upstream-Downstream Regulation -0.109**
Impact (0.0459)
Downstream Regulation Impact -0.152***
(0.0378)
ICT*OECD Regulation Impact 0.0259***
(0.00620)
ICT*Upstream Regulation Impact 0.00765*
(0.00421)
ICT*Upstream Downstream 0.0101**
Regulation Impact (0.00451)
ICT*Downstream Regulation 0.0138***
Impact (0.00293)
Constant 4.151*** 4.706*** 4.676*** 4.395***
(0.198) (0.221) (0.235) (0.280)
Observations 4,173 3,887 3,887 3,887
R-squared 0.996 0.996 0.996 0.996
Country*code FE Yes Yes Yes Yes
Year FE Yes Yes Yes Yes
18
6. Summary and conclusions
The importance of ICT capital for economic growth has been documented extensively in the literature.
The fact that the US experienced considerably higher labour productivity growth than Europe from mid 1990s onwards has been widely attributed to a highest ability to invest in ICT technologies. Empirical evidence studying the determinants of ICT capital accumulation, however, is not very abundant.
This paper systematically explores the impact of regulation in key industries has on key performance indicators across a range of industries in EU countries and the US during the period 1995-2007. In particular, we look at the implications that anti-competitive regulatory restrictions in service-providing industries -utilities, transport and communications, and retail and professional services-, have for ICT investment and productivity of ICT assets across a wide range of economic sectors. We use OECD Regulation Indicators database and match it to the EUKLEMS database for the period 1995-2007. The Regulation Impact indicators quantify the so-called "knock-on" effects of regulation, by taking into account, not only the tightness of regulation of upstream sectors, but also the intensity of the links with downstream sectors. In addition we use an alternative set of newly-developed regulation impact indicators, recognising that anti-competitive regulation can spread throughout the economy through forward and backward linkages.
While existing empirical studies concentrate on forward linkages given the importance of key services sectors as input suppliers, here we argue that the role of backward linkages need to be considered. In fact we find that the effects of anti-competitive regulation on ICT capital accumulation is more evident when considering the impact that anti-competitive regulation has on those sectors from which purchases inputs (backwards linkages). Firms in these sectors have lower incentives to invest in leading technologies as firms in heavily-regulated sectors exert monopsony power and are likely to capture to majority of rents.
Our results stress the importance of a continued commitment to de-regulation in heavily-regulated sectors but suggest that attention has to be paid to indirect effects elsewhere, where constrains to effective ICT diffusion may be more binding. Our results suggest that that the EU should benefit from more flexible product markets as these deter ICT investment and also the contribution to ICT to growth.
Our results show thatt EU countries that have been characterised by lower ICT investment and regulation has prevented re-organisation of production and incorporation of skills necessary for an effective implementation of ICT technologies.
19
Appendix A-Descriptive figures and tables
Calculation of Regulatory-Economic Impact Indicators
UPSTREAM: The upstream regulatory-economic impacts of intermediate (direct and indirect) inputs into a sector are given by
∑
, where
∑
(2)
DOWNSTREAM: The downstream regulatory-economic impacts of intermediate (direct and indirect) outputs into a sector are given by
∑
, where
∑(3)
(Note: The weight in the second term is always with respect to column since
represents the direct and indirect effects per unit value of sector )
UPSTREAM and DOWNSTREAM: The combined upstream and downstream regulatory-economic impacts of intermediate (direct and indirect) inputs and outputs of sector are given by
(4)
(Note: Since the regulatory-economic impact in its own sector
is added to each of and it must be subtracted from their sum in order to avoid double-counting.)
Since it is not a priori certain that downstream and upstream regulatory-impact effects will be actually be of equal importance, each of these three indicators may be used as alternatives in empirical investigations.
The new indicator that is likely to be closest to that used in Conway and Nicoletti (2006) is UREI, as only upstream effects are considered.
In the above definitions country and time indices have been left out to simplify reading: in fact each indicator is calculated for each EU Member State and annually over a period exceeding twenty years, in the data for UREIs, DREIs and UDREIs provided.
We note finally that the indicators presented here differ from the “Regulatory-Economic Knock-on
Measures” in Paterson and Sellner (2012). The latter refer to the sum of all forward (knocked-on)
regulatory-economic effects (FREI) on all other sectors, stemming from one particular sector, in that case
Business Services, or induced by backward linkage from this sector (BREI), and their total effects
associated with this one particular sector (TREI). In the current usage, in contrast, upstream
(downstream) regulatory-economic effects in each sector are the aggregation of forward (backward)
linkages from multiple regulated sectors that impact on the particular sector of interest. Likewise applies to
the definitions of or downstream impacts, and the combined upstream and downstream regulatory-
economic impacts.
20 Table A.1. OECD Regulation Impact in Services industries by country, average 1975-2007.
ISIC Rev.1 Description AT CZ DE DK ES FI FR HU IE IT NL SE SK UK US Total
E Electricity, gas and water 0.528 0.644 0.322 0.370 0.390 0.387 0.497 0.474 0.515 0.491 0.497 0.347 0.883 0.403 0.207 0.464
G Wholesale and retail 0.407 0.175 0.270 0.283 0.366 0.346 0.430 0.197 0.172 0.362 0.206 0.144 0.296 0.344 0.228 0.282
H Hotels and restaurants 0.085 0.111 0.083 0.059 0.067 0.099 0.069 0.098 0.074 0.106 0.067 0.053 0.245 0.085 0.047 0.090
J Financial intermediation 0.275 0.405 0.300 0.216 0.206 0.208 0.204 0.315 0.120 0.311 0.193 0.218 0.495 0.225 0.256 0.263
60t63 Transport and storage 0.417 0.574 0.504 0.329 0.544 0.378 0.516 0.484 0.512 0.560 0.400 0.351 0.570 0.274 0.252 0.444
64 Post and telecommunications 0.497 0.536 0.475 0.393 0.362 0.378 0.470 0.439 0.485 0.461 0.376 0.360 0.540 0.338 0.254 0.424 71t74 Renting of machinery and equipment
and other business activities 0.432 0.351 0.401 0.148 0.346 0.147 0.224 0.284 0.187 0.375 0.170 0.125 0.387 0.182 0.174 0.262 O Other community, social and
personal services 0.093 0.144 0.056 0.047 0.080 0.077 0.078 0.111 0.056 0.102 0.068 0.054 0.164 0.065 0.040 0.082
Total 0.342 0.368 0.301 0.231 0.295 0.253 0.311 0.300 0.265 0.346 0.247 0.206 0.447 0.240 0.182 0.289
Source: OECD
21 Table A.2. Annual investment rates in services industries by country, average 1975-2007.
ISIC Rev.1 Description AT CZ DE DK ES FI IT NL SE UK US Tot
E Electricity, gas and water 5.90% 6.97% 6.91% 6.89% 8.79% 7.17% 8.06% 4.78% 4.69% 7.73% 6.46% 6.76%
G Wholesale and retail 9.59% 15.77% 13.19% 11.55% 9.77% 10.66% 11.91% 11.28% 16.02% 14.33% 11.48% 12.32%
H Hotels and restaurants 7.68% 7.12% 8.23% 10.08% 10.37% 9.96% 9.68% 8.29% 11.05% 8.82% 8.68% 9.09%
J Financial intermediation 12.23% 17.58% 9.73% 10.82% 15.46% 16.41% 10.14% 9.59% 18.25% 15.48% 18.62% 14.03%
60t63 Transport and storage 8.01% 6.89% 8.37% 11.60% 10.36% 7.26% 11.27% 8.18% 9.07% 9.88% 8.39% 9.02%
64 Post and telecommunications 12.94% 17.30% 8.72% 9.19% 15.39% 10.04% 12.96% 10.68% 11.28% 15.73% 11.78% 12.36%
71t74 Renting of machinery and equipment
and other business activities 17.53% 16.76% 22.56% 18.21% 26.39% 16.18% 4.04% 17.25% 25.80% 21.62% 21.26% 18.87%
O Other community, social and
personal services 7.93% 10.74% 7.67% 10.81% 20.87% 11.16% 11.77% 11.73% 14.47% 13.08% 10.82% 11.92%
Total 10.23% 12.39% 10.67% 11.14% 14.68% 11.10% 9.98% 10.22% 13.83% 13.33% 12.19% 11.80%
(NOTE: Investment rate is defined as Gross fixed capital formation divided by capital stocks in real terms). SOURCE: Euklems database
22
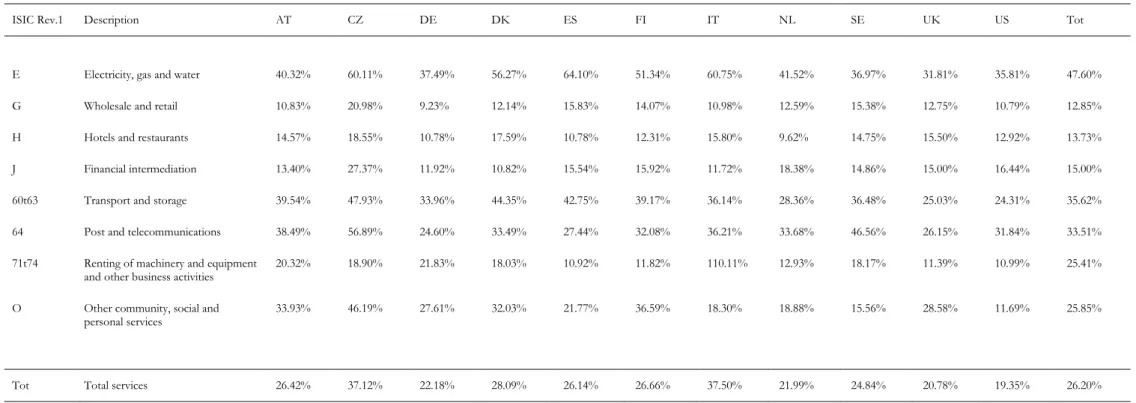
Table A.5. Share of investment over value added in services industries by country, average 1975-2007.
ISIC Rev.1 Description AT CZ DE DK ES FI IT NL SE UK US Tot
E Electricity, gas and water 40.32% 60.11% 37.49% 56.27% 64.10% 51.34% 60.75% 41.52% 36.97% 31.81% 35.81% 47.60%
G Wholesale and retail 10.83% 20.98% 9.23% 12.14% 15.83% 14.07% 10.98% 12.59% 15.38% 12.75% 10.79% 12.85%
H Hotels and restaurants 14.57% 18.55% 10.78% 17.59% 10.78% 12.31% 15.80% 9.62% 14.75% 15.50% 12.92% 13.73%
J Financial intermediation 13.40% 27.37% 11.92% 10.82% 15.54% 15.92% 11.72% 18.38% 14.86% 15.00% 16.44% 15.00%
60t63 Transport and storage 39.54% 47.93% 33.96% 44.35% 42.75% 39.17% 36.14% 28.36% 36.48% 25.03% 24.31% 35.62%
64 Post and telecommunications 38.49% 56.89% 24.60% 33.49% 27.44% 32.08% 36.21% 33.68% 46.56% 26.15% 31.84% 33.51%
71t74 Renting of machinery and equipment
and other business activities 20.32% 18.90% 21.83% 18.03% 10.92% 11.82% 110.11% 12.93% 18.17% 11.39% 10.99% 25.41%
O Other community, social and
personal services 33.93% 46.19% 27.61% 32.03% 21.77% 36.59% 18.30% 18.88% 15.56% 28.58% 11.69% 25.85%
Tot Total services 26.42% 37.12% 22.18% 28.09% 26.14% 26.66% 37.50% 21.99% 24.84% 20.78% 19.35% 26.20%
Value added and investment, both in nominal terms.
SOURCE: Euklems database
23 Figure 1. ICT investment rate, cross country-average 1970-2007.
0 0.1 0.2 0.3 0.4 0.5 0.6
ICT investment rate Non-ICT investment rate
24 Figure 2. ICT investment rate by country, average
0 0.1 0.2 0.3 0.4 0.5 0.6
AT
CZ
DE
DK
ES
FI
IT
NL
SE
UK
US
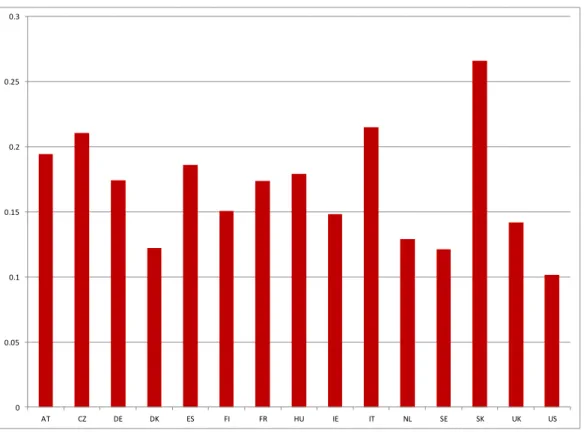
25 Figure 3. OECD Regulation Impact, average across industries.
Figure 4. Average OECD Regulation Impact across industries.
0 0.05 0.1 0.15 0.2 0.25 0.3
AT CZ DE DK ES FI FR HU IE IT NL SE SK UK US
0 0.05 0.1 0.15 0.2 0.25 0.3 0.35 0.4 0.45 0.5
AtB C 15t16 17t19 20 21t22 23 24 25 26 29 30t33 34t35 36t37 60t63 64 71t74 E F G H J O Industry RI Average RI
26 Figure 5. Different indicators of regulatory-economic impact.
0 0.1 0.2 0.3 0.4 0.5 0.6
AtB C 15t16 17t19 20 21t22 23 24 25 26 29 30t33 34t35 36t37 60t63 64 71t74 E F G H J O
Upstream regulatory-economic impact OECD Regulation Impact
Downstream regulatory-economic impact Upstream-Downstream regulatory-economic impact