Anlagen
Destruction of the Flame Retardant HBCD in a Full-Scale Municipal Solid Waste Incinerator
Frank E. Mark, Jürgen Vehlow, Hans Dresch, Bogdan Dima, Werner Grüttner und Joachim Horn
1. Introduction and objectives of the trials ...121
2. Test materials ...122
2.1. PSF insulation foams ...122
2.2. HBCD in PSF and MSW ...123
2.3. MSWI plant ...124
2.4. Test execution ...125
2.5. Sampling strategy ...125
3. Test results ...126
3.1. Operational performance ...126
3.2. Raw and clean gas composition ...126
3.3. Dioxins ...127
4. HBCD destruction ...129
5. Conclusions and recommendations ...131
6. References ...131
1. Introduction and objectives of the trials
Polystyrene foams (PSF) are widely used for heat insulation purposes in buildings.
According to information provided by the two organisations CEFIC , The European Chemical Industry Council and EXIBA, the European Extruded Polystyrene Insulation Board Association, the PSF types EPS (expanded polystyrene foam) and XPS (extruded polystyrene foam) represent 37 percent of the insulation market in Germany; the annual production in Germany of both types of foams was in the order of 12 Million m3 in 2008.
Because of legislative demands organic heat insulation foams are to a great extent flame retarded. The two industry organisations estimate that this is the case for approximately 77 percent of the EPS and 94 percent of the XPS consumption. The chemical compound
Anlagen used since decades by most foam suppliers is hexabromocyclododecane (HBCD).
However, from the actual discussion of its toxicity it can be expected that in the coming years its use as a flame retardant will be globally terminated by 26.11.2014. But even it its use is prohibited there are huge amount of HBCD containing foams which will create a disposal problem at the end of its useful life. Many countries have meanwhile a landfill ban for organic matter and recycling of POP containing waste is prohibited because of its hazardousness [28], which leaves thermal treatment as preferred disposal option.
HBCD has no high thermal stability and starts to disintegrate at 180 °C till 240.°C It releases Br radicals [2] which will form HBr. Specific organic destruction products have not been identified; but traces of brominated aliphatic compounds may be formed at higher temperatures [1].
There is little information available about the fate of HBCD in waste incineration. Small scale experiments indicated a virtually total decomposition at moderate temperature already with the detection of traces of brominated dioxins and no chlorinated ones [25].
To get more detailed knowledge of the fate of HBCD containing EPS and XPS foams in a state-of-the-art MSWI, a consortium started extended tests at the Würzburg inci- nerator in 2013. The design objectives of these trials were
• To investigate the influence of PSF on the operation of the plant,
• To obtain reliable information about the destruction efficiency of HBCD and
• To study the potential formation of chlorinated, brominated, and mixed halogena- ted dibenzo-p-dioxins and dibenzofurans .
Results of the test trials have recently been published [17].
2. Test materials
2.1. PSF insulation foams
The waste burnt during the test trials was MSW collected in the Würzburg region which is served by the incineration plant. Neither commercial and industrial waste nor sewage sludge were included. The average lower heating value of such MSW is 10.4 MJ kg-1 with short-term variations of ± 5 percent. The lower heating values of the two types of PS foams were 38 MJ kg-1 (EPS) and 39 MJ kg-1 (XPS). The highest ad- dition of PSF was 2 weight-%, which increased the fuel heating value by 0.78 MJ kg-1 . This increase does not exceed the set value of the heat load of the furnace and in fact no notable changes in the operation parameters occurred during the co-incineration tests.
The PSF supplied by the manufacturers had typical market quality and was delivered as complete boards with dimensions typical for material coming back from demolition sites. Real End of Life Foam will be together with small or medium size inert residues and has also smaller dimensions The XPS foams were blown with CO2, the EPS ones with pentane, which has already been completely released during the manufacturing and storage stages.
Anlagen
Since the PSF materials were not made up with any construction and demolition waste, their content of heavy metals was very low and will not be referred to in this paper.
However, the content of chlorine, bromine, fluorine and sulphur was analysed, the respective data are referenced in Table 1. For all analysed concentrations the standard deviation was ten percent, and the LOQ was 50 mg kg-1. The Table also contains con- centration ranges of the same elements in MSW, taken from literature [3, 4].
Br* Cl F S
mg kg-1
EPS 4,100 460 < 50 50
XPS1 7,400 250 < 50 < 50
XPS2 15,300 < 50 < 50 320
MSW 20 bis 150 5,000 bis 8,000 100 bis 150 1,000 bis 3,000
Table 1:
Halogens and sulphur concen- tration in the PS foams and in MSW
* Br concentration of PSF is an average value and has been measured by several laboratories
The highest additional element input is expected for Br, of which the typical concentra- tion in MSW is in the order of 100 mg kg-1 [31]. Even with a PSF addition of 2 weight-%
the Br content only gets approx. doubled, which should not have any significant effects neither on the raw gas quality nor on the emissions.
2.2. HBCD in PSF and MSW
The analysis of HBCD in polymers is complicated since, although HBCD is not che- mically bound to the polymer matrix, its total separation without any impact on the molecule can be problematic. The results obtained from three independent laboratories are compiled in Table 2. The Table contains also the concentrations communicated by the manufacturers as well as the Figures calculated from the Br analysis.
Laboratory 1* Laboratory 2 Laboratory 3 Calculated Manufacturer’s Mean value from Br data
g kg-1
EPS 3.4 5.7 6.0 5.5 7.0 6.1 ± 0.7
XPS1 6.7 11.6 10.0 9.9 13 11.1 ± 1.5
XPS2 13.5 20.0 22.0 20.5 24 21.6 ± 1.8
Table 2: HBCD concentrations in PSF (comparison of calculated and analysed data with those provided by the manufacturer)
* not included in mean value calculation
The results showed very high variations and especially the data sent in by laboratory 1 can be seen as outliers and were not included in the mean values used for the calculation of the HBCD destruction. These mean values and the respective standard deviations are included in the last column of Table 2.
The sampling and analysis of MSW is extremely laborious and complex and published data on HBCD concentrations in MSW are not available. The option selected was to identify waste fractions which are known to contain HBCD. These are mainly industry textiles and small electrical and electronic waste equipment. A number of recently
Anlagen published papers on MSW composition in Germany [7, 12, 22, 23, 24] indicate an average share of textiles of (3.5 ± 0.5) weight-% and of electrical and electronic waste of (0.66 ± 0.11) weight-%.
A Japanese publication reported HBCD concentrations in waste industry textiles of (33 ± 8) g kg-1 [11], however, this type of textiles does only contribute very small amounts to the textiles ending up in MSW, whereas clothing, the main fraction, is not flame retarded [27]. Estimating a maximum share of five percent of HBCD containing materials in the textiles fraction, the concentration of HBCD in MSW would arise to approximately 50 mg Mg-1.
According to a Swiss publication the HBCD concentration in electrical and elec- tronic waste is 17 mg kg-1 [18]. This Figure accounts for another approximately 100 mg of HBCD added per 1 Mg of MSW by this waste fraction.
The combustion air can be another potential HBCD input into the incinerator. Swedish air samples taken in urban areas ranged from 76 to 610 pg m-3 whereas in remote areas only <1 to 25 pg m-3 were found [21]. A rough estimate indicated that the traces of HBCD fed into the waste incinerator could be neglected for the calculation of HBCD destruction.
2.3. MSWI plant
The waste incineration plant selected for the present tests, the MSWI Würzburg, Germany, has already been used for co-incineration tests with waste plastics from the packaging sector in 1993/94 [13], with ASR (Automotive Shredder Residues) in 1997 [14], and with WEEE (Waste from Electrical and Electronic Equipment) in 2005 [16].
The previous test results allow hence a comparison with the actual ones.
steam production
heat recovery furnace boiler
raw gas sampling
cyclone cooler
boiler/
cyclone ash grate
ash bunker and
crane loading MSW+
1-2 % PSF
Ca(OH)2 activated
carbon
fabric filter
residue recirculate
clean gas sampling APC residue SCR
NOx reduction
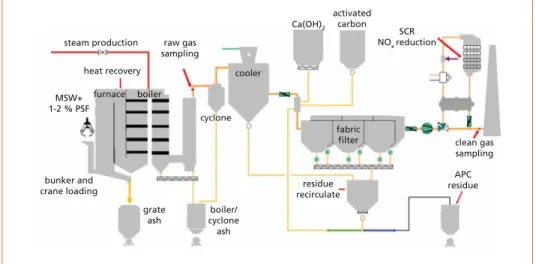
Figure 1: Schematic diagram of line 1 at the Würzburg MSWI
Anlagen
Line 1 of the plant, where the tests took place, is equipped with a grate system com- bining a water cooled reciprocating part and a reverse acting part at the backend. The throughput is 10 Mg h-1 and the residence time of the waste on the grate is approximately 2 hours. The line has a cyclone downstream of the boiler for separation of coarse fly ash followed by a Ca based dry scrubbing system and a back-end SCR (Selective Catalytic Reduction) for NOx abatement. A scheme of line 1 is shown in Figure 1.
2.4. Test execution
The programme consisted of a one week testing period directly after the regular main- tenance shutdown of the line. Each testing condition lasted for 24 h, starting the first day with a base test (condition A) where only MSW was burnt, followed by the co- incineration tests (condition B and C) and ending with another base test (condition A).
For all co-incineration tests, sampling was performed several hours after the start of PSF feeding to establish stable combustion conditions in the furnace. Two sampling periods were executed per test condition and day, the first one lasting for 6 h (tests A1, B1, C1, and A3) followed by a second one for comparison and lasting for 4 h.
The operating conditions were coded as follows:
A base test A1, A2.
B medium level of 1 weight-% PSF addition B1, B2.
C higher level of 2 weight-% PSF addition C1, C2.
A base test A3, A4.
The mix of the three PSF types was in all co-incineration tests set to 50 percent of EPS and 25 percent of each XPS type.
During all test runs the plant was operated in its normal mode, the soot blowing of the boiler was performed outside of the sampling periods.
For the dosing of the PSF the weight of every crane grab was measured by a load cell and recorded by the crane operator. The manually to be loaded quantity of PSF was taken from a list with pre-calculated amounts of EPS, XPS1 and XPS2 boards corres- ponding to the actual waste input.
2.5. Sampling strategy
Raw and clean gas sampling was carried out by an external contractor. The sampling points indicated in Figure 1, were:
• For the raw gas at the end of the boiler.
• For the clean gas in front of the stack.
• For dioxins and for metals at the same level as those for the online sampling, but the probes were about 2 m away from each other.
Anlagen The sampling periods were from 08:00 to 14:00 and from 14:00 to 18:00 every day of the test runs.
Solid residue sampling was carried out on the following streams:
• Grate ash, taken from the ash discharging belt downstream of the grate ash water quench tank.
• Combined fly ashes (from the fourth flue gas section of the boiler and from the cooler) taken from a discharge silo.
• Fabric filter ash taken out of the ash conveyor.
The grate ash sampling followed the protocol recommended by the International Ash Working Group [4]. It was executed four times per hour during the gas sampling pe- riods. The grate ash discharge conveyor was stopped and samples of 20 kg each were taken from the entire cross section of the conveyor. The total amount of grate ash taken per day was in the order of 600 to 800 kg.
Unburnt matter, metals and bulky materials were manually separated and their weight was recorded. The grate ash was sent to a laboratory for analysis.
3. Test results
3.1. Operational performance
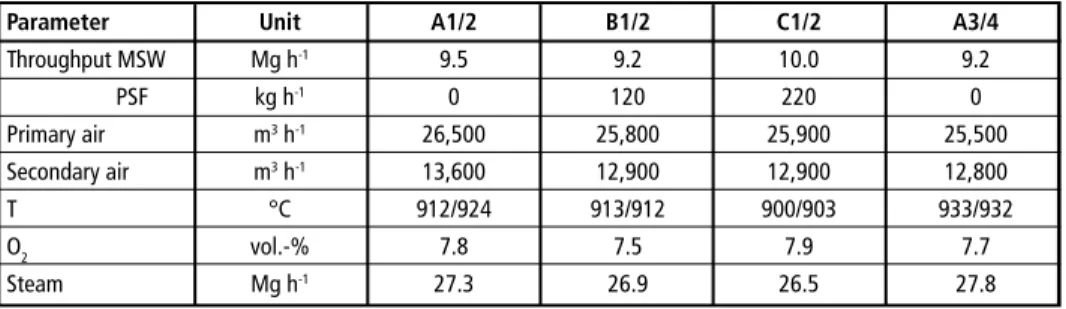
The plant operation data, averaged for each test condition, are listed in Table 3. These values were calculated starting one hour after the PSF feed had been introduced to the feeding hopper.
Parameter Unit A1/2 B1/2 C1/2 A3/4
Throughput MSW Mg h-1 9.5 9.2 10.0 9.2
PSF kg h-1 0 120 220 0
Primary air m3 h-1 26,500 25,800 25,900 25,500
Secondary air m3 h-1 13,600 12,900 12,900 12,800
T °C 912/924 913/912 900/903 933/932
O2 vol.-% 7.8 7.5 7.9 7.7
Steam Mg h-1 27.3 26.9 26.5 27.8
Table 3: MHKW operation parameters (averaged for each test condition)
3.2. Raw and clean gas composition
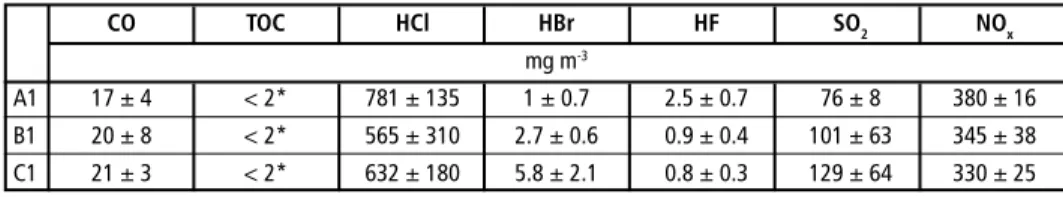
Raw gas and clean gas monitoring was carried out by an external contractor, too. The data for selected ingredients, averaged during the test period, are listed for the tests A1, B1, and C1 in Table 4. The data in this table as well as all following gas concentrations are standardised to 273.2 K, 101.3 kPa and 11 vol.-% O2.
Anlagen
The CO and TOC values indicate an excellent burnout, the only changes during the co-incineration tests are seen for HBr which was significantly increased. This increase had no influence on the lime consumption for acid gas neutralisation; the stoichiometric ratio varied around 1.3 to 1.4.
The clean gas concentrations of the regulated components were recorded by the plant’s online emission control system and have always been well below the air emission limits set for the plant which are those of the 17. BImSchV. These data were confirmed by the analysed gas samples which were taken during the tests A1, B1, and C1. The sampling time was always 30 min. These samples were also analysed for HF and, HBr. The results and the respective emission limits are shown in Table 5.
Table 4: Raw gas concentration of selected gases (averaged during the test period, HCl and HBr values are averages of 6 to 11 half hourly gas samplings)
CO TOC HCl HBr HF SO2 NOx
mg m-3
A1 17 ± 4 < 2* 781 ± 135 1 ± 0.7 2.5 ± 0.7 76 ± 8 380 ± 16 B1 20 ± 8 < 2* 565 ± 310 2.7 ± 0.6 0.9 ± 0.4 101 ± 63 345 ± 38 C1 21 ± 3 < 2* 632 ± 180 5.8 ± 2.1 0.8 ± 0.3 129 ± 64 330 ± 25
* below LOQ
Parameter Unit A1 B1 C1 Emission
limit
Dust mg m-3 < 0.3 0.45 < 0.3 10 HF mg m-3 0.42 0.37 < 0.25 1 HBr mg m-3 < 0.25 < 0.28 0.3 n.l.
Table 5:
Emission data analysed from gas samples (too small sample numbers for error calculation)
3.3. Dioxins
Today a state-of-the-art MSWI plant has a typical PCDD/F inventory in the raw gas downstream of the boiler of 1 to 5 ng m-3 in terms of international toxic equivalents (ITEQ). Raw gas sampling for dioxin analysis took place during the entire 6 h sampling period following the provisions as set forth by the EU Waste Incineration Directive.
Data are provided in Table 6 for the test runs A1, B1 and C1.
Parameter Unit A1 B1 C1
PCDD/F ng(I-TEQ) m-3 1.84 3.05 3.31 PBDD/F ng m-3 < 0.5* < 0.5* < 0.5*
PXDD/F ng m-3 11.6 59.4 110.8
Table 6:
Raw gas concentrations of PCDD/F, PBDD/F, and PXDD/F
* below LOQ
The measured PCDD/F concentrations were in the same order of magnitude as typically found in the Würzburg MSWI. They match previous raw gas PCDD/F concentrations of 2.75 to 4.58 ng(ITEQ) m-3 measured in 1993/4, when mixed plastic waste from the packaging sector was co-incinerated [13] and 1.8 to 6.7 ng(ITEQ) m-3 in the campaign
n.l.: not limited
Anlagen in 1997 when ASR were co-fed [14, 15]. In both test campaigns the addition of plastic waste did not change the PCDD/F raw gas level. The same conclusion can be drawn from the PSF results, since the slight increase in PCDD/F concentration between A1 and B1/C1 is well inside the typical concentration range found in the plant.
It is known that increased levels of Br in waste promote the formation of Br containing dioxins [6, 19]. Detailed investigations on WEEE co-incineration in the Karlsruhe TAMARA test facility for waste incineration revealed indeed an increase in mixed halogenated PXDD/F with increasing Br input which levelled off when a certain Br content was reached. The formation was limited by the availability of organic precursors rather than that of halogens [30].
The raw gas concentrations of Br containing dioxins are included in Table 6. PBDD/F were not detected. This finding is in line with the TAMARA results where only traces of such compounds were analysed at extremely high Br concentrations of up to 1,000 mg m-3 in the raw gas.
The total sum of PXDD/F increased from 11.6 ng m-3 in the base test to 110.8 ng m-3 with increasing PSF addition. The level of these congeners was by a factor of 5 higher than found in the WEEE co-incineration tests in 2004, although this time the Br inven- tory was by at least one order of magnitude lower [16]. The finding is at a first glance surprising since the PCDD/F concentrations were in the same order of magnitude in both tests. Furthermore, HBCD disintegrates in the hot zone of the combustor and its molecular structure shows no similarity to any dioxin precursor such as PCB or PBDE.
However, the concentrations resembled those found in the TAMARA tests on WEEE co-incineration and can thus be looked upon as not out of range, the more so since no influence on the emission could be detected.
In the Würzburg plant the Ca based dry scrubbing system uses activated charcoal for the abatement of semi-volatile micro-organic compounds. The emission concentrations of the halogenated dioxins are compiled in Table 7. During the tests A1 and C1 the sum of PCB has also been analysed. The concentration was below the LOQ during the two tests. For comparative reasons data obtained during the above cited co-incineration tests of ASR in 1997 and of WEEE in 2004 have also been listed.
The Table documents the excellent abatement efficiency of the MSWI’s gas cleaning sys- tem. All analysed emission concentrations are extremely low. PXDD/F concentrations
* below LOQ, n.a.: not available
Unit A1 B1 C1 ASR tests WEEE tests
PCDD/F ng(ITEQ) m-3 0.0021
±0.0009 0.0004* 0.0002* 0.002 – 0.005 0.002 – 0.013 PBDD/F ng m-3 < 0.5* < 0.5* < 0.5* n.a. n.a.
PXDD/F ng m-3 < 1.1* < 1.0* < 1.0* n.a. 0.55 PCB ng m-3 < 0.0002* n.a.. < 0.0002* n.a. 0.78 Table 7: Emission concentrations of PCDD/F, PBCD/F, PXDF, and PCB
Anlagen
were below the LOQ and the values of PCDD/F are much more than one order of ma- gnitude lower than the emission limit of 0.1 ng m-3. The air emission quality is more or less the same as during former tests executed in the plant.
4. HBCD destruction
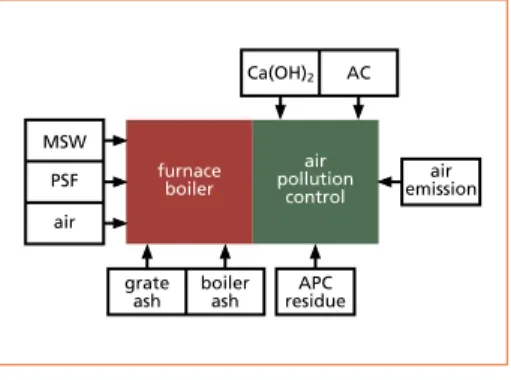
When calculating the destruction efficiency of HBCD all mass flows throughout the incineration plant and the HBCD concentrations in all of these streams have to be known as precisely as possible. The respective mass flows are depicted in Figure 2.
furnace boiler
pollutionair control
residueAPC
emissionair
boiler grate ash
ash air PSF MSW
Ca(OH)2 AC
The input streams are MSW, PSF and com- bustion air. The accuracy of the MSW feed as well as that of the PSF input is expected to be ± 5 percent. For the destruction calculation only the test runs A1, B1, and C1 have been used.
As mentioned above the amount of HBCD introduced by the 40,000 m3 h-1 of com- bustion air can be neglected.The same conclusion applies for the additives to the APC system, Ca(OH)2 and activated carbon, which did not contain any HBCD.
Figure 2: Scheme of mass flows in the waste incinerator (AC: activated carbon)
The mass flows of grate ash, boiler ash as well as APC residue are average values taken from the annual statistics of the plant in 2013. For these streams a standard deviation of ± 20 percent is estimated. In the 93/94 test runs the mass streams were measured during the 8 hour measuring period and showed a good approximation to these ave- rages. The mass flows used for the destruction calculations are compiled in Table 8.
Parameter Unit A1 B1 C1
MSW kg h-1 8,800 ± 440 9,100 ± 455 9,900 ± 495
EPS kg h-1 0 60 ± 3 110 ± 5.5
XPS1 kg h-1 0 30 ± 1.5 55 ± 2.8
XPS2 kg h-1 0 30 ± 1.5 55 ± 2.8
Grate ash kg h-1 2,200 ± 440 2,27580 ± 460 2,480 ± 500 Boiler + cooler ash kg h-1 315 ± 63 359 ± 72 390. ± 78
APC residue kg h-1 125 ± 25 129 ± 26 141 ± 28
Flue gas m3 h-1 62,400 ± 6,200 67,400 ± 6,700 63,50 ± 6,400 Table 8: Mass flows used for the HBCD destruction calculation
As outlined above, the HBCD concentrations in the input streams were averaged from four sources. For the analysis of the HBCD concentration in the residue streams extended investigations concerning the analytical LOQ in the various matrices were conducted.
Anlagen The respective Figures were 1 ng m-3 for the flue gas and 1.4 µg kg-1 for the solid re- sidues. The analytical error in these low concentration ranges has to be estimated to
± 10 percent.
Table 9 compiles the concentrations in all input and output streams. Given the tech- nical requirements in this report, no differentiation regarding separate HBCD isomer distributions in the PSF, in the residues as well as in the flue gas has been considered;
all HBCD concentrations are given as the sum of all isomers.
Table 9: HBCD concentrations in the input and output streams used for balance calculation Parameter Unit A1 B1 C1
EPS g kg-1 6.11 ± 0.7
XPS1 g kg-1 11.1 ± 1.5
XPS2 g kg-1 21.6 ± 1.8
Grate ash µg kg-1 1.40* ± 0.14 1.40* ± 0.14 2.40 ± 0.24 Boiler + cooler ash µg kg-1 1.40* ± 0.14 2.30 ± 0.23 1.40* ± 0.14 APC residue µg kg-1 1.40* ± 0.14 1.40* ± 0.14 1.40* ± 0.14
Flue gas ng m-3 0.50* ± 0.05 2.60 ± 0.26 5.60 ± 0.56
* measured concentrations below LOQ
The concentrations in all solid residues were almost the same and all close to the limit of quantification. A correlation with the HBCD input could be seen for the flue gas concentration, but also on a very low level. With these data the HBCD substance flows have been calculated. The results are compiled in Table 10. In case of findings below the LOQ the LOQ values have been used for the calculation.
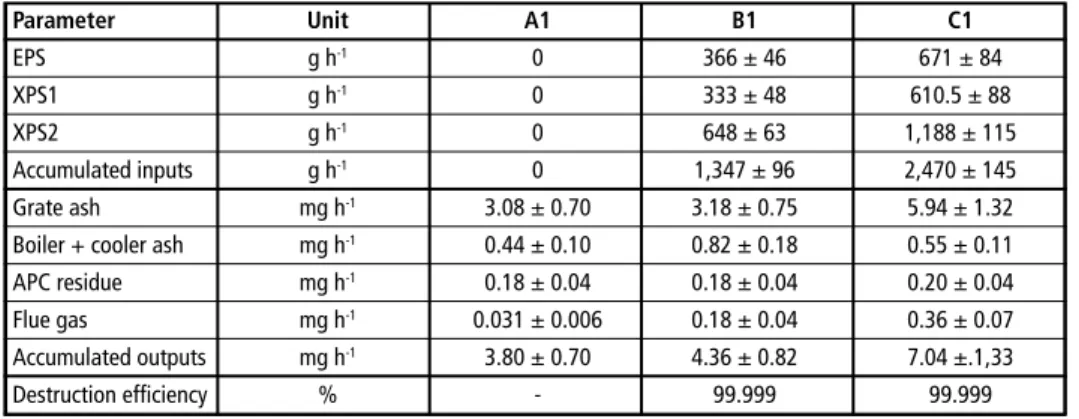
Table 10: Substance flows of HBCD and its destruction efficiency
Parameter Unit A1 B1 C1
EPS g h-1 0 366 ± 46 671 ± 84
XPS1 g h-1 0 333 ± 48 610.5 ± 88
XPS2 g h-1 0 648 ± 63 1,188 ± 115
Accumulated inputs g h-1 0 1,347 ± 96 2,470 ± 145
Grate ash mg h-1 3.08 ± 0.70 3.18 ± 0.75 5.94 ± 1.32
Boiler + cooler ash mg h-1 0.44 ± 0.10 0.82 ± 0.18 0.55 ± 0.11 APC residue mg h-1 0.18 ± 0.04 0.18 ± 0.04 0.20 ± 0.04
Flue gas mg h-1 0.031 ± 0.006 0.18 ± 0.04 0.36 ± 0.07
Accumulated outputs mg h-1 3.80 ± 0.70 4.36 ± 0.82 7.04 ±.1,33
Destruction efficiency % - 99.999 99.999
From the above data virtually identical destruction efficiencies (DE) of >99.999 percent for the B1 as well as for the C1 test have been calculated. The Table points out that not only the DE values but also the accumulated HBCD output mass flows were similar, regardless whether HBCD containing foams were added or not. Even doubling the HBCD input did not considerably change the results. Such findings indicate a virtually total destruction.
Anlagen
5. Conclusions and recommendations
The disposal of end-of-life PSF by co-incineration with MSW has been investigated in the state-of-the-art MSWI in Würzburg, Germany. The main objective was the destruction efficiency of HBCD. Even assuming that the MSW did not contain any HBCD the analysed DE in all tests was well above 99.999 percent, independent of the amount of HBCD fed into the system.
The co-incineration had neither an influence on the operation of the plant nor on the air emission of all regulated components including PCDD/F.
The results from these tests indicate that co-treatment of PSF in MSWI plants is a safe disposal route for any PSF end-of-life foams. The typical combustion temperature of 900–1,000 °C guarantees the vitually total combustion of HBCD and the foam matrix, a combustion at higher temperature levels such as in HWI is not needed.
PSF can be handled in large scale MSWI if certain provisions are met: Mixed or single boards could be delivered with other construction waste. Delivery of complete board packages in plastic wrapping should be minimized as the crane has to break down these parcels. Typical market size boards as delivered for the tests can be handled. Good mixing of MSW and PSF boards is essential to achieve a good combustion control.
MSW incineration is widely applied in many industrialised countries. The plants offer short transport distances for the lightweight foams. State-of-the-art MSWI are highly energy efficient and allow the recovery of high shares of the energy inventory of the PSF.
Based on the results of these full-scale test trials MSW incineration technology has been included into the official list of UNEP (2015) of recognized destruction technologies for specific POPs.
Acknowledgements This work has been made possible thanks to the valuable support from many company stakeholders engaged in this cooperative venture.
6. References
[1] Abdallah, M.A.-E.; Ibarra, C.; Neels, H.; Harrad, S.; Covaci, A.: Comparative evaluation of li- quid chromatography-mass spectrometry versus gas chromatography-mass spectrometry for the determination of hexabromocyclododecanes and their degradation products in indoor dust.
Journal of Chromatography A, 1190, 2008, pp. 333–341
[2] Beach, M.W.; Rondan, N.G.; Froese, R.D.; Gerhart, B.B.; Green, J.G.; Stobby, B.G.; Shmakov, A.G.;
Shvartsberg, V.M.; Korobeinichev, O.P.: Studies of degradation enhancement of polystyrene by flame retardant additives. Polymer Degradation and Stability, 93, 2008, pp. 1664 - 1673 [3] Belevi, H.; Moench, H.: Factors determining the element behavior in municipal solid waste
incinerators. 1. Field studies. Environmental Science & Technology, 34, 2000, pp. 2501 – 2506 [4] Chandler, A.J.; Eighmy, T.T.; Hartlén, J.; Hjelmar, O.; Kosson, D.S.; Sawell, S.E.; van der Sloot,
H.A.; Vehlow, J.: Municipal Solid Waste Incinerator Residues. Studies in Environmental Science 67. Elsevier, Amsterdam, NL, 1997
Anlagen [5] Dresch, H.; Dima, B.; Horn, J.; Grüttner, W; Mark, F.E.: Large-scale demonstration of the treat- ment of Expanded Polystyrene Foam (EPS) and Extruded Polystyrene Foam (XPS) containing Hexabromocyclododecane (HBCD) as a flame- retardant by co-incineration in the Würzburg Municipal Solid Waste Incinerator. PlasticsEurope, Brussels, Belgium, 2014
[6] Dumler, R.; Thoma, H.; Lenoir, D; Hutzinger, O: PBDF and PBDD from the Combustion of Bromine Containing Flame Retardant Polymers: a Survey. Chemosphere, 19, 1989, pp. 2023 - 2031 [7] EAW: Hausmüllanalyse 2012 Rheingau-Taunus-Kreis. Internet:http://www.eaw-rheingau-tau-
nus.de/files/Hausmuellanalyse_2012homepage_IIx.pdf, 2013
[8] European Parliament and Council: Regulation (EC) No 1907/2006 of the European Parliament and of the Council of 18 December 2006 concerning the Registration, Evaluation, Authorisation and Restriction of Chemicals (REACH). Official Journal of the European Union, L136/3 - 280, 2007
[9] Heeb, N.V.; Graf, H.; Schweizer, W.P.; Lienemann, P.: Thermally induced transformation of hexa- bromocyclo dodecanes and isobutoxypenta bromocyclododecanes in flame-proofed polystyrene materials. Chemosphere, 80, 2010, pp. 701 - 708
[10] Hoh, E.; Hites, R.A.: Brominated Flame Retardants in the Atmospkere of the East-Cental United States. Environmental Science & Technology, 39, 2005, pp. 7704 - 7802
[11] Kajiwara, N.; Sueoka, M.; Ohiwa, T.; Takigami, HZ.: Determination of flame-retardant hexab- romocyclododecane diastereomers in Textiles. Chemosphere, 74, 2009, pp. 1485 - 1489 [12] Landratsamt Kitzingen: Hausmüllanalyse 2012/2013 im Landkreis Kitzingen. Internet: http://
www.kitzingen.de/media/www.kitzingen.de/org/med_12836/28720_hausmuellanalyse_2013_
web.pdf, 2013
[13] Mark F.E.: The Role of Plastics in Municipal Solid Waste Combustion. APME TEC Report 8004, 1994
[14] Mark, F.E.: Thermal Recovery of (A)SR – A Way Forward to ELVs Management. BHM - Berg- und Hüttenmännische Monatshefte 143, 1998, pp. 28 – 35
[15] Mark, F.E.; Fisher, M.M.; Smith, K.A.: Energy Recovery from automotive shredder resi- due. APME TEC Report No.8026 . Internet: http://www.plasticseurope.org/Documents/
Document/20100311161403-Energy_recovery_from_automotive_shredder_residue.pdf, 1998 [16] Mark, F.E.; Dresch, H.; Bergfeldt, B.; Dima, B.; Grüttner, W.; Kleppmann, F.; Kramer, K.; Lehner,
T; Vehlow, J.: Mitverbrennung von Reststoffen aus der Verwertung von Elektro- und Elektronik- Altgeräten im MHKW Würzburg 2004. Müll und Abfall, 38, 2006, pp. 27-34
[17] Mark, F.E.; Vehlow, J.; Dresch, H.; Dima, B.; Grüttner, W.; Horn, J.: Destruction of the flame retardant hexabromocyclododecane in a full-scale municipal solid waste incinerator, Waste Ma- nagement & Research, February 2015; vol. 33, 2: pp. 165-174.
[18] Morf, L.S.; Tremp, J.; Gloor, R.; Huber, Y.; Stengele, M.; Zennegg, M.: Brominated Flame Re- tardants in Waste Electricl and Electronic Equipment: Substance Flow in a Recycling Plant.
Environmental Science & Technology, 39, 2005, pp. 8691 - 8699
[19] Öberg, T.; Warman, K.; Bergström, J.: Bromine and waste incineration - an environmental risk?
Organohalogen Compounds, 2, 1990, 339 – 342
[20] PlasticsEurope: End-of-life treatment of HBCD containing polystyrene foams – Technical Sum- mary Report. PlasticsEurope, Brussels, Belgium, 2014
[21] Remberger, M.: Sternbeck, J.: Palm, A.: Kaj, L.: Strömberg, K.; Brorström-Lundén: The environ- mental occurrence of Hexabromocycldodecane in Sweden. Chemosphere, 54, 2004, 2004, pp.
9-21
[22] SHC: Hausmüllanalyse 2009/2010 Endbericht. Internet: http://www.landkreis-hildburghausen.
de/media/custom/328_3774_1.PDF?1284558023, 2012
Anlagen [23] Siepenkothen, H.-J.: Restabfallanalysen für die AWSH Abfallwirtschaft Südholstein GmbH.
Witzenhausen-Institut, Witzenhausen, Germany, 2010
[24] Statistisches Bundesamt: Erhebung über Haushaltsabfälle 2012. Internet: https://www.destatis.
de/DE/ZahlenFakten/GesamtwirtschaftUmwelt/Umwelt/UmweltstatistischeErhebungen/Ab- fallwirtschaft/Tabellen/ErgebnisberichtHaushaltsabfaelle.pdf?__blob=publicationFile, 2014 [25] Takigami, H.: Watanabe, M.; Kajiwara, N.: Destruction behaviour of hexabromocyclododecanes
during incineration of solid waste containing expanded and extruded polystyrene insulation foams. Chemosphere, in press (Internet: http://dx.doi.org/10.1016/j.chemosphere.2014.01.082), 2014
[26] Takigami, H.; Suzuki, G.; Hirai, Y.; Sakai, S.: Comparison of brominated flame retardants in indoor air and dust samples from two homes in Japan. Organohalogen Compounds, 69, 2007, pp. 2785 - 2788
[27] UNEP: Hexabromocyclododecane – Draft Risk Management Evaluation. Report of the UNEP Persistant Organic Pollutants Review Committee. Internet: http://chm.pops.int/UNEP-POPS- POPRC6WG-EVAL-HBCD-draftRME-110412.EN.doc, 2011
[28] UNEP: Stockholm Convention – Chemicals proposed for listing under the Convention. Inter- net: http://chm.pops.int/TheConvention/ThePOPs/ChemicalsProposedforListing/tabid/2510/
Default.aspx, 2014
[29] UNEP: Geneva 4-5 th of May, 2015, UNEP/CHW.12/CRP.18/Add.1 General technical guidelines on the environmentally sound management of wastes consisting of, containing or contaminated with persistent organic pollutant, 2015
[30] Vehlow, J; Bergfeldt, B.; Jay, K.; Seifert, H.; Wanke, T.; Mark, F.E.: Thermal Treatment of E+E Waste Plastics. Waste Management &Research, 18, 2000, pp. 131 – 140
[31] Vehlow, J.; Mark, F.E.: Influence of Bromine on Metal Volatilisation. Journal of Material Cycles and Waste Management, 2, 2000, 89 – 99
[32] Vehlow, J.; Bergfeldt, B.; Hunsinger, H.; Jay, K.; Seifert, H.; Mark, F.E.: Auswirkungen verschie- dener Kunststoffabfälle auf die Hausmüllverbrennung. Umweltpraxis 1-2/2003, 2003, pp. 18-21
Dorfstraße 51
D-16816 Nietwerder-Neuruppin
Tel. +49.3391-45.45-0 • Fax +49.3391-45.45-10
Bestellungen
unter www. .de
oderCD Recycling und Rohstoffe, Band 1 und 2 ISBN: 978-3-935317-51-1 Erscheinungsjahr: 2008/2009
Preis: 35.00 EUR
Recycling und Rohstoffe, Band 3 ISBN: 978-3-935317-50-4 Erscheinungsjahr: 2010 Hardcover: 750 Seiten, mit
farbigen Abbildungen
Preis: 50.00 EUR
Recycling und Rohstoffe, Band 4 ISBN: 978-3-935317-67-2 Erscheinungsjahr: 2011 Hardcover: 580 Seiten, mit
farbigen Abbildungen
Preis: 50.00 EUR
Recycling und Rohstoffe, Band 5 ISBN: 978-3-935317-81-8 Erscheinungsjahr: 2012 Hardcover: 1.004 Seiten, mit
farbigen Abbildungen
Preis: 50.00 EUR
Recycling und Rohstoffe, Band 6 ISBN: 978-3-935317-97-9 Erscheinungsjahr: 2013 Hardcover: 711 Seiten, mit
farbigen Abbildungen
Preis: 50.00 EUR
Recycling und Rohstoffe, Band 2 ISBN: 978-3-935317-40-5 Erscheinungsjahr: 2009 Hardcover: 765 Seiten
Preis: 35.00 EUR
Recycling und Rohstoffe
Herausgeber: Karl J. Thomé-Kozmiensky und Daniel Goldmann • Verlag: TK Verlag Karl Thomé-Kozmiensky
Thomé-KozmienskyBeckmann Energie aus Abfall 1
Thomé-Kozmiensky + Goldmann Recycling und Rohstoffe Band 2
Thomé-KozmienskyBeckmann Energie aus Abfall 1
Thomé-Kozmiensky + Goldmann Recycling und Rohstoffe Band 2Thomé-Kozmiensky + Goldmann Recycling und Rohstoffe Band 3
Band 1 aus
Thomé-Kozmiensky + Goldmann Recycling und Rohstoffe Band 4
Band 1 aus
Band 1 aus
Thomé-Kozmiensky + Goldmann Recycling und Rohstoffe Band 5
Band 1 aus
Thomé-Kozmiensky + Goldmann Recycling und Rohstoffe Band 6
RECYCLING UND ROHSTOFFE Band 1 und 2
KARL J. THOMÉ-KOZMIENSKY DANIEL GOLDMANN HRSG.
Copyright © 2009 TK Verlag Karl Thomé-KozmienskyAlle Rechte vorbehalten.
Das Einspeisen der Daten in Netzwerke ist untersagt.
CD Recycling und Rohstoffe, Band 1 und 2
Recycling und Rohstoffe, Band 2 bis 8
Paketpreis
Recycling und Rohstoffe, Band 7 ISBN: 978-3-944310-09-1 Erscheinungsjahr: 2014 Hardcover: 532 Seiten, mit
farbigen Abbildungen
Preis: 50.00 EUR
200.00 EUR
statt 370.00 EUR
Thomé-Kozmiensky + Goldmann Recycling und Rohstoffe Band 7
Thomé-Kozmiensky + Goldmann Recycling und Rohstoffe Band 8
Karl J. Thomé-Kozmiensky Daniel Goldmann
Recycling und Rohstoffe
Band 8
Recycling und Rohstoffe, Band 8 ISBN: 978-3-944310-20-6 Erscheinungsjahr: 2015 Hardcover: 684 Seiten, mit
farbigen Abbildungen
Preis: 50.00 EUR
Bibliografische Information der Deutschen Nationalbibliothek Die Deutsche Nationalbibliothek verzeichnet diese Publikation in der Deutschen Nationalbibliografie; detaillierte bibliografische Daten sind im Internet über http://dnb.dnb.de abrufbar
Karl J. Thomé-Kozmiensky, Michael Beckmann (Hrsg.):
Energie aus Abfall, Band 13
ISBN 978-3-944310-24-4 TK Verlag Karl Thomé-Kozmiensky
Copyright: Professor Dr.-Ing. habil. Dr. h. c. Karl J. Thomé-Kozmiensky Alle Rechte vorbehalten
Verlag: TK Verlag Karl Thomé-Kozmiensky • Neuruppin 2016
Redaktion und Lektorat: Professor Dr.-Ing. habil. Dr. h. c. Karl J. Thomé-Kozmiensky, Dr.-Ing. Stephanie Thiel, M.Sc. Elisabeth Thomé-Kozmiensky
Erfassung und Layout: Sandra Peters, Ginette Teske, Janin Burbott-Seidel, Anne Kuhlo, Carolin Bienert
Druck: Universal Medien GmbH, München
Dieses Werk ist urheberrechtlich geschützt. Die dadurch begründeten Rechte, insbesondere die der Übersetzung, des Nachdrucks, des Vortrags, der Entnahme von Abbildungen und Tabellen, der Funk- sendung, der Mikroverfilmung oder der Vervielfältigung auf anderen Wegen und der Speicherung in Datenverarbeitungsanlagen, bleiben, auch bei nur auszugsweiser Verwertung, vorbehalten. Eine Vervielfältigung dieses Werkes oder von Teilen dieses Werkes ist auch im Einzelfall nur in den Grenzen der gesetzlichen Bestimmungen des Urheberrechtsgesetzes der Bundesrepublik Deutschland vom 9.
September 1965 in der jeweils geltenden Fassung zulässig. Sie ist grundsätzlich vergütungspflichtig.
Zuwiderhandlungen unterliegen den Strafbestimmungen des Urheberrechtsgesetzes.
Die Wiedergabe von Gebrauchsnamen, Handelsnamen, Warenbezeichnungen usw. in diesem Werk berechtigt auch ohne besondere Kennzeichnung nicht zu der Annahme, dass solche Namen im Sinne der Warenzeichen- und Markenschutz-Gesetzgebung als frei zu betrachten wären und daher von jedermann benutzt werden dürfen.
Sollte in diesem Werk direkt oder indirekt auf Gesetze, Vorschriften oder Richtlinien, z.B. DIN, VDI, VDE, VGB Bezug genommen oder aus ihnen zitiert worden sein, so kann der Verlag keine Gewähr für Richtigkeit, Vollständigkeit oder Aktualität übernehmen. Es empfiehlt sich, gegebenenfalls für die eigenen Arbeiten die vollständigen Vorschriften oder Richtlinien in der jeweils gültigen Fassung hinzuzuziehen.