the detection of the human pathogenic protozoan Giardia, Cryptosporidium and Toxoplasma
Inaugural-Dissertation zur
Erlangung des Doktorgrades
der Mathematisch-Naturwissenschaftlichen Fakultät der Universität zu Köln
vorgelegt von Isaia Sotiriadou
aus
Kozani-Griechenland
Köln, Juni 2012
This dissertation is dedicated to
my parents and my sister
Prof. Dr. Hartmut Arndt Prof. Dr. Sigrun Korsching
Date of oral examination: 15
thJune 2012.
Tag der mündlichen Prüfung: 15 Juni 2012.
First I would like to express my sincere gratitude to my supervisor Prof. Dr.
Panagiotis Karanis for having given me the opportunity to carry out my research in his laboratory and for his initial ideas and constant efforts for the realization of my scientific work. I am very grateful to Prof. Dr. Hartmut Arndt, Cologne Biocenter, Zoological Institute, and Prof. Dr. Sigrun Korsching, Cologne Biocenter, Institut for Genetics, for the supervision of my thesis. I would like to thank Prof. Dr. Thomas Wiehe for chairing my thesis committee during my thesis defense.
I would like to thank Prof. Dr. Michael Noack, PD. Dr. Michael Wicht and Birgit Rauschenberger, all from the Centre of Dental Medicine, Policlinic of Operative Dentistry and Periodontology at the University of Cologne for taking me in their scientific team and supporting the realization of this work financially and experimentally.
I also would like to thank Prof. Dr. Agapios Sachinidis, Institute of Neurophysiology, Medical Faculty of Cologne, and Dr. Johannes Winkler, Institute for Genetics, for expanding my knowledge.
For the collection of the relevant samples from different countries I would like to express my thanks to our collaborators Prof. Vladimir Kartashev, Department of Infectious Diseases, Medical School of Rostov University, Russia, Dr. Kalina Stojanova, University of Varna, Bulgaria, Dr. Mayuna Srisuphanunt, Mahidol University of Bangkok, Thailand, Dr. Nikola Pantchev, Idexx Vet Med Lab, Ludwigsburg, Germany, Diliana Kostova and Rumen Mitov.
I am very grateful to Prof. Dr. Juergen Koebke
†and Jutta Knifka, Center of Anatomy, University of Cologne, for their support during the last years and for warm and friendly discussions.
Finally, I would like to thank my friend Konstantinos Karananos for encouraging and motivating me. Thank you for always believing in me.
Also especially my family has given a constant support and encouragement. Without them I would never have been successful so far.
Thank you is not enough and if your name is not listed, rest assured that my gratitude
is not less.
1. Introduction...1
1.1 The life cycle of Giardia spp. ...1
1.2 Phylogeny of
Giardia...31.3 Nomenclature and taxonomy of Giardia...3
1.4 The life cycle of Cryptosporidium spp...5
1.5 Phylogeny of
Cryptosporidium ...91.6 Nomenclature and taxonomy of Cryptosporidium ...10
1.7 The life cycle of Toxoplasma...13
1.8 Phylogeny of
Toxoplasma ...151.9 The LAMP principle ...15
1.10 Bioinformatics and primer design ...18
1.11 Web-based analysis of target gene sequences ...19
1.12 Criteria and key factors in the LAMP primer design ...22
1.12.1 Melting temperature (Tm) of the primers ...22
1.12.2 Stability of the end of the primers ...23
1.12.3 GC% primer content ...23
1.12.4 Formation of secondary structures ...23
1.12.5 Improved specificity of the primers ...24
1.13 The investigated gene for the development of the LAMP technique for the detection of Cryptosporidium ...24
1.14 The investigated genes for the development of the LAMP technique for the detection of Toxoplasma ...25
1.15 Selection and comparison of sequences for primer design...26
1.16 LAMP vs PCR ...29
1.17 Aim of the present thesis...31
1.18 References ...33
2. Single nucleotide polymorphism (SNP)-based loop-mediated isothermal amplification (LAMP) assay for the detection of human pathogenic
Cryptosporidium species – clinical and environmentalverification and first detection of C. fragile in water ...49
2.1. Introduction...50
2.2.1 Origins of samples...52
2.2.2 Reference isolates used ...52
2.2.3 Sample analysis ...53
2.2.4 Detection and identification of Cryptosporidium oocysts by immunofluorescence test (IFT) and differential interference contrast (DIC) microscopy...53
2.2.5 Extraction of genomic DNA (gDNA)...53
2.2.6 Development of the SNP-based LAMP assay for the detection of the SAM Cryptosporidium gene...54
2.2.7 Application of the GP60-LAMP assay...56
2.2.8 SAM-LAMP reaction conditions ...56
2.2.9 nPCRs based on the 18S rRNA gene for the detection of Cryptosporidium 56 2.2.10 Visualization of the nPCR and LAMP-generated products ...56
2.2.11 Sequencing of the positive Cryptosporidium products detected by nPCR ...57
2.2.12 Phylogenetic analysis of the Cryptosporidium species in positive samples 57 2.2.13 Specificity and sensitivity of the SAM-LAMP assay ...58
2.2.14 LAMP verification in simulated water samples...58
2.2.15 PCR verification in simulated water samples...60
2.3 Results...62
2.3.1 Specificity of the SNP-based SAM-LAMP assay for the detection of Cryptosporidium species DNA...62
2.3.2 Sensitivity of the SAM-LAMP SNP-based assay for the detection of Cryptosporidium species DNA...62
2.3.3 Verification of the SNP-based SAM-LAMP assay in simulated and natural water samples and comparison with IFT and nPCR methods ...63
2.2.4 Application and comparison of the IFT, nPCR and LAMP assays in samples from different hosts and water samples from Thailand...63
2.2.4.1 Water samples...63
2.2.4.2 Mussel samples...69
2.2.4.3 Human fecal samples ...69
2.2.4.4 Sequence and phylogenetic analysis ...69
3. Evaluation of LAMP for detection of Toxoplasma gondii
in water samples and comparative findings by PCR and IFT ...82
3.1 Introduction...83
3.2 Materials and methods...85
3.2.1 Sources of DNA material for PCR and LAMP evaluation experiments; DNA templates selection for sensitivity and specificity evaluation assays ...85
3.2.2 Target genes and primers design for the detection of Toxoplasma DNA ...85
3.2.3 Cultivation of Toxoplasma tachyzoites...87
3.2.4 DNA extraction from Toxoplasma tachyzoites (culture) and oocysts (stock)...87
3.2.5 Reaction mix for LAMP detection of the DNA ...87
3.2.6 PCR specificity of LAMP outer primers (F3 and B3)...88
3.2.7 Electrophoresis of LAMP and PCR amplified products...88
3.2.8 Direct sequencing...89
3.2.9 Nested PCR based on the 18S-rRNA gene for the detection of Toxoplasma DNA in spiked water pellets and in environmental water samples ...89
3.2.10 Environmental water samples...89
3.2.11 Application of LAMP and PCR assays in water samples collected from various sources ...90
3.2.11.1 Application of the LAMP and nested PCR in spiked water pellets .90 3.2.11.2 Direct application of the LAMP and nested PCR in natural water sediments ...90
3.2.12 Statistical methods ...90
3.2.13 IFT assay on environmental water samples for the detection of Toxoplasma oocysts...92
3.3 Results...94
3.3.1 LAMP specificity ...94
3.3.2 LAMP sensitivity ...95
3.3.3 Application of LAMP and nested PCR assays in spiked water
samples ...96
3.3.3.1 LAMP...96
3.3.3.2 Nested PCR...97
3.3.3.3 Statistical analysis of the spiked samples...97
3.3.4 Direct application of LAMP and PCR assays in natural water samples .97 3.3.4.1 LAMP...97
3.3.4.2 Nested PCR...97
3.3.4.3 Statistical analysis of the natural samples ...98
3.3.5 IFT ...98
3.4. Discussion ...98
3.5. References ...101
4. Molecular identification of
Giardia and Cryptosporidiumfrom dogs and cats ...105
4.1. Introduction...107
4.2 Materials and methods...107
4.2.1 Sample collection ...108
4.2.2 Sample purification ...108
4.2.3 DNA extraction ...108
4.2.4 Molecular assays for the detection of Giardia and Cryptosporidium in faecal samples...109
4.2.4.1 Giardia spp. ...109
4.2.4.2 Cryptosporidium spp...109
4.2.5 PCR product purification and sequencing...110
4.3 Results and discussion...111
4.4 References ...117
5. Summary ...121
6. Zusammenfassung ...124
ATP Adenosine Triphosphate
B3 Backward Outer Primer
BIP Backward Inner Primer
c Complementary COWP Cryptosporidium Oocyst Wall Protein DDBJ DNA Data Bank of Japan
EBI-EMBL European Molecular Biology Laboratory -European Bioinformatics Institute
EF1α Elongation Factor 1 Alpha
ESVs Encystation Specific Vesicles F3 Forward Outer Primer
FE-SEM Field Emission Scanning Electron Microscopy FIP Forward Inner Primer
FITC Fluorescein Isothiocyanate
GDH Glutamate Dehydrogenase
gDNA Genomic DNA
GP60 60 Kda Glycoprotein
HPLC High-Performance Liquid Chromatography HSP Heat Shock Protein
ICZN International Code of Zoological Nomenclature
IFT Immunofluorescence Test
L Loop Primers
LAMP Loop Mediated Isothermal Amplification
LDM Limited Dilution Method LF Forward Loop Primer Lsu rRNA Long Subunit Rrna,
NASBA Nucleic Acid Sequence Based Amplification nPCR Nested Polymerase Chain Reaction
nt Nucleotides PBS Phosphate Buffered Saline PCR Polymerase Chain Reaction
PCR−RFLP Polymerase Chain Reaction−Restriction Fragment Length Polymorphism
PV Parasitophorous Vacuole
PVM Parasitophorous Vacuolar Membrane
SAM S-Adenosyl-Methionine Synthetase
SNP Single Nucleotide Polymorphism SSU rRNA Small Subunit Rrna
TAE Tris-Acetate-Edta
TgOWP1 Toxoplasma gondii Oocyst Wall Protein
tpi Triosephosphate Isomerase
TRAP C Thrombospondin- Related Adhesive Protein of Cryptosporidium wwPDB Worldwide Protein Data Bank
β-giardin Beta
Giardin
1. Introduction
1.1 The life cycle of Giardia spp.
Giardia has a direct two-stage life cycle consisting of the trophozoites and cysts. The infectious stage of the parasite, the cyst, is encysted when released into the feces. It is the resistant form, immediately infectious and responsible for the transmission of the disease. The trophozoite stage of Giardia lamblia (G. duodenalis, G. intestinalis) has a characteristic flattened tear-drop shape and measures an average size of 15 x 9 µm x 3 µm. When stained, the trophozoites appear to be bilaterally symmetrical and dorsoventrally flattened having twin nuclei, two slender median rods (axostyles), which play an important role for differentiating between species, and 4 pairs of flagella - one arising from the anterior, two from the posterior and one from the caudal end of the body of the organism. The pair of anterior flagella, known as axoneme, is straight, closely approximated and parallel to each other, dividing the body of the organism into two halves longitudinally. Trophozoites lack mitochondria, endoplasmic reticulum, Golgi, peroxisomes and lysosomes (Elias et al., 2008;
Abodeely et al., 2009).
The life cycle begins by the oral ingestion of a few cysts through contaminated water, food, or by the fecal-oral route (hands or fomites) (Rendtorff and Holt, 1954;
Baldursson and Karanis, 2011) (Figure 1). The low pH of the stomach acid induces excystation, in which the activated flagellum breaks through the cyst wall and the proteolytic activity of the duodenum forces each cyst to produce two trophozoites.
The trophozoites remain in the lumen of the proximal small bowel where they can be free or attached to the mucosa by a ventral sucking disk and multiply asexually by longitudinal binary fission.
The trigger for encystment is not clear, but the process occurs most likely as a result
of exposure to and stimulation by bile salts and fatty acids, and a more alkaline
environment. During encystation, developmentally regulated formation of large
secretory compartments containing cyst-wall material occurs. Despite the lack of any
morphological similarities, these encystation-specific vesicles (ESVs) show several
biochemical characteristics of maturing Golgi cisternae (Marti and Hehl, 2003; Hehl
and Marti, 2004).
Figure 1. Giardia lamblia life cycle stages and transmission routes.
Cysts are the stage found in normal and non-diarrheal feces, while both cysts and trophozoites can be found in feces, and are infectious immediately. The cysts are non-motile and egg-shaped, measuring an average of 12 μm x 9 μm and are encased by a smooth and colourless, thick and refractile wall (Ali and Hill, 2003).
Immediately after encystation, like alldiplomonads, newly formed Giardia cysts contain two genetically identical diploid nuclei that are morphologically indistinguishable, replicate at approximately the same time, and are both transcriptionally active (Adam, 2000). However, each organelle duplicates so that in permanently stained mature cysts, four prominent nuclei and four median bodies are observed.
1.2 Phylogeny of
GiardiaThe phylogeny of Giardia is not completely clear since it has simple intracellular structures that might represent an early branching of the eukaryotic lineage that diverges before the acquisition of mitochondria. Giardia belongs to the Kingdom:
Protista, Subkingdom: Protozoa, Phylum: Sarcomastigophora, Subphylum:
Mastigophora, Class: Zommastigophora, Order: Diplomonadida, Family:
Hexamitidae, Genus: Giardia, Species: lamblia (Adam, 2001; Morrison et al., 2007).
1.3 Nomenclature and taxonomy of Giardia
Giardia duodenalis, Giardia intestinalis and Giardia lamblia are species names
interchangeably used in current literature referring to the same organism. Giardia has
a global distribution and is a major contributor to the enormous burden of diarrheal
diseases. Six different G. intestinalis assemblages have been defined (A-H) by DNA
sequence analysis so far, of which assemblages A and B are mainly virulent for
humans and are often referred to as ‘zoonotic’ assemblages (Caccio and Ryan,
2008; Lasek-Nesselquist et al., 2010). Giardia host-adapted assemblages have been
found to be assemblages C and D primarily for dogs, assemblage E or livestock
genotype for artiodactyl species and assemblage F for cats (Table 1).
Table 1. Giardia spp. names, assemblages, host-adapted assemblages and Polymerase Chain Reaction (PCR-based techniques to detect and differentiate Giardia spp. at species and assemblages level.
Species Assemblages Major host PCR-based
techniques Reference
Assemblage A (Polish)
GDH, β-giardin, tpi, SSU rRNA, kinesin-like protein 1, β- tubulin, cyst wall protein, giardin
Upcroft et al., 1996 Monis et al., 1996 Homan et al., 1998 Karanis & Ey, 1998 Iwabe and Miyata, 2001 Palm et al., 2003 Beck et al., 2011
Gomez-Munoz et al., 2012 Asher et al., 2012 Beck et al., 2012
Assemblage B (Belgian)
Humans, nonhuman primates, domestic and wild ruminants, alpacas, pigs, horses,
domestic and wild canines, cats, ferrets, rodents, monkeys, marsupials, other
mammals
GDH, tpi, β- giardin, EF1A, SSU rRNA
Monis et al.,1996 Homan et al., 1998 Karanis & Ey, 1998 Sulaiman et al., 2003 Breathnach et al., 2010, Lasek-Nesselquist et al., 2008
Bonhomme et al., 2011 Wielinga et al., 2011 Asher et al., 2012
Assemblages C and D
GDH, β giardin, tpi
Monis et al., 1996 Sulaiman et al., 2003 Gaydos et al., 2008 Paz e Silva et al., 2012
Assemblage E
Domestic and wild canines
GDH, β-giardin, tpi, SSU rRNA
Khan et al., 2011 Levecke et al., 2011 Ng et al., 2011
Assemblage F Cats GDH, SSU rRNA, tpi,
β-giardinLalle et al., 2005 Suzuki et al., 2011
Assemblage G Mice, rats GDH, tpi,
Lasek-Nesselquist et al., 2010Lebbad et al., 2010
G.
duodenalis (intestinalis, lamblia)
Assemblage H Seals GDH
Lasek-Nesselquist et al., 2010G. agilis Amphibians none
Hegner, 1922G. muris Rodents
Lsu rRNA, variant-specific surface protein, tpi, EF1A,
β-giardinvan Keulen et al., 1992 Monis et al., 1999 van Keulen et al., 2002 Guy et al., 2004 Ropolo et al., 2005
G. psittaci Birds SSU rRNA
van Keulen et al., 2002G. ardeae Birds
GDH SSU rRNA, tpi, EF1A, actin
van Keulen et al., 1993 Monis et al., 1999 Teodorovic et al., 2007
G. microti Muskrats and
voles SSU rRNA, tpi
van Keulen et al., 1998 Sulaiman et al., 2003The uncertain taxonomy affected negatively the understanding of giardiasis and was supported from the fact that several papers in the international literature do not consistently used the terms (sub-) assemblage and (sub-)genotype. It is suggested to use the terms genotype, assemblage and subassemblage for the characterisation of the different Giardia lineages (Plutzer et al., 2010).
The uniqueness of assemblages A and B was shown after phylogenetic analyses of nucleotide sequence obtained from the amplification of the small subunit (SSU) rRNA gene and housekeping genes such as glutamate dehydrogenase (GDH), beta giardin (β-giardin), elongation factor 1 alpha (EF1α), and triosephosphate isomerase (tpi) genes (Adams et al., 2004; Robertson et al., 2006; Gelanew et al., 2007; Caccio et al., 2008). Recent studies based on a multilocus approach defined that isolates could only be allocated to a specific group when polymorphisms of the three loci were combined, which makes the multilocus genotyping more difficult and complex (Levecke et al., 2009).
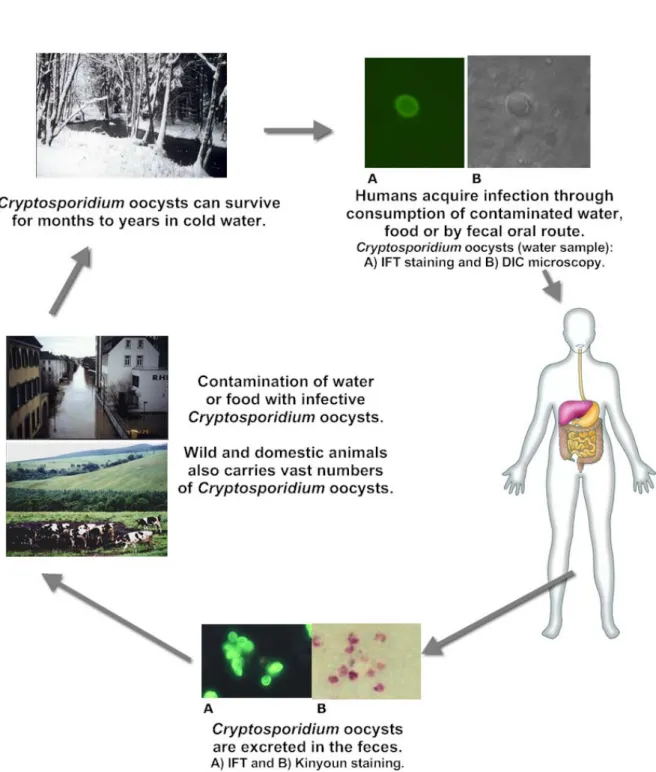
1.4 The life cycle of Cryptosporidium spp.
The life cycle of Cryptosporidium is complex with both sexual and asexual cycles, and there are six distinct developmental stages where it complete its entire cycle within a single host (Keusch et al., 1992). Cryptosporidium infection begins with ingestion of the sporulated oocyst, the resistant stage produced by Cryptosporidium that is found in the environment. The remarkably stable oocysts can survive for months or even years in the environment, while the infective dose is low, probably even a single oocyst can cause infection (Skotarczak, 2010) (Figure 2).
Each mature oocyst (5 µm) contains 4 infective stages termed sporozoites, which are rapidly expelled through an opening that is formed in the oocyst wall when the oocysts encounter appropriate biochemical and environmental factors (Fayer and Leek, 1984; Upton et al., 1994; Karanis et al., 2008; Karanis and Aldeyarbi, 2011).
The residual body is either released or retained within the oocyst. In the intestine,
sporozoites invade the epithelial linings and within these cells, the sporozoites
When the sporozoites attach to the epithelial cells and invade the host cell, a parasitophorous vacuolar membrane (PVM) envelops them. At this stage the parasite is considered as being intracellular but extracytoplasmic, enclosed by a thin layer of host cell cytoplasm, as it remains in a highly polar location adjacent to the surface of the columnar host intestinal epithelial cell (O’Donoghue, 1995; Umemiya et al., 2005). Throughout the literature for the localisation of Cryptosporidium stages in the intestine, recently the findings of Valigurova et al. re-evaluated the term used up to now term “intracellular, but extra-cytoplasmatic” (Valigurova et al., 2007; Jirku et al., 2008). The newly introduced and suggested term is “epicellular” and is used to describe the parasite embracement by the host cell membrane (Valigurova et al., 2007).
Field Emission Scanning Electron Microscopy (FE-SEM) and comparative transmission electron microscopy observations, showed the evolutionary homology of Gregarina steini and C. muris and confirmed that the cryptosporidian developmental stages are not intracellular, do not penetrate under the host cell membrane and do not come into close contact with the host cell cytoplasm (Valigurova et al., 2007).
Cryptosporidium shares several characteristics similar to gregarines like the
occupation of an extracytoplasmatic niche, concerning the feeding dependency and
similar location after host cell invasion (Borowski et al., 2008). On the other hand the
feature of Cryptosporidium to promote the encapsulation with the host cell apical
membrane, when the parasite invides the host cell is a unique property in relation to
gregarines and is closely dependent upon their connection with the host cell for
nutrient acquisition (Borowski et al., 2010).
Figure 2. Cryptosporidium life cycle stages and transmission routes.
During the process of the developing of the parasite to trophozoite, the parasitophorous vacuole (PV) invaginates at the host cell interface and forms the so called “feeder organelle” responsible for nutrient uptake from the host cell (Spano and Crisanti, 2000) while materials appear to be released from the conoid at the anterior tip of the sporozoite (Xiao and Fayer, 2008). Within the Type I meront, 8 merozoites are formed as a result of the multiple fission (=merogony; =schizogony) releasing free merozoites from the PV. Type I merozoites can undergo two different cycles. Either they can further develop through type II merogony, or undergo another round of Type I merogony to form additional meronts by rising the potential of continuously existance of Type I meronts (Current and Reese,1986). Probably due to the recycling of the Type I merozoites through the Type I merogony the classical persistent Cryptosporidium infection is observed. Trophozoites undergoing asexual division produce from each meront 6-8 merozoites that can infect another host cell and to develop the Type II meronts. Type II meronts are capable either of initiating another round of type II merogony or type II merozoites develop into the sexual reproductive stages of the parasite known as gamonts. Controversial preliminary investigations suggest that extracellular gamont stages of the gregarines very closely resemble the extracellular forms of Cryptosporidium (Hijjawi et al., 2002; 2004;
Rosales et al., 2005). These gamonts initiate sexual differentiation producing male microgamonts or female macrogamonts.
The sexual stage of development occurs upon the mating of the macrogamete, containing one large nucleus which does not divide, and the multinucleate microgamete incorporating at least 16 microgametes. The produced diploid zygote result to the formation of oocyst containing four haploid sporozoites. These oocysts are the environmentally resistant form and are passed in the feces after their release in the gastrointestinal tract. Oocysts can be differentiated into two types: the so called
“thick-walled” oocysts composed of two outer membranes representing approximately 80% of the produced oocysts capable of infecting other hosts and the
“thin-walled” composed of a single outer membrane not passed in the feces
representing approximately 20% of the produced oocysts capable of infecting other
hosts (Current and Reese,1986). This feature, along with recycled meronts, is
probably responsible for the persistent infections that are not propagated by repeated
ingestion of oocysts. This often life-threatening non-resolving state of cryptosporidiosis is often observed in AIDS patients (Clark, 1999; Gookin et al., 2002).
1.5 Phylogeny of
CryptosporidiumThe genus Cryptosporidium was discovered by Ernest E. Tyzzer as a peculiar parasite affecting the mouse stomach and is recognised as the first named species, Crytosporidium muris, as coccidian (Jirku et al., 2008). Later he described C. parvum which affected the mouse intestine (Tyzzer, 1912). In the following years, multiple new cryptosporidian species were described, infecting the majority of vertebrates, and the taxonomic status of the genus has been traditionally aligned to the coccidia.
The taxonomic classification has been the subject of debate undergoing major revisions, because Cryptosporidium possesses features of both the coccidia and gregarines, and yet probably represents a distantly related lineage of apicomplexa (Barta and Thompson, 2006).
Within the genus, species designation has evolved with the application and interpretation of emerging technologies in the 100 years since the first named species, C. muris, was proposed (Tyzzer, 1910). Classical parasitological features of life cycle, host range, morphology and site of infection have more recently been complemented with genomic data. At the 6th Meeting on Molecular Epidemiology and Evolutionary Genetics in Infectious Disease, France, recommendations for the criteria for naming new species of Cryptosporidium were made (Xiao et al., 2004a).
Fulfilment of four basic requirements was suggested: morphometric studies of
oocysts, genetic characterisation, demonstration of natural and (if feasible) some
experimental host specificity, and compliance with the International Code of
Zoological Nomenclature (ICZN) (Xiao et al., 2004a, Plutzer and Karanis, 2009). On
this basis, there are now 20 named species (22, if two fish species are accepted
without genetic characterisation) (Fayer et al., 2010). The main human pathogens
are considered to be C. hominis, C. parvum and C. meleagridis, with evidence for
pathogenicity of C. felis and C. canis in some settings (Xiao et al., 2002; Xiao and
Ryan, 2004; Cama et al., 2008). However, genetic analyses in the absence of other
data have led to the temporary naming of “genotypes” unlinked to named species
(Slapeta, 2012). One of these, the “rabbit genotype”, has been identified as a human pathogen of public health importance, having caused a waterborne outbreak (Chalmers et al., 2009).
1.6 Nomenclature and taxonomy of Cryptosporidium
An endless debate associated with the nomenclature and the taxonomy of the different Cryptosporidium spp. has begun, where researchers all over the world quote their arguments and defending the newly characterised species. According to the fourth edition of the ICZN rules governing the taxonomy of protozoan parasites and other animals taking effect on 1 January 2000 (www.nhm.ac.uk/hosted-
sites/iczn/code/) for the naming of new species of Cryptosporidium there are criteriato be met such as morphometric (i.e. microscopic observations of oocysts - size and morphology) description of the morphology and unique features of the oocysts, cross-infectivity experiments to demonstrate natural or to conduct forced host infections, the development of numerous molecular biological techniques experimental host specificity and genetic characterisation to differentiate the new nominal taxon from related or similar taxa (Egyed et al., 2003; Slapeta, 2006; Xiao et al., 2004a; 2012; Slapeta, 2012). There are unsolved problems about the precise number of species infecting humans, complexity, the attribution of different species or strains/genotypes to sporadic or outbreak events, the virulence or transmission of the species or strains/genotypes in humans and the abscence of diagnostic features that allow the differentiation of Cryptosporidium spp..
Traditional, microscopic, biochemical and serological techniques have shown
significant limitations on the specific diagnosis of cryptosporidiosis and there has
been substantial need for improved molecular detection techniques (Cacciò and
Pozio, 2006). Epidemiological investigations are helpful to define the transmission
routes of cryptosporidiosis, but traditional diagnostic tools do not have the ability to
differentiate sources of parasites, and epidemiologic investigations are expensive to
detect and differentiate Cryptosporidium spp. at species/genotype and subtype levels
as shown in Table 2. Although the present table focuses predominantly on PCR-
based methods, other approaches such nucleic acid sequence based amplification
(NASBA) have been proposed (Compton, 1991; van Belkum and Neisters, 1995).
Table 2. Cryptosporidium spp. names, host-adapted species and PCR-based techniques to detect and differentiate Cryptosporidium spp. at species and genotype level.
Species Major Host PCR-based
techniques Reference
C. agni*
Sheeps - Barker & Carbonell,1974
C. ameivae*
Lizards -Arcay-de-Peraza &
Bastardo-de-San- Jose,1969
C. andersoni
Cattles, Calves Bactrin CamelsHSP90, microsatellite
& minisatellite, SSU rRNA, COWP loci, 18s
rRNA, actin
Lindsay et al., 2000 Xiao et al., 2000 Sulaiman et al., 2002 Fayer et al., 2006 Wang et al., 2008 Feng et al., 2011 Wang et al., 2011
C. anserinum*
Geeses - Proctor & Kemp,1974C. baileyi
Birds Ducks Geeses
18s rRNA, SSU rRNA and HSP70, COWP,
actin
Current et al., 1986 Sulaiman et al., 2000 Xiao et al., 2000 Gasser et al., 2001 Sulaiman et al., 2002 Chvala et al., 2006 Amer et al., 2010
C. blagburni
Birds HSP70, 18s rRNA Morgan et al., 2001C. bovis
Calves Cattles SSU rRNA, 18s rRNA HSP-70, actinFayer et al., 2005, Fayer et al., 2006 Wang et al., 2011 Santín & Zarlenga, 2009
C. canis
Dogs Humans Hsp70, SSU rRNA, COWP, cHSP70Xiao et al., 1999 Xiao et al., 2000 Sulaiman et al., 2000 Lindergard et al., 2003
C. cichlidis*
Fishes - Paperna & Vilenkin,1996
C. crotali
Snakes - Triffit, 1925C. cuniculus
RabbitsSSU rRNA, 60kDa GP60, HSP70, actin,
CWOP
Rehg et al., 1979 Chalmers et al., 2009 Nolan et al., 2010 Robinson et al., 2010
C. curyi
Cats - Ogassawara et al.,1986
C. fayeri
Koalas Kangaroos GP60, 18s rRNA, actinRyan et al. 2008 Power et al., 2009 Power et al., 2011 Waldron et al., 2010
C. felis
Cats18S rRNA SSU rRNA, COWP TRAP-C Cpgp40/15, HSP70,
actin
Sulaiman et al., 2000 Xiao et al., 2000 Sulaiman et al., 2002 Lindergard et al., 2003 Santin et al., 2006
Species Major Host PCR-based
techniques Reference C. fragile
Frogs SSU rRNA Jirku et al., 2008C. galli
Birds 18s rRNA Pavlasek, 1999da Silva et al., 2010
C. hominis
Humans Monkeys SSU rRNA, COWP, TRAP-C, Cpgp40/15 (Morgan-Ryan et al., 2002
Muthusamy et al., 2006
C. macropodum
Kangaroos Power & Ryan 2008C. meleagridis
Birds Turkeys Humans
SSU rRNA COWP, TRAP-C, Cpgp40/15,
HSP70, actin
Sulaiman et al., 2000 Sulaiman et al., 2002 Xiao et al., 2000 Muthusamy et al., 2006
C. molnari
Fishes SSU rRNA, actinAlvarez-Pellitero &
Sitjà-Bobadilla, 2002 Palenzuela et al, 2010 Barugahare et al., 2011
C. muris
Rodents Humans Mices Giraffe Monkeys Snakes Cattles Bovine Cats Bactrin Camels
18S rRNA, SSU rRNA, GP60, 18S rDNA and ITS1 regions, HSP-70,
TRAP C, COWP, pgp40/15, microsatellite and minisatellite, HSP70,
actin
Tyzzer, 1907 Morgan et al., 2000 Sulaiman et al., 2000 Xiao et al., 2000 Dubey etal., 2002 Gatei et al., 2002 Sulaiman et al., 2002 Palmer et al., 2003 Hikosaka & Nakai, 2005
Muthusamy et al., 2006 Santín et al., 2006 Lv et al., 2009 Pedraza-Díaz et al., 2009
Kodadkova et al., 2010 Feng et al., 2011
C. nasorum
Fishes - Levine, 1984C. parvum
Humans Snakes Cattles Mammals
SSU rRNA, COWP TRAP-C, CpGP40/15,
hsp 70, 18s rRNA
Tyzzer, 1912, Sulaiman et al., 2002 Lindergard et al., 2003 Xiao et al., 2004b Fayer et al., 2006
C. pestis
Tortoises Cattles SSU rRNAr Slapeta, 2006, Traversa et al., 2008C. ryanae
Cattles Calves SSU rRNAFayer et al., 2008 Santín & Zarlenga, 2009
Wang et al., 2011 C. reichenbachklinkei Fish - Paperna et al., 1986
C. rhesi*
Monkeys - Levine, 1980C. saurophilum
Reptiles Lizards actinKoudela & Modry 1998 Sulaiman et al., 2002 Xiao et al., 2004b Plutzer & Karanis, 2007
Pavlasek & Ryan, 2008
C. scophthalmi
Alvarez-Pellitero et al. 2004;
2009
Species Major Host PCR-based
techniques Reference C. serpentis
Snakes COWP, HSP70, actinLevine, 1980,
Sulaiman et al., 2000 Xiao et al., 2000 Sulaiman et al., 2002 Xiao et al., 2004b
C. suis
Pigs Cattles 18s rRNA Ryan et al. 2004 Fayer et al., 2006C. tyzzeri n. sp.
Mices SSU rRNA, GP60 Ren et al., 2012 Xiao et al., 2012C. ubiquitum
Goats Sheeps Calves Humans
SSU rRNA, COWP HSP70, actin
Robinson et al., 2008 Fayer et al., 2010 Pollock et al., 2010 Robinson et al., 2010 Fiuza et al., 2011
C. varanii*
Lizards 18S rRNA, actin Pavlasek & Ryan, 2008C. villithecum
Fishes - Paperna et al., 1986C. wrairi
Guinea pigs COWP, HPS70, actinVetterling et al. 1971 Xiao et al., 2000 Sulaiman et al., 2000 Sulaiman et al., 2002
C. xiaoi
Sheep SSU rRNA, HSP-70,actin Fayer & Santin, 2009
- : only morphological data; *removed from Cryptosporidium
1.7 The life cycle of Toxoplasma
The life cycle of Toxoplasma consists of two phases and exists in three infectious forms: oocysts, tachyzoites, and bradyzoites virulent for both both intermediate and definitive host (Tender, 2009). The oocyst is the most environmentally resistant stage of Toxoplasma. Domestic cats and their relatives, members of the family Felidae, are the definitive host. They produce large numbers of unsporulated Toxoplasma oocysts in the environment after ingesting any of the three infectious stages of T. gondii (Fritz et al., 2012) (Figure 3). Intermediate hosts in nature are birds, rodents and humans as well, and they become infected after ingesting soil, water or plant material contaminated with Toxoplasma oocysts. Shortly after ingestion, the oocysts develop into tachyzoites, which are the rapidly multiplying trophozoite form of Toxoplasma, by invading the epithelial cells and forming the PV. At this stage the parasites divide rapidly and convert to tissue cysts bradyzoites, which are the slowly replicating versions of the parasite and represent the encysted stage of the parasite in tissue.
Tissue cysts are more prevalent in the neural and muscular tissues, but also emerge
completes when Felidae become infected by ingestion of bradyzoite tissue cysts of infected intermediate hosts (Afonso et al., 2006). Sporulation occurs outside the cat within 1-5 days depending upon the ground temperatures. Environmental conditions are important determinants of oocyst survival in soil and water (Frenkel et al., 1975;
Sukthana et al., 2003).
Figure 3. Toxoplasma gondii life cycle stages and transmission routes.
Additionally, humans can be infected by any of several routes including ingestion of tissue cysts or tachyzoites contained in meat, primary offal (visceral) or meat-derived products of many different mammals and birds, or the ingestion of sporulated oocysts that are contained in the environment (Tenter et al., 2000; Tenter, 2009). Blood transfusion, organ transplantation and transplacental transmission and intrauterine infection from mother to foetus are characteristical features in the life cycle of Toxoplasma (Abbasi et al., 2003).
1.8 Phylogeny of
ToxoplasmaToxoplasma gondii belongs to the Kingdom: Alveolata, Phylum: Apicomplexa, Class:
Sporozoea, Subclass: Coccidia, Order: Eucoccidia, Suborder: Eumeriina, Family:
Sarcocystidae Genus: Toxoplasma (Mehlhorn and Piekarski, 1998). T. gondii is the only species of this genus. T. gondii was first described in a North African desert rodent and is related to the organism that T. gondii was originally found in (Nicolle and Manceaux, 2009).
1.9 The LAMP principle
Loop-mediated isothermal amplification (LAMP) method is a one-step amplification reaction amplifying a target DNA sequence with high specificity, sensitivity, high efficiency and rapidity under isothermal conditions and is performed at a constant temperature (in the region of 60 °C – 65 °C) using a DNA polymerase (Bst) with strand displacement activity (Notomi et al., 2000). The mechanism of the LAMP reaction is consisting of 3 major steps, an initial step, a cycling amplification step, and an elongation step. Along with the Bst polymerase, LAMP employs two inner primers (FIP, BIP, typically length ~40 – 42 bp) and two outer primers (F3, B3 typically length
~17 -20 bp) which are able to recognize a total of 6 distinct regions within the target
DNA (Figure 4). The 6 recognised distinct sites of the target sequence are mentioned
in the figure as Forward (F) and Backward (B) and complementary (c). In detail at the
3’ end the sites F1c, F2c, F3c sites are recognised and on the 5’ end the B1, B2, B3
sites are recognised.
The role of the F3 and B3 primers is similar to the ordinary and single domain primers used for the usual PCR amplification by recognising each one of the six regions and resulting in the amplification of the entire target DNA sequence.
The Forward inner primer (FIP) are composite, double-domain primers consisting of the F2 region that is complementary to the F2c region on the target gene at the 3’
end, and the same sequence as the F1c region on the target gene at the 5’ end. The forward outer primer (F3) consists of the F3 region that is complementary to the F3c region on the target gene. Similar to the FIP primers, the backward inner primer (BIP) consists of the B2 region that is complementary to the B2c region on the target gene at the 3’ end, and the same sequence as the B1c region on the target gene at the 5’
end. The backward outer primer (B3) consists of the B3 region that is complementary to the B3c region on the target gene.
Figure 4. Schematic representation and localisation of the 6 (inner and outer) LAMP
primers on the target DNA sequence.
As mentioned in the original publication of Notomi et al. (2000), a TTTT spacer was joined between F1c and F2 sequences of FIP as well as B1c and B2 sequences of BIP primers.
Consequently, the first developed and evaluated protocols for the detection of pathogens such as African Trypanosoma species (Kuboki et al., 2003) and Toxoplasma gondii (Sotiriadou and Karanis 2008) used this spacer. The use of the spacer was optional as its presence or absence does not affect the activity of FIP and BIP primers.
Additionally, a third pair of primers named Loop primers (L) can be designed in the region between F1 and F2 sites regarding the forward loop primer (LF) and between (B1c) and (B2c) sites regarding the loop backward primer (LB). The role of the Loop primers is that they accelerate the reaction by hybridizing to the stem loops and significantly reducing the reaction time (Nagamine et al., 2002) (Figure 5).
The production of the starting structure requires the participation of all four (or 6 primers when loop primers are included) primers. The initial step of the LAMP reaction begins by the use of all four primers, but later and during the cycling reaction only the inner primers are used for strand displacement DNA synthesis. Firstly, one inner FIP (BIP) primer binds at the starting structure, producing the replicative DNA synthesis by Bst DNA polymerase. F3 (B3) primer binds immediately after the FIP (BIP) primer, displacing the newly synthesized DNA strand and releasing the target DNA. Similar and simultaneously BIP and B3 primers bind to the target DNA as mentioned in the brackets above, resulting in the formation of the single-stranded dumbbell-like starting structure with loops at both ends. By the use of Bst polymerase in the reaction mix and its displacement activity the F3 site of the target DNA sequence is replaced with the F1c, which is complementary to F1 forming the initial stem loop-loop structure.
The cycling amplification step uses this DNA construct as starting material for the
further amplification of the LAMP reaction. During the cycling amplification step only
the inner primers (FIP and BIP) are used.
Figure 5. Schematic representation and localisation of the 8 (inner, outer and loop) LAMP primers on the target DNA sequence.
The initial stem–loop DNA synthesised strand by self-primed DNA synthesis, hybridizes again with the FIP (BIP) primer and through the displacement DNA synthesis. One complementary structure of the original stem-loop DNA is yielded.
One gap repaired stem-loop DNA with a stem elongated to twice as long (double copies of the target sequence) and a loop at the opposite end yields one complementary structure of the original stem–loop DNA. The elongated products are produced by the elongation and recycling step reactions.
1.10 Bioinformatics and primer design
The construction and design of primer sets for applications such as nested PCR and
LAMP becomes a challenging approach in comparison to the trivial single primer set
for PCR. Efficacy, sensitivity and specificity of the PCR and LAMP reactions is largely
dependent on the efficiency of primers and is crucial for obtaining high-quality
sequence data for target regions. The success rate of any primer design should not only include the amplification success rate of the designed primers through computational analysis, but should also take into account the target regions that could have been covered. Potentially identifiable factors which contribute to overall success of the PCR and LAMP reactions were tried to be elucidated taking into consideration a list of criteria need to be established for target sequence analysis and primer design.
1.11 Web-based analysis of target gene sequences
Numerous web-based resources for analysis of target sequences are freely available which contain in some cases hundreds of sequences that may be targeting one gene. Free analyses of proteins and nucleic acid sequences can be performed by simple log in to the established servers and web-based interfaces (Singh and Kumar, 2001). Often such sequence resources are of variable quality, not well maintained leading to missing links and sites and probably not functional in a later date.
When scheduling important primer design it is worthwhile to evaluate sequences present in mumerous databases and consider predictions for numerous factors probably affecting the primer design when using the common sense and laboratory experience to evaluate the suggested primers before committing to their synthesis (Binas, 2000; Abd-Elsalam, 2003).
To select primer sets for the detection of Toxoplasma and Cryptosporidium species, we analysed only entries present in the National Center for Biotechnology Information (NCBI). The NCBI database is considered be a reliable resource by providing full access to biomedical and genomic information of deposited sequences database (www.ncbi.nlm.nih.gov) (Altschul et al., 1997). Table 3 demonstrates the calculated statistical significance matches of the analysis of the S-adenosyl- methionine synthetase (SAM) gene of C. parvum (GenBank accession number AY161084) against all existing Cryptosporidium SAM-sequences comparing enties present also in the DNA Data Bank of JAPAN (DDBJ), European Molecular Biology Laboratory-European Bioinformatics Institute (EBI-EMBL) and Worldwide Protein Data Bank (wwPDB).
The analysis of the target gene of Toxoplasma is presented in Table 4. The table
demonstrates the calculated statistical significances of matches and sequences
accession number AF179871) and TgOWP (GenBank accession number AY465428)
genes.
Table 3. The table demonstrates the calculated statistical significance of matches and sequences producing significant alignments.
Accession numbers marked in bold are chosen for Cryptosporidium LAMP primer design.
Accession
Number Description Query
coverage
E value
Max ident AY161084 C. parvum methionine adenosyltransferase gene, complete cds
100% 0.0 100%
XM_628434 C. parvum Iowa II s-adenosylmethionine synthetase (cgd7_2650) partial mRNA
100% 0.0 100%
XM_662396 C. hominis TU502 methionine adenosyltransferase (Chro.70301) partial mRNA
100% 0.0 98%
AB119646 C. parvum SAMs gene for methionine adenosyltransferase, complete cds, human
genotype 100% 0.0 98%
AB119647 C. parvum SAMs gene for methionine adenosyltransferase, complete cds, ferret
genotype 100% 0.0 95%
AB119648 C. meleagridis SAMs gene for methionine adenosyltransferase, complete cds
100% 0.0 95%
AB513799
Cryptosporidiumsp. skunk genotype MAT gene for methionine adenosyltransferase,
partial cds 78% 0.0 89%
AB513797
C. suis MAT gene for methionine adenosyltransferase, partial cds79% 0.0 85%
AB513796
C. canis MAT gene for methionine adenosyltransferase, partial cds80% 0.0 80%
AB513798
C. felis MAT gene for methionine adenosyltransferase, partial cds71% 4e-180 75%
XM_002141401.1
C. muris RN66 S-adenosylmethionine synthetase family protein, mRNA76% 5e-154 73%
Table 4. The table demonstrates the calculated statistical significance of matches and sequences producing significant alignments. Accession numbers marked in bold are chosen for Toxopasma LAMP primer design.
Accession
Number Description Query
coverage E value
Max ident AY465428 T. gondii putative oocyst wall protein
COWP mRNA, complete cds 100% 0.0 100%
XM_002367673 T. gondii ME49 oocyst wall protein COWP,
putative, mRNA 99% 0.0 99%
EU851867 T. gondii oocyst wall protein-1 (OWP-1)
mRNA, complete cds 99% 0.0 99%
FR823388 Neospora caninum Liverpool complete
genome, chromosome VIIa 24% 2e-10
786%
1.12 Criteria and key factors in the LAMP primer design
The LAMP primer design software Primer Explorer V4 (http://primerexplorer.jp) was used to design the primer set for the detection of Toxoplasma and Cryptosporidium species. We advocated the adoption of standardized criteria for primer selection within our laboratory.
1.12.1 Melting temperature (Tm) of the primers
The nearest-Neighbor method is automatically integrated and used in the Primer Explorer V4 for the estimation of the Tm, which approximates the value closest to the actual value. Tm can be affected by the salt and oligo concentration and was designed to be for each region about 65 °C (64 – 66 °C) for F1c and B1c, about 60
°C (59 – 61 °C) for F2, B2, F3, and B3, and about 60 °C for the loop primers.
1.12.2 Stability of the end of the primers
A certain degree of stability is essential for less false priming since the end of the primers serves as the starting point of the DNA synthesis and thus must have a certain degree of stability. The 3’ ends of F2/B2, F3/B3, and LF/LB and the 5’ end of F1c/B1c are designed so that the free energy is –4 kcal/ mol or less. The 5’ end of F1c after amplification corresponds to the 3’ end of F1, so that stability is important.
∆G is the free energy of the primer and measures the spontaneity of the reaction.
The annealing between the primer and the target gene is an equilibrium reaction, and the annealing reaction proceeds with a smaller ∆G.
1.12.3 GC% primer content
GC% is the percentage of G and C in the primer and is calculated by dividing the sum of G and C with the total number of bases present in the primer. The GC-pair is bound by three hydrogen bonds, DNA with high GC-content is more stable than DNA with low GC-content; however, the hydrogen bonds do not stabilize the DNA significantly, and stabilization is due mainly to stacking interactions (Yakovchuk et al., 2006).
PCR primers should maintain a reasonable GC-content and Tm should be well matched. Poorly matched primer pairs with less similar physical characteristics can be less efficient and specific because loss of specificity arises with a greater chance of mispriming under these conditions (Dieffenbach et al., 1993). Primers with a GC content between 45% and 60% tend to give relatively good primers, while primers ending in a G or C, or CG or GC (3') prevent "breathing" of ends and increase efficiency of priming.
1.12.4 Formation of secondary structures
The presence of primer secondary structures produced by inter- or intramolecular interactions can lead to poor or no yield of the product and greatly reduces the availability of primers to the reaction. It is significant that the inner primers are so designed that they do not form secondary structures, because they adversely affect primer template annealing and thus the amplification.
Formed hairpins are usually the result of the intramolecular interaction within the
primer and often occurs when complementary (palindromic) sites leading to the fold
A primer self-dimer formation is characterised by the intermolecular interaction between the two (same sense) primers, where the primer is homologous and anneal to itself or to other primers (primer dimer formation) used in the LAMP reaction.
Generally a large amount of primers are used in LAMP compared to the amount of target gene. When primers form intermolecular dimers much more readily than hybridizing to target DNA, they produce mispriming and reduce the product yield.
To prevent the formation of secondary structures, it is also important to ensure that the 3’ ends are not complementary and the presence of G or C bases within the last five bases from the 3' end of primers (GC-clamp) helps promote specific binding at the 3' end due to the stronger binding of G and C bases. More than 3 G's or C's should be avoided in the last 5 bases at the 3' end of the primer.
1.12.5 Improved specificity of the primers
The improved specificity of the primers often relates to the fact that the primers are chosen and designed to a unique target region within the DNA template. Regions of homology must be avoided and primers designed for a sequence must not amplify other genes in the mixture.
1.13 The investigated gene for the development of the LAMP technique for the detection of Cryptosporidium
SAM is an enzyme present in all living organisms and was reported to play central
role in biological methylation and was directly linked to polyamine metabolism. SAM
enzyme catalyses the synthesis of S-adenosyl-methionine from L-methionine and
adenosine triphosphate (ATP) (Catoni, 1953). Cellular organisms use SAM in many
transmethylation reactions as it acts as a methyl group donor important in the cell
metabolism (Lu, 2000; Tabor and Tabor, 1985). C. parvum was identified as a single
copy, AT-rich (61.8%) and intronless gene consisting of 1221 bp and encoding a
polypeptide of 406 amino acids with a molecular mass of 44.8 kDa (Slapeta et al.,
2003). The differential expression of C. parvum in infected HCT-8 cell cultures over
72 h was assayed and the results indicated that SAM is a differentially expressed
gene throughout the life cycle of C. parvum. The strongest expression as measured
by RT-PCR occured at 6 h post infection and 24-48 h post infection. The biphasic
character of the expression correlated with the late trophozoite development and
transformation to early meronts at 6 h post infection, followed by the first generation of merozoites at 12 h post infection and with the late meront development into gametocytes, to yield the sexual part of the life cycle. In both time points C. parvum undergoes morphological changes that require S-adenosylmethionine production to yield methylation and polyamine synthesis (Slapeta et al., 2003). The SAM amino acid sequence of C. parvum shares conserved and essential domains with homologs from other organs and is phylogenetically related to other cytosolic eukaryotic and prokaryotic organisms, but distinct from homologues in plants, fungi, mammals and eubacteria (Slapeta et al., 2003).
1.14 The investigated genes for the development of the LAMP technique for the detection of Toxoplasma
The sequence of the B1 gene and its copy number was determined by comparative hybridization using a titration of plasmid DNA (Burg et al., 1989). Because of its repetitive nature, the B1 gene is an attractive target for detecting T. gondii parasites through amplification of B1-specific DNA. The same authors performed quantitative Southern blot analysis and the autoradiograph showed that the B1 gene was between 25- and 50-fold repetitive. By quantitation of the radioactivity present in each band they indicated more precisely that there are about 35 copies of the B1 gene in the T. gondii genome. For the realisation of our approaches, we utilised the complete sequence deposited in the gene bank under the GenBank accession number AF179871.
Templeton et al. (2004) screened first the Cryptosporidium database, resulting in the identification of eight additional genes encoding similar arrays of cysteine-rich type I and/or type II domains. The authors showed that all eight Cryptosporidium COWP (Cryptosporidium Oocyst Wall Protein) genes were abundantly expressed at a time when developing oocysts are observed, approximately 48 to 72 h after inoculation of
in vitro cultures. The hypothesis that multiple COWPs play a role in the oocyst wall structure was supported. Subsequently Templeton et al. screened by BLAST the T.
gondii genome sequence database, which resulted in identification of a gene
encoding at least one COWP homolog (TgOWP1), and this multiexon sequence
information was used to isolate a full-length cDNA.
1.15 Selection and comparison of sequences for primer design
The selection of sequences for primer design for the Crytosporidium SAM gene were firstly subject to discovery of phylogenetically related organisms expressing the SAM gene. Template sequences of C. parvum were compared by BLAST against the appropriate non-redundant databases and the software interpreted the results. Such phylogenetically related organisms were found to be Homo sapiens, Entamoeba, Giardia, Toxoplasma and Plasmodium. Sequences of Isospora, Cyclospora, Hammondia, Cystoisospora, Sarcocystis and Neospora were not deposited in the GenBank so far (Table 5).
Table 5. Organisms analysed against the concrete target region for primer design of the SAM gene (217 bp) of Cryptosporidium parvum (GenBank accession number AY161084).
Organism
Gen Bank Accession
Number
Aligment similarity score in
EMBL-EBI database (%)
Aligment similarity score
GenomeNet (%)
Homo sapiens
NM_005911 86 63
Toxoplasma gondii
XM_002366647 83 59
Plasmodium
falciparum
AF097923 82 68
Entamoeba dispar
XM_001738614 82 70
Entamoeba
hystolitica
XM_001913755 81 70
Entamoeba
histolytica
XM_647762 81 70
Giardia lamblia
XM_001704282 76 59
Isospora
- -
Cyclospora
- -
Hammondia
- -
Cystoisospora
- -
Sarcocystis
- -
Neospora
- -
Two freely available databases and their bioinformatic services were used for the computational analysis and aligment of the interested gene sequences by the ClustalW (Thompson et al., 1994): the European Bioinformatics Institute operated from the EBI-EMBL (www.ebi.ac.uk/Tools/msa/clustalw2/) and GenomeNet operated by the Kyoto University Bioinformatics Center (www.genome.jp/tools/clustalw/).
For primer design the area between the nucleotides 725 and 940 was chosen, representing an identity of 95-100% among Cryptosporidium SAM sequences but with 59%-86% identity with human and other organisms listed in Table 5. The sequence of C. parvum (GenBank accession number AY161084) and the LAMP primer design software Primer Explorer V4 (http://primerexplorer.jp/e/) were used to design the primer set.
A similar analysis strategy was applied for the development of the LAMP technique for the detection of Toxoplasma. The analysis of the selected sequences for the LAMP development of the T. gondii B1 and TgOWP showed that both genes are selective genes and only a part (24%) of the B1 gene is preservative in Neospora caninum.
Figure 6. Schematic representation and localisation of the LAMP primers on the
target DNA sequence for A) C. parvum (GenBank accession number
AY161084) designed within the SAM gene, B) Toxoplasma gondii
GenBank accession number AF179871) within the B1 gene and C)
Toxoplasma gondii (GenBank accession number AY465428) within the
TgOWP gene. Recognition sequences of the primers are shown in red
color and degenerate primers are mentioned with yellow color. Right
arrows indicate that a sense sequence is used for primer design and left
arrows indicate the usage of complementary sequence.
A. Cryptosporidium parvum SAM gene (GenBank accession number AY161084) F3