In Vivo Analysis of Parvins,
A Family of Focal Adhesion Proteins
INAUGURAL-DISSERTATION zur
Erlangung des Doktorgrades
der Mathematisch-Naturwissenchaftlichen Fakultät der Universität zu Köln
Vorgelegt von
Haiyan Chu
Aus Jiangsu, China
Köln, Februar 2005
Referees/Berichtererstatter Prof. Dr. Angelika Anna Noegel Prof. Dr. Jens Brüning
Date of oral examination/ 03.05.2005 Tag der mündlichen Prüfung
The present research work was carried out under the supervision of Prof. Dr. Angelika Anna Noegel at the University of Cologne and the direction of Prof. Dr. Reinhard Fässler in the Max Planck Institute of Biochemistry, Martinsried, Germany, from January 2002 to January 2005.
Diese Arbeit wurde von Januar 2002 bis Januar 2005 unter der Betreuung von Frau Prof. Dr.
Angelika Anna Noegel, Universität Köln und der Leitung von Herrn Prof. Dr. Reinhard Fässler am Max-Planck-Institut für Biochemie, Martinsried, Deutschland durchgeführt.
Table of Contents………..………...…….1-4 List of abbreviations………..……….…….…..5-6
1 Introduction……….……7-17 1.1 Cell-matrix adhesion ………..…7-8 1.2 ILK, PINCH, parvin and IPP ternary complexes………...8-15
1.2.1 ILK………..…….8-9
1.2.2 PINCH………...10
1.2.3 Parvin family………10-13
1.2.4 The cellular functions of IPP complexes………..……13-15 1.3 Hematopoiesis and the immune response………..15-17 1.4 Aim of the thesis………..……..…17
(5 Figures: Figure 1-1to 1-5)
2 Materials and Methods……….……….…………...18-32 2.1 Construction of targeting vectors…..………..18-21 2.1.1 Plasmid DNA miniprep and maxiprep, PAC screening and maxiprep ………..18 2.1.2 Preparation of chemically competent cells……….…19 2.1.3 DNA digestion and purification………..19 2.1.4 DNA linkers, phosphorylation and annealing of oligonucleotides ………...19-20 2.1.5 DNA ligation and competent cell transformation………...20 2.1.6 Southern analysis and colony hybridisation………..…20-21
2.1.7 DNA sequencing……….21
2.2 Generation of knockout mice………...21-25 2.2.1 Preparation of feeder cell line……….21
2.2.2 ES cell culture……….……22
2.2.3 Linearization of targeting vector………..………...22 2.2.4 Electroporation of targeting DNA into ES cells………22-23 2.2.5 Selection and picking of G-418 positive ES clones………23 2.2.6 Identification of recombinant ES clones………...23-24 2.2.7 Generation of chimeric mice and breeding scheme………24
2.2.8 Mice genotyping………....24-25
2.3.1 Generation and purification of peptide antibodies………..…25 2.3.2 Peptide blocking experiment……….…25-26
2.3.3 Western analysis………...26
2.3.4 Immunoprecipitation……….…26-27
2.3.5 DNA mutagenesis and in vitro translation...27 2.3.6 Northern analysis and RT-PCR……….27-28
2.3.7 DNA transfection………..………….28-29
2.3.8 Immunofluorescence staining of cultured cells………...29 2.3.9 Immunostaining of tissue sections……….……….29 2.3.10 Magnetic cell sorting ……….…29-30 2.3.11 Generation of BM-derived dendritic cells and macrophages………..…30 2.3.12 Flow cell cytometry analysis (FACS)………30-31
2.3.13 Immunization……….…31-32
2.4 Reagents and antibodies……….…….…..32
2.5 Statistics………..32
3 Results………..………33-75
3.1 Generation and characterization of parvin peptide polyclonal
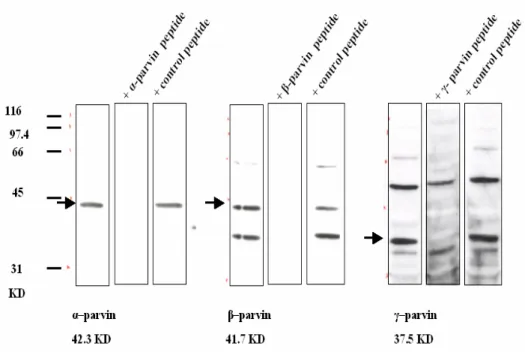
antibodies………33-39 3.1.1 Generation of α-, β- and γ-parvin peptide antibodies………..33 3.1.2 Characterization of α-, β- and γ-parvin peptide antibodies……….33-39
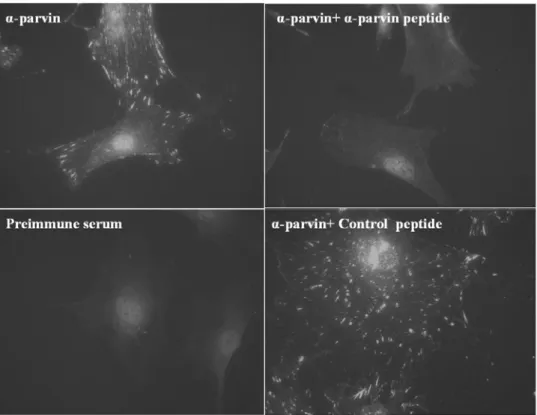
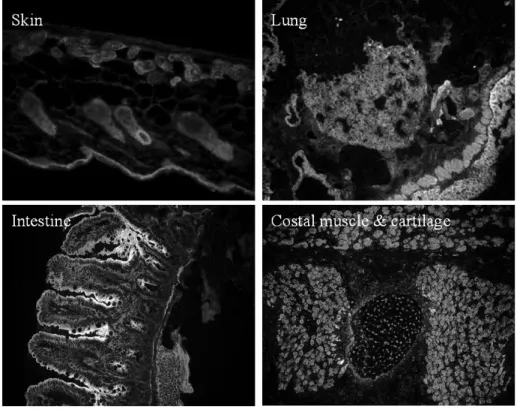
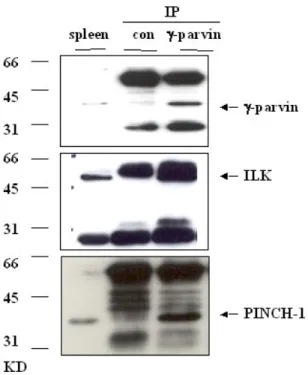
3.1.2.1 α-, β- and γ-parvin antibodies specifically work on Western blot…………33-35 3.1.2.2 α-parvin antibody works on cell immunostaining………35-36 3.1.2.3 α-parvin antibody works on tissue immunostaining……….36-37 3.1.2.4 α- and γ-parvin antibodies work for immunoprecipitation………...37-38
3.1.3 Summary………..………...38-39
(8 Figures: Figure 3.1-1 to 3.1-8; 1 Table: Table 3.1-1)
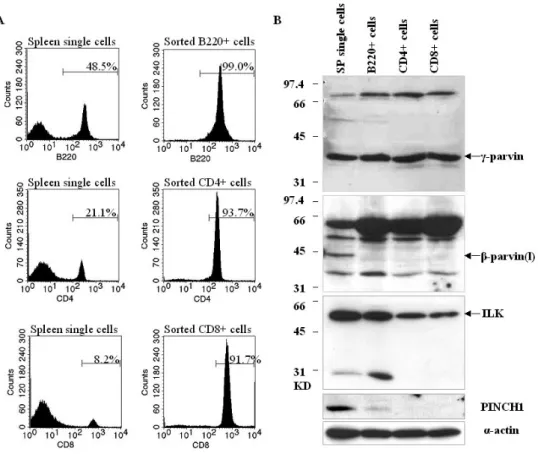
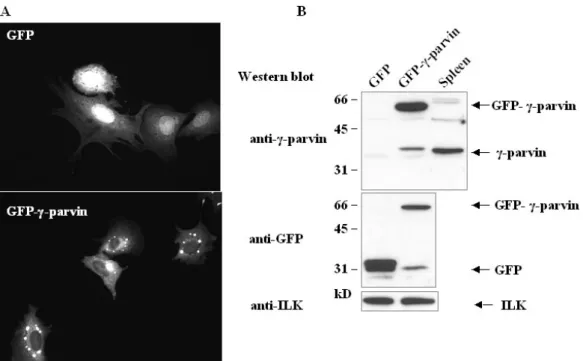
3.2 In vivo analysis of γ-parvin……….………..40-63 3.2.1 γ-parvin is expressed in lymphatic tissues, specifically in B cells,
T cells, dendritic cells and macrophages……….………40-43 3.2.2 γ-parvin forms complexes with ILK and PINCH1……….………..43 3.2.3 Subcellular localization of γ-parvin in fibroblasts………...43-46 3.2.4 Generation of γ-parvin knockout mice………....46-53
3.2.4.2 Construction of γ-parvin targeting vector..….……….49-52 3.2.4.3 Genotyping strategy for γ-parvin………..52 3.2.4.4 Generation of γ-parvin chimeric mice……….52-53 3.2.4.5 Gene deletion of γ-parvin………..53 3.2.5 Phenotypic analysis of γ-parvin null mice……….54-63
3.2.5.1 γ-parvin null mice are viable and fertile and
show normal Mendelian distribution ………..……….54 3.2.5.2 ILK and PINCH1 are downregulated in γ-parvin
null hematopoietic cells………...54-56 3.2.5.3 γ-parvin null mice exhibit normal architecture of lymphoid organs………56-58 3.2.5.4 γ-parvin mice show normal hematopoiesis………...….………..……59-61 3.2.5.5 γ-parvin null dendritic cells can mature normally in vitro………...61-62 3.2.5.6 γ-parvin null mice display normal T-cell dependent antibody
response.………..62-63
(19 Figures: Figure 3.2-1 to 3.2-19; 1 Table: Table 3.2-1)
3.3 In vivo analysis of α-parvin……….…….…64-75
3.3.1 α-parvin exon 2 deletion……….64-70 3.3.1.1 α-parvin knockout strategy………..………..64 3.3.1.2 Construction of α-parvin targeting vector ………...64-67 3.3.1.3 Genotyping strategy of wildtype and recombinant alleles…………..…...….67 3.3.1.4 Generation of α-parvin chimeric mice………...…..67-68 3.3.1.5 Exon 2 deletion of α-parvin ………...68-70 3.3.2 Preliminary phenotypic analysis of α-parvin exon 2 deletion mice……….…..70-72 3.3.2.1 α-parvin exon 2 deletion mice are smaller………...70-71 3.3.2.2 α-parvin exon 2 deletion protein can localize to FA………....71-72 3.3.3 Generation of α-parvin null mice………...72-74 3.3.4 α-parvin null mice are embryonic lethal……….75
(13 Figures: Figure 3.3-1 to 3.3-13; 1 Table: Table 3.3-1)
4 Discussions and perspectives………...76-85 4.1 Parvin peptide antibodies………76-77 4.2 Expression profile of parvins and their associated proteins
ILK and PINCH1 in the hematopoietic system……….77-78
4.4 ILK-PINCH-parvin complexes………...79-80 4.5 γ-parvin is dispensable for normal hematopoiesis……….80-81 4.6 γ-parvin is dispensable for T-cell dependent antibody response...………81-82 4.7 α-parvin is critical for mouse embryo development………..82-83 4.8 Intact α-parvin is indispensable for normal embryo development………..83-84 4.9 Distinct roles of parvin paralogues………..84-85
5 Summary/Zusammenfassung………...86-88 6 Acknowledgements……….…89 7 References list ………...90-95 Statement/Erklärung………...96 Curriculum Vitae/Lebenslauf………...…....97-98
aa, amino acid(s) bp, base pairs BM, bone marrow
BSA, bovine serum albumin cDNA, complementary DNA DC, dendritic cell
DEPC, diethylpyrocarbonate
DMEM, Dulbecco’s modified eagle media DTT, dithiothreitol
ECM, extracellular matrix
EDTA, ethylenediaminetetraacetic acid ELISA, enzyme-linked immunosorbent assay ERK, extracellular signal–regulated kinase ES cell, embryonic stem cell
EST, expressed sequence tag FA, focal adhesion site(s) F-actin, filamentous actin FAK, focal adhesion kinase FBS, fetal bovine serum
FITC, fluorescein isothiocyanate, g, gram
GAPDH, glyceraldehyde 3-phosphate dehydrogenase GM-CSF, granulocyte/macrophage colony-stimulating factor GSK-3β, glycogen synthase kinase-3β
h, hour
HRP, horseradish peroxidase Ig, immunoglobulin
IGF, insulin-like growth factor ILK, integrin-linked kinase
IPP complexes, ILK-PINCH-parvin complexes kb, kilobase(s)
KLH, keyhole limpet hemocyanin
LIM, lin-11, isl-1, mec-3 LN, lymph node
LPS, lipopolysaccharide M, molar
M-CSF, macrophage colony-stimulating factor
MEKK1, mitogen-activated protein/extracellular signal-regulated kinase kinase 1 min, minute
NP-CG, nitrophenyl-chicken gamma globulin PAC, P1-derived artificial chromosome
PAGE, polyacrylamide gel electrophoresis α-parvin, α-parvin/actopaxin/CH-ILKBP β-parvin, β-parvin/affixin;
PAT, Paralysed Arrested elongation at Two-fold PALS, periarteriolar lymphoid sheath
PAS/AGM, para-aortic splanchnopleura/aorta-gonad mesonephros region PBS, phosphate-buffered saline
PCR, polymerase chain reaction PDGF, platelet-derived growth factor PI3K, phosphatidylinositol-3 kinase
PINCH, particularly interesting new cysteine-histidine rich protein PIP3, phosphatidylinositol 3,4,5-triphosphate
α-PIX, Pak-interacting exchange factor, also called Cool2 (cloned out of library) PKB/AKT, protein kinase B/AKT
PP, Peyer’s patches
PMSF, phenylmethylsulfonyl fluoride RNase, ribonuclease
RT, room temperature
RT-PCR, reverse transciption-polymerase chain reaction s, seconds(s)
SDS, sodium dodecyl sulfate
Tris, tris(hydroxymethyl)aminomethane
1. Introduction
Integrins are the major cellular receptors for cell adhesion to extracellular matrix (ECM) proteins and are also important for cell-cell adhesions. Integrin mediated signaling regulates many aspects of cell behaviour.
1.1 Cell-matrix adhesion
Cell interactions with ECM (e.g., fibronectin, vitronectin and various collagens) are mediated by transmembrane cell adhesion receptors. Cell-ECM adhesions are crucial for various biological processes, including cell adhesion, migration, proliferation, differentiation, cell survival and they contribute to embryogenesis, wound healing, and inflammation (Hynes, 2002; Lee and Juliano, 2004). The adhesions with the ECM are mainly mediated by integrins, which connect the ECM to the actin cytoskeleton at the cell interior. Cell adhesion leads to integrin clustering and formation of classical focal adhesions and variants (focal complexes, fibrillar adhesions and podosomes) (Geiger et al., 2001).
Focal adhesions (FAs) are flat and elongated cellular structures that localize near the periphery of the cell. FAs mediate strong cell adhesion to the substrate and anchor bundles of actin microfilaments through a plaque containing many FA associated molecules (Geiger et al., 2001). FA associated proteins include cytoskeletal proteins (e.g. talin, tensin, vinculin, paxillin, α-actinin and α/β-parvin), signalling molecules such as tyrosine kinases (e.g. Src, FAK, PYK2, Csk), serine/threonine kinases (e.g. ILK, PKC, PAK), modulators of small GTPases and other enzymes (PI3 kinase). FA associated proteins can bind to integrins (e.g ILK, FAK) or actin (e.g. α-parvin, vinculin) and thereby link integrins to the cytoskeleton. Some proteins can directly act as integrin-actin linkers (e.g. talin, familin, α- actinin). Many adaptor proteins interact with integrin-bound and actin-bound components (e.g. PINCH) to link them to each other (Zamir and Geiger, 2001).
FAs serve two significant functions. First they act as an ECM-actin cytoskeleton connection to transmit force or tension at adhesion sites to maintain strong attachments to the underlying ECM. Second, they function as a signalling center (Sastry and Burridge, 2000). The core components of FAs are integrins. Each integrin consists of two transmembrane subunits, called α and β subunits. Integrin engagement leads to the recruitment and activation of signalling proteins such as FAK (Miranti and Brugge, 2002;
Playford and Schaller, 2004). Phosphorylation of FAK recruits SH2-containing proteins including Src and Fyn and subsequently a variety of proteins that transduce signals to many
downstream pathways (Cary et al., 1998; Roy et al., 2002; Webb et al., 2004). Rho GTPases control signal transduction pathways that link cell surface receptors to a variety of intracellular responses, although they do not interact with integrin directly (Guo and Giancotti, 2004).
1.2 ILK, PINCH, parvin and IPP ternary complexes
ILK, PINCH and parvin are multidomain proteins that are widely expressed in human and mouse tissues, and are well conserved in evolution (Zhang et al., 2002; Wu, 2004). ILK binds PINCH and parvin and ILK-PINCH-parvin form ternary complexes (IPP complexes;
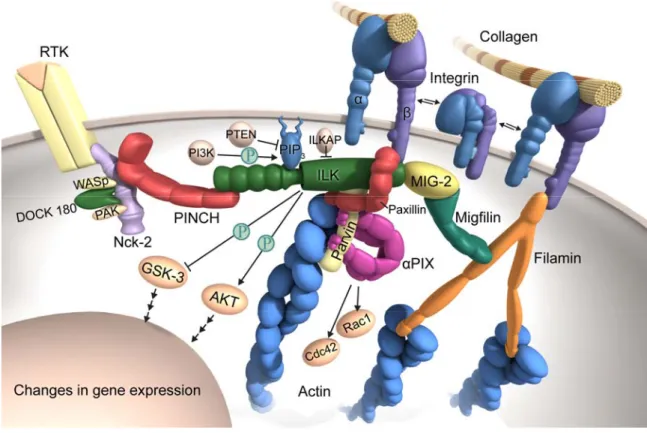
Tu, et al., 2001; Wu, 2001; Wu 2004). The complexes act as structural and functional linkers between ECM and the actin cytoskeleton through integrin-binding ILK and actin- binding- parvin proteins (Figure 1-1).
Figure 1-1 ILK-PINCH-parvin complexes localize to focal adhesion sites through the interaction of ILK with the β1 or β3 integrin tail. The activation of ILK by PI3K leads to the phosphorylation of PKB/Akt and GSK3β (from Grashoff et al., 2004).
1.2.1 ILK
ILK was discovered as a serine/threonine protein kinase that interacts with the cytoplasmic tails of β1 and β3 integrins (Hannigan et al., 1996). ILK is composed of three conserved domains (Figure 1-2). The N-terminal domain contains four ankyrin repeats that bind to the LIM protein PINCH (Tu et al., 1999) and interact with ILKAP, a PP2C phosphatase that negatively regulates ILK kinase activity (Leung-Hagesteijn et al., 2001). The pleckstrin homology (PH)-like motif of ILK binds PIP3, the product of PI3K (Huang and Wu, 1999).
The C-terminal kinase catalytic domain of ILK binds to paxillin and the CH2 domains of α- and β-parvins leading to the FA localization of parvins (Wu and Dedhar, 2001, Tu et al., 2001; Yamaji et al., 2001). Additionally, Pat-4, ILK homologue in C. elegans, binds to UNC-112, which in turn binds to filamin-binding protein migfilin. UNC-112 is essential for localization of Pat4/ILK to integrin-containing muscle attachment sites (Mackinnon et al., 2002; Tu et al., 2003).
Figure 1-2 Functional domains of ILK and its binding partners. There are four ANK repeats at the N- terminus of ILK and the first ANK repeat mediates the binding to PINCH1/PINCH2. The PH motif binds PIP3. The C-terminal kinase domain binds to α-/ β-parvins. Integrin β1 binds to the C-terminus of ILK. A paxillin binding site (PBS) lies in the C-terminus of ILK and is important for paxillin binding.
The kinase activity of ILK was shown by its ability to phosphorylate peptides and model substrate myelin basic protein in vitro (Hannigan et al., 1996), and to induce phosphorylation of the protein kinases PKB/Akt at Ser473 and GSK-3β at Ser9 in cells overexpressing ILK (Delcommenne et al., 1998). PKB/Akt is a Ser/Thr kinase implicated in cell proliferation and growth factor signaling and is a key signalling intermediate in the survival pathway (Lawlor and Alessi, 2001; Cantley, 2002). GSK-3β is inactivated by phosphorylation mediated by ILK (Delcommenne et al., 1998; Cohen and Frame, 2001).
However, recently it was shown that the kinase activity of ILK is not required for PKB/Akt and GSK-3β signaling in several vertebrate cell types nor is it necessary for invertebrate development. As the defects in ILK null flies and worms could be fully rescued with ILK mutants that lacked kinase activity (Zervas et al., 2001; Mackinnon et al., 2002).
Furthermore, ILK-null fibroblastoid cell lines and ILK-null chondrocytes have severe
adhesion and proliferation defects but normal phosphorylation of PKB/Akt and GSK-3β (Sakai et al., 2003; Grashoff et al., 2003).
Several adaptor proteins such as PINCH and parvin that bind ILK directly or indirectly, regulate the actin cytoskeleton (Brakebusch and Fässler, 2003).
1.2.2 PINCH
PINCHs are LIM-only adapter proteins. There are two PINCH proteins, PINCH1 and PINCH2 in mammals and they are encoded by different genes and share significant sequence similarity (Zhang et al., 2002a; Braun et al., 2003). PINCH binds to the first N- terminal ANK repeat domain of ILK through the LIM1 domain and links cell-adhesion mediated integrin signalling to growth factor receptors via an interaction with Nck-2 (Tu at al., 1999; Figure 1-3). Nck-2 interacts with growth factor receptor tyrosine kinases such as epidermal growth factor receptor (EGFR) or platelet-derived growth factor receptor (PDGFR), and recruits a large number of proteins including actin modulators such as Dock180 and the p21-activated kinase (PAK) (Velyvis et al., 2003). The interaction of ILK with PINCH plays a crucial role in the regulation of cell shape and migration (Tu et al., 1999; Zhang et al., 2002b).
Figure 1-3 The domain structure of PINCHs and their binding partners. PINCHs are 37kD proteins that contain five LIM domains. The LIM domain is a cysteine-rich protein binding motif consisting of around 50 amino acids which can fold into two-zinc fingers. PINCH binds to ILK through its LIM1 domain and the LIM4 mediates binding to Nck-2.
1.2.3 Parvin family
The founding member of the parvin family, α-parvin, also known as CH-ILKBP/actopaxin, was identified independently in several laboratories (Nikolopoulos and Turner, 2000; Olski et al., 2001; Tu et al., 2001). Subsequently two other paralogues of α-parvin, β-parvin (affixin) and γ-parvin, were also identified (Olski et al., 2001; Yamaji et al., 2001).
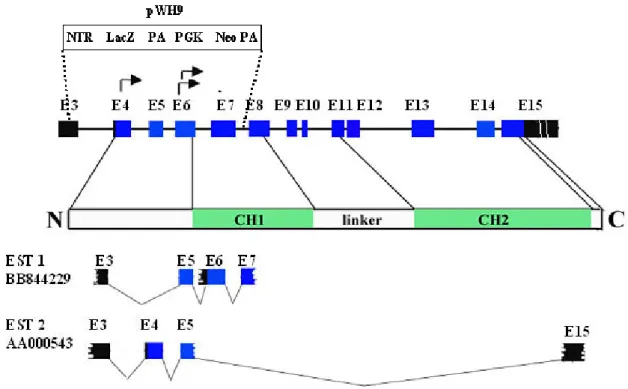
Mammalian α-, β- and γ-parvins are encoded by different genes. The mouse α-parvin gene is located on chromosome 7. β-parvin is located on chromosome 15 and γ-parvin is also present on chromosome 15 around 12 kb downstream of β-parvin. Mouse parvin genes
show similar gene structures as those found in humans (Table 3.2-1; Olski et al., 2001). β- and γ-parvin likely diverged from a common ancestral gene as lower organisms including C.elegans and D. melanogaster only have a single α-parvin-like gene (Olski et al., 2001;
Tu et al., 2001; Yamaji et al., 2001; Lin et al., 2003).
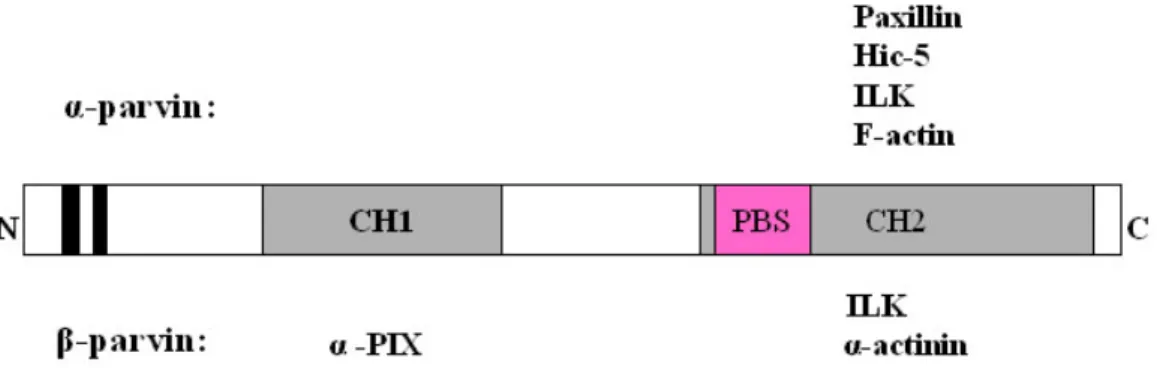
Parvins are composed of a single actin-binding domain (ABD) preceded by an N- terminal stretch (Figure 1-4). The ABD contains two calponin homology (CH) domains in tandem. The N-termini of α- and β-parvins contain two putative nuclear localization signals (NLSs) and three potential SH3-binding sites (Olski et al., 2001). α-parvin contains a paxillin binding site (PBS) within the CH2 domain, which is important for binding to both paxillin and ILK (Olski et al., 2001; Nikolopoulos and Turner, 2002).
Parvins are highly conserved between human and mouse. Mouse α-parvin is a 42.1 kD protein composed of 372 amino acids (aa), sharing 98.9% identity with human α-parvin at the amino acid level. Human and mouse β-parvins share high homology to α-parvin. Human and mouse γ-parvins are composed of 331 amino acids and are more distantly related to α- parvin (Olski et al., 2001).
Figure 1-4 Schematic representation of the domain structure of α- and β-parvin and their binding partners. There are two putative NLSs (black boxes) at the N-termini of the proteins. A paxillin binding site (PBS; 273-290) (purple box) locates in the CH2 domain of α-parvin. γ-parvin has similar protein structure with a shorter N-terminus and lacks the NLSs.
In human and mouse there are single α-parvin proteins (Nikolopoulos and Turner, 2000; Olski et al., 2001; Tu et al., 2001). There are four β-parvin isoforms expressed in humans arising from alternative splicing or alternate initiation sites, called CLINT (397 aa), β-parvin(l) (365 aa), β-parvin(s) (351 aa) and β-parvin(ss) (314 aa), in order of decreasing length (Yamaji et al., 2001; Mongroo et al., 2004). CLINT is only found in human. The N- terminal sequence of CLINT arises from two unique 5’ exons (Mongroo et al., 2004). The three shorter β-parvin isoforms, β-parvin(l), β-parvin(s) and β-parvin(ss), are generated by different promoter usage (Yamaji et al., 2001). α-parvin is widely expressed (Nikolopoulos
and Turner, 2000; Olski et al., 2001; Tu et al., 2001; Yamaji et al., 2001). β-parvin is also widely expressed with higher expression levels in heart and skeletal muscles (Yamaji et al., 2001) and β-parvin(ss) is the major isoform in spleen tissue and in platelets (Yamaji et al., 2002). γ-parvin seems to be predominantly expressed in lymphoid organs (Korenbaum et al., 2001).
α-parvin directly binds to F-actin, paxillin, Hic-5 (hydrogen peroxide-inducible clone- 5), and ILK (Nikolopoulos and Turner, 2000; Olski et al., 2001; Tu et al., 2001). β-Parvin directly binds to ILK, α-actinin and α-PIX (Yamaji et al., 2001; Rosenberger et al., 2003;
Yamaji et al., 2004; Mishima et al., 2004). α-PIX activates Rac and Cdc42 and has been implicated in X-linked non-specific mental retardation (Kutsche et al., 2000). β-Parvin probably binds F-actin although this has never been shown directly (Yamaji et al., 2001;
Brakebusch and Fässler, 2003). No γ-parvin binding partners have been identified so far.
Figure 1-5 Domain structure and binding partners of paxillin. Paxillin is composed of N-terminal leucine-rich LD motifs and C-terminal LIM domains that mediate protein-protein interaction. Paxillin binding partners include structural proteins (parvin, vinculin, tubulin) and signalling molecules (FAK, PTP-PEST) (Brown and Turner, 2004).
Paxillin is a multidomain protein that localizes to FAs and functions as a molecular adaptor or scaffold protein that provides multiple docking sites at the plasma membrane and is involved in the integration of growth factor- and adhesion-mediated signaltransduction pathways (Turner 2000; Figure 1-5). While most integrin-associated proteins interact with the cytoplasmic tails of β integrins, paxillin interacts with α integrins α4 and α9 (Liu et al., 2001; 2002). Paxillin LD motifs bind to several proteins associated with remodelling of the actin cytoskeleton, such as α-parvin and ILK. For example, α-parvin directly binds to paxillin LD1 and LD4 motifs (Nikolopoulos and Turner, 2000). Additionally, the paxillin LD1 motif also mediatesinteractions with ILK, vinculin and the papillomavirus proteinE6 (Wood et al., 1994; Tong and Howley, 1997; Nikolopoulos and Turner, 2002). An α-parvin PBS mutant (V282G/L285R), incapable of binding paxillin in vitro, cannot target to FAs
and ectopic expression of the PBS mutant results in reduction in cell adhesion, which suggests an important role for α-parvin in integrin-dependent remodelling of the actin cytoskeleton during cell motility and cell adhesion (Nikolopoulos and Turner, 2000). Hic-5 is a LIM protein with striking similarity to paxillin that shuttles between FAs and nucleus (Shibanuma et al., 2003) and is implicated in integrin-mediated signalling through an interaction with FAK (Nishiya et al., 2001).
α-actinin consists of an N-terminal ABD containing two CH domains, a central region with four spectrin-like repeats and a C-terminal calmodulin-like domain. Two α-actinin molecules form a dimer. α-actinin binds to β integrins as well as cytoplasmic proteins including vinculin, zyxin and paladin and crosslinks actin filaments to actin bundles and networks and serves as an important scaffold protein (Otey and Carpen, 2004; Ronty et al., 2004). α-actinin binds to the β-parvin CH2 domain in an integrin mediated adhesion- dependent and in an ILK kinase activity-dependent manner (Yamaji et al., 2004). In CHO cells, β-parvin colocalizes with α-actinin and ILK at FAs and at the tip of the leading edge, whereas in skeletal muscle cells they colocalize at the sarcolemma (Yamaji et al., 2001).
α- and β-parvins bind to the C-terminal kinase domain of ILK through their CH2 domains and colocalize with ILK to FAs (Tu et al., 2001; Yamaji et al., 2001). The CH2 domain of α-parvinmediates the FA localization of the protein through its interaction with both paxillin and ILK (Nikolopoulos and Turner, 2000; Tu et al, 2001). An α-parvinpoint mutation (F271D) that inhibits ILK-binding impairs the FA localization of α-parvin(Tu et al., 2001). The α-parvin CH2 domain alone is sufficient for FA targeting and α-parvin mutants lacking the CH2 domain do not localize to FAs (Tu et al., 2001; Olski et al., 2001).
The functional interactions between ILK, α-parvin and paxillin have also been shown to be mutually important for the localization of these proteins to FAs (Nikolopoulos and Turner, 2001; Attwell et al., 2003).
Phosphorylation of α-parvin N-terminus has been implicated in the actin cytoskeleton reorganization processes, such as cell adhesion, migration and mitosis (Yamaji et al., 2001;
Curtis et al., 2002; Clark et al., 2004). The N-terminus of α-parvin contains six putative cdc2 phosphorylation sites. The first two consensus phosphorylation sites are phosphorylated by cyclin B1/cdc2 kinase during mitosis and after mitosis there is adhesion- independent dephosphorylation, which suggests that α-parvin dephosphorylation precedes cell spreading and the reformation of FAs (Curtis et al., 2002). Recently, it was shown that Erk may contribue to the cell adhesion/spreading- induced phosphorylation of the N- terminus of α-parvin and the phosphorylation regulates cell spreading and migration (Clarke
et al 2004). β-parvin can be phosphorylated on its CH2 domain by ILK in vitro, although the biological significance of the phosphorylation is not known (Yamaji et al., 2001).
1.2.4 The cellular functions of IPP complexes
Multiple IPP ternary complexes may be present in the same cell. α- and β-parvin are co- expressed in certain cell types (Zhang et al., 2004). PINCH1 and PINCH2 are also often present in the same cell (Zhang et al., 2002a). Both α- and β-parvins bind to ILK and form ternary complexes with ILK and PINCH (Tu et al., 2001; Zhang et al., 2004). The binding of α- and β-parvin to ILK is mutually exclusive. Similarly, one ILK molecule cannot bind to two PINCH molecules simultaneously (Zhang et al., 2002; Zhang et al., 2004).
IPP complexes formation is essential for their recruitment to FAs, and the complexes formation precedes the recruitment into FAs (Zhang et al., 2002c). Disruption of the IPP complexes significantly impairs cell shape modulation, cell motility and fibronectin matrix deposition (Zhang et al., 2002d; Guo and Wu, 2002). Different IPP complexes have been suggested to play distinct roles, although they may share certain common functions (Wu, 2004). Each component of the PINCH1-ILK-α-parvin complex has been shown to be important to protect cells from apoptosis (Fukuda et al., 2003a). For example, α-parvin has been shown to regulate cell survival by facilitating membrane translocation, but not the phosphorylation, of PKB/Akt. The membrane targeting of PKB/Akt is an early and obligatory step in the activation of PKB/Akt. Cells that were depleted of α-parvin by RNAi undergo extensive apoptosis despite the presence of cell-ECM contacts and soluble growth factors. While PINCH1-ILK-β-parvin complexes were suggested to play a proapoptotic role (Zhang et al., 2004). The IPP complexes stabilize the individual proteins of the complexes and the mutual dependence of the IPP components is well conserved in both mammals and invertebrates (Fukuda et al., 2003b; Lin et al., 2003).
Rho GTPases (Cdc42, Rac, and Rho) act as molecular switches to control signal transduction pathways by cycling between a GDP-bound inactive form and a GTP-bound active form and they interact with downstream targets to elicit a variety of intracellular responses, including the regulation of actin dynamics (Etienne-Manneville and Hall, 2002).
ILK, PINCH, α- and β-parvin have been shown to provide a signaling pathway that links integrin signaling to Cdc42/Rac activation. The loss of PINCH1 or ILK, significantly reduced the activation of Rac (Fukuda et al., 2003b), while loss of α-parvin, but not β- parvin, markedly stimulated Rac activation and enhanced lamellipodium formation (Zhang et al., 2004). β-parvin binds to αPIX, a Rac/Cdc42-specific guanine nucleotide exchange
factor, and they co-localize at the cell periphery to lamellipodia and ruffles in cells adhered to fibronectin (Rosenberger et al., 2003). Over-expression of the αPIX-binding β-parvin CH1 domain induced significant actin reorganization in MDCK cells by activating Cdc42/Rac, and disrupted epithelial cell polarity (Mishima et al, 2004).
In vivo genetic studies of PINCH, ILK and parvin have widened our knowledge of their functions. In invertebrates C. elegans and Drosophila, mutations in PAT-4/ILK, UNC- 97/PINCH lead to embryonic lethal with defects in dense body and M line assembly due to the disruption of the integrin–actin linkage (Hobert et al., 1999; Zervas et al., 2001;
Mackinnon et al., 2002; Clark et al., 2003). PAT-6, the parvin homologue in C. elegans, localizes to body muscle attachments, which are the analogs of focal adhesions. PAT-6 null mutant worm show similar muscle attachment defects. The proper polarization and recruitment of PAT-6/parvin to muscle attachments requires perlecan, integrin, ILK and UNC-112 (Lin et al., 2003). Loss of function of ILK has also been studied in mammals.
ILK null mice die during early embryogenesis and the ILK-null cells exhibit altered actin cytoskeleton organization, impaired cell–ECM adhesion and spreading, and reduced proliferation (Sakai et al., 2003; Grashoff et al., 2003; Terpstra et al., 2003). Thus, the cellular phenotypes induced by gene inactivation are remarkably similar to those resulting from disruption of the IPP complexes, which suggests that the formation of the IPP complexes is likely essential for many biological functions (Wu, 2004).
1.3 Hematopoiesis and the immune response
Cell-cell and cell-matrix adhesions of hematopoietic cells are important to control their migration, retention, self-renewal, and differentiation (Prosper and Verfaille, 2001).
Integrins are important cell surface receptors mediating several of these interactions. α- and β-parvins have been implicated in integrin-mediated cell-adhesion and migration (Yamaji et al., 2002; Fukuda et al., 2003b).
All blood cells derive from hematopoietic stem cells (HSC), which have the potential to self-renew and to develop the clonal precursors of all known differentiated blood cell types (Morrison et al., 1995). Hematopoiesis begins in the mouse on day 7 of gestation in the yolk sac outside the embryo proper and in the para-aortic splanchnopleura (PAS)/aorta- gonad mesonephros (AGM) region in the embryo. Around embryonic stage 8.5 (E8.5), when circulation starts, the HSC are present in the fetal blood and at E10 start to colonize the fetal liver (Weissman, 1994). Later, hematopoietic progenitors seed bone marrow (BM), thymus, spleen and other lymphoid organs.
HSC give rise to lymphoid, myeloid and erythroid precursor cells. These different lineage-committed cells express characteristic markers on their surface. In thymus, the T cell precursors are part of CD4CD8 double negative (DN) population and they do not express molecules characteristic for mature T cells like CD4, CD8 or the T cell receptor complex. During the development of B cells, the first lineage specific marker is B220 (CD45R) and this molecule is expressed at all stages through to activated B cells. B220 expression increases during differentiation. While immature B cells express medium levels B220 (B220m), mature B cells produce high amounts of B220 (B220h). CD19 is expressed from the pro B cell stage throughout B cell development. IgM is present on immature B cells after the V, D, J rearrangements of the genes of the immunoglobulin heavy and light chains. In early mature cells a change in RNA processing of the heavy-chain primary transcript leads to production of two mRNAs encoding IgM and IgD. These cells leave the BM and can be activated by their specific foreign antigen in secondary lymphoid organs, where the expression of IgD increases. Activated B cells proliferate, and differentiate into antibody-secreting plasma cells and long-lived memory cells (Janeway et al., 2001).
During the immune response, the macrophages and neutrophils of the innate immune system provide a first line of defense against pathogens. When the innate host defenses are bypassed, evaded, or overwhelmed, an adaptive immune response is required. Adaptive immunity refers to antigen-specific defense mechanisms designed to remove a specific antigen. Three major cell types participate in the acquired immue response: T cell, B cell, and antigen-presenting cells (APC), particularly dendritic cells (DC). An adaptive immune response is initiated when circulating naïve T cells encounter their corresponding antigen in secondary lymphoid tissues presented by APCs. The processed antigen is noncovalently bound to the major histocompatibility complex (MHC) class I and/or MHC class II molecules on the APC. The antigen binding to T-cell receptors (TCRs) activate the T lymphocytes, and lead to their proliferation and differentiation into effector cells. Once activated, some T cells migrate to the sites of infection and help other phagocytic cells destroy the antigen. Other T cells remain in the peripheral lymphoid organ and help B cells respond to the antigen.
Immunological memory is generated during the primary response in part because the proliferation of antigen-stimulated naïve cells creates memory cells through clonal expansion, and in part because memory cells are able to respond more sensitively and rapidly to the same antigen than naïve cells. Thus, immunologic memory in the antibody system is generated by a T-cell-dependent response and carried by long-lived memory B
cells in germinal centers of lymphoid follicles that recognize antigen by high-affinity antibodies. In the early stage of an immune response, plasma cells secrete antibody of the IgM class, while class switching may occur. Class switching occurs in mature B cells and is dependent on antigenic stimulation of the cell if antigen-activated mature B cells receive the cytokines released by activated T cells. During the second immune response, IgG antibodies appear at higher concentration, and great persistence, than IgM (Janeway et al., 2001). Mice deficient in CD40, OCA-B, and Vav1 are unable to switch isotype and can produce only IgM (Kawabe et al., 1994; Kim et al., 1996; Gulbranson-Judge et al., 1999).
1.4 Aim of the thesis
The physiological functions of mammalian parvins are unknown. The aim of my PhD project is to study the functions of parvins in vivo using parvin mutant mouse models generated by genetic approaches. The phenotypes of parvin loss-of-function mutants were analysed. This thesis mainly focuses on α- and γ-parvin.
2 Materials and Methods 2.1 Construction of targeting vectors
2.1.1 Plasmid DNA miniprep and maxiprep, PAC screening and maxiprep Plasmid DNA miniprep
Minipreps were carried out according to a modified QIAGEN® protocol as follows. A single fresh bacterial colony was picked and cultured in 2 ml LB medium (1L: 10g NaCl, 10g tryptone peptone, 5g yeast extract) containing appropriate antibiotic (ampicillin 100µg/ml or kanamycin 25µg/ml or chloramphenicol 25µg/ml) at 37°C overnight with vigorous shaking. The next morning, bacteria were harvested and the pellet was rsuspended in 200 µl buffer P1 (50mM Tris.HCl, pH 8.0; 10mM EDTA) with 100µg/ml RNase. The bacteria pellet was lysed in 200µl buffer P2 (200 mM NaOH, 1%SDS) and incubated for 5 min at RT. The lysate was neutralized with 200µl chilled buffer P3 (3.0 M potassium acetate, pH5.5) on ice for 5 min and centrifuged for 5 min at 13000 rpm in a tabletop microcentrifuge. The supernatant was taken out and mixed with an equal volume of isopropanol to precipitate DNA. DNA was collected by centrifugation at 13000 rpm for 5 min and the pellet was washed with 400 µl 70% ethanol and air-dried. DNA pellet was dissolved in 50-100µl H2O.
Plasmid DNA maxiprep
Plasmid DNA was prepared using the QIAGEN®plasmid maxiprep kit according to the procedure described by the manufacturer.
PAC screening and maxiprep
129/Sv mouse PAC(P1-derived artificial chromosome) library RPCI21 (from the Human Genome Mapping Project Center, Cambridge, United Kingdom, 10 membranes) was hybridised with mouse α-, β- and γ-parvin cDNA probes derived from EST clones (from I.M.A.G.E, UK-HGRP RC) to screen parvin genomic containing clones. The hybridisation procedures were followed as Materials and Methods 2.1.6. Five positive PAC clones were ordered for each parvin gene.
A single fresh bacterial colony was cultured in 500 ml LB medium at 37°C with antibiotic overnight. Bacterial cells were harvested by centrifugation at 6000 x g for 15 min at 4oC. The pellet was resuspended in 10 ml buffer P1 and lysed with 10 ml buffer P2 and incubated at RT for 5 min. The lysate was incubated with 10 ml chilled buffer P3 on ice for
10 min and centrifuged at 6000 x g for 15 min. The supernatant was taken out and an equal volume of isopropanol was added and incubated at RT for 30 min to precipitate DNA. DNA was pelleted by centrifugation at 4°C for 20 min at 15000 x g and resuspended in 5 ml H2O.
Contaminant RNA was precipitated from the DNA solution by incubating the solution with 5 ml 5M LiCl on ice for 30 min followed by centrifugation at 4°C for 10 min at 20000 x g.
DNA supernatant was taken out and incubated with an equal volume of isopropanol at RT for 30 min. DNA was pelleted by centrifugation at 4°C for 20 min at 12000 rpm and washed with 70% ethanol, then resuspended in 700 µl H2O with 10 µl 10 mg/ml RNase and incubated at 37°C for 1h to remove the remaining RNA. The solution was extracted with 700 µl Phenol/chloroform and DNA was reprecipitated with 70 µl NaAc (3M, pH 5,5) and 700 µl isopropanol. The DNA pellet was washed with 70% ethanol, air-dried and dissolved in 100-200 µl H2O.
2.1.2 Preparation of chemically competent cells
Fifty microliters of competent DH5α cells were incubated in 5ml LB medium with 0.02 M MgSO4 and 0.01M KCl and cultured at 370C overnight. The next day, the 1ml overnight culture was cultured in 150ml prewarmed LB with 0.02M MgSO4/0.01M KCl and grown for around 1.75 h at 37oC until the culture reached an OD600 density of 0.3 to 0.4. The culture was kept on ice for 10 min and spun down for 10min at 6000 rpm at 40C. The pellet was resuspended in 37.5ml TFBI (25 mM KAc, 50mM MnCl2, 100 mM RbCl, and 10 mM CaCl2; pH 5.8; sterilely filtered; with sterile glycerol added to 15%) and kept on ice for 10 min before spinning down at 6000 rpm for 10 min at 40C. The pellet was resuspended in 4ml TFBII (10mM MOPS pH 7.0; 75mM CaCl2, 10mM RbCl, 15% glycerol, autoclaved) and cells were aliquoted in 50 µl or 100 µl on dry-ice/isopropanol and kept at -80oC.
2.1.3 Plasmid DNA digestion and purification
Plasmids and vectors were digested with enzymes from New England Biolab. MabI, an isoschizomer of SexAI that cleaves DNA methylated by dcm methylase C (m5)CWGG was purchased from SibEnzyme, Ltd. Digested DNA fragments were separated on an agarose gel and visualized by ultraviolet light. The DNA fragments were isolated from an agarose gel and purified with QIAquick® or QIAEX®II Gel Extraction Kit (QIAGEN) according to the procedure described by the manufacturer. Recovery of the DNA fragments was checked on an agarose gel.
2.1.4 DNA linkers and oligonuclotides phosphorylation and annealing
SalI, PstI, BamHI, NotI phosphorylated DNA linkers were purchased from New England Biolab. Alternatively, the complementary oligonucleotides containing appropriate restriction enzyme sites were phosphorylated and annealed as follows: 1µl 100 pmol/µl oligonucleotides A and Oligonucleotides B were mixed with 1µl 10 x T4 polynucleotide kinase buffer, 1µl 10mM ATP, 5µl H2O and 1µl T4 DNA polynucleotide kinase and incubated at 37oC for 1h. Seventeen microliters H2O and 3µl 0.5M NaCl were added and incubated at 80oC for 10min on a heating block. The heating block was switched off and the samples were taken out of the block until the temperature decreased below 30oC.
2.1.5 DNA ligation and transformation
Vector DNAs were digested and dephosphorylated with calf intestinal phosphatase (CIP) in order to reduce vector self-ligation. DNA polymerase I Large Klenow fragment (New England BioLabs) was used to fill in sticky DNA ends. Targeted DNA fragments were ligated to the vectors with T4 DNA ligase (New England BioLabs) in 20µl volume reactions. For Pfu DNA polymerase amplified PCR fragment cloning, DNA fragments were ligated to a blunt-end vector directly. For cloning of Taq DNA polymerase amplified PCR fragments, T-Vector was made by digesting pBlueScript® II KS vector with EcoRV and incubated with Taq DNA polymerase in the presence of dTTP at 37oC for 30 min to obtain an extra T at the end of linearized vector fragments.
The ligations were transformed to chemically competent E. coli strain DH5α or dam mutant DM110 cells (demethylated mutant). Four microliter ligations were added to 100ul competent cells and incubated on ice for 45 min, heat-shocked at 42oC for 90 sec and incubated for 5 min on ice. The transformants were cultured in 1ml LB medium without antibiotics at 37oC for 30-40 min in a bacteria shaker and plated onto LB plates containing antibiotics with or without blue/white selection.
2.1.6 Southern analysis and colony hybridization
DNA was digested with appropriate enzymes and separated in an ethidium bromide- containing agarose gel. The gel was photographed under UV light. DNA fragments were depurinated in 0.25 M HCl for 10 min, denatured in 0.5 M NaOH/1.5 M NaCl for 20 min 2 times and neutralized with neutralizing buffer (0.5 M Tris.HCl pH 7.0, 1.5 M NaCl) for 20 min 2 times. The DNA fragments were transferred to nylon membrane with 10 X SSC overnight and UV-crosslinked (autocrosslinker; UV Stratalinker 2400, STRATAGENE).
DNA probes were labelled using a random priming DNA labelling kit (rediprimerTM II kit, Amersham Pharmacia Biotech). Unincorporated nucleotides were removed by centrifugation of probe through a G-50 Sepharose column. The blot was prehybridized in church buffer (1L: 10g BSA, 500ml NaPi, 350 ml 20% SDS, 2ml 0.5M EDTA, 10ml 10mg/ml single-strand DNA) at 65oC for 1h and hybridized with probes of 1X10⁶ dpm/ml church buffer at 65oC overnight. The blot was then washed with 1% SDS/40mM NaPi 2 times for 20 min and exposed to X-ray film.
For low-efficiency cloning, colony hybridization was used to screen positive clones.
The bacteria were picked from one LB plate and scratched onto a second gridded LB plate and the same position of a gridded circular nylon. Both plates were incubated at 37° to regrow the bacteria. The next morning, the bacterial DNA on the membrane was lysed in denature solutions for 5 min and then in neutralization solution for 5min and crosslinked.
The membrane was hybridized with radioactivity labelled probes as that for Southern blot.
The positive colonies were recoved from the 1st LB plate.
2.1.7 DNA sequencing
Seven hundred micrograms plasmid DNAs or DNA fragments were sequenced with 2µl Big Dye Terminator premixture, 1µl 10 pmol/µl primers in 10 µl volumes. Sequencing cycling program: 95oC 30 sec, 50oC 30 sec, 60oC 4 min, cycling 25 times and samples were kept at 4oC. DNA was precipitated with 0.1 volume 3M NaAc pH5.5 and 2.5 volume 99.9%
ethanol and incubated -200C for 20 min. DNA was centrifuged at max speed at 13000 rpm for 10 min and washed with 70% ethanol. The sequencings were performed by Medigenomix (Martinsried, Germany) and viewed with Chromas version1.45.
2.2 Generation of knockout mice (Talts et al)
2.2.1 Feeder cell preparation
Feeder cells were prepared from embryonic stage (E) 14.5 embryos containing a neomycin resistant gene. Embryos were isolated sterilely from the uterus of the pregnant mice. The head, liver, kidneys and spleen of embryos were removed under the stereoscope. The remaining embryonic tissue was cut into small pieces and digested in a 50ml Falcon tube with 1x trypsin-EDTA (1mL/embryo) for 10 min at 37 oC. The tissue was further dissociated by pipetting with a 5ml pipette and incubated 10 min at 37 oC. This procedure was then repeated with a 2-ml pipette and incubated for 5-10 min at 37 oC. Following this
incubation, an equal volume of EF medium (DMEM with 10% FBS) was added to inactivate the trypsin activity. Non-dissociated tissue was allowed to sediment for 1-2 min and the supernatant containing single cells was seeded onto 10-cm dishes (1 dish per embryo). After the cells reached confluence (2 days later), they were trypsinized and plated onto two 175-cm flasks/ per 10cm-petridish. Cells were grown to confluence and then for an additional 3 days to obtain super-confluent cells. Cells were harvested by trypsinization and 10% of the cells were reseeded back onto the 175cm-flasks. The other 90% of harvested cells were centrifuged at 900g for 5 min and the cell pellets were X-irradiated at a dose of 6000 Rad for 5.4 min at the Max-Planck Institute of Neurobiology. Irradiated cells were frozen in freezing medium (70% DMEM, 20% FBS, 10% DMSO) in Nunc CryoTubesTM. with cells from each 175cm2 flask frozen into 3 vials. The reseeded cells were grown until they reached super confluence then irradiated and frozen as before. The day after freezing, a vial of cells was thawed and cultured to control efficiency of irradiation and contamination.
2.2.2 ES cell culture
The mouse R1 embryonic stem (ES) cell line, originally from the Andràs Nagy lab in Toronto, Canada, was established from a 129/Sv x 129/Sv-CP F1 3.5-day male blastocyst.
The 15th passage R1 ES cells were cultured in ES cell medium supplemented with 20% FBS tested for ES cell use. ES cell medium consisted of DMEM high glucose+ Na- pyruvate+2mM L-Glutamate (Gibco), 0.1 mM 2-mercaptoethanol, 1X non-essential amino acids of 100x stock solution (Gibco), and 1000U/mL leukemia inhibitory factor (LIF). One ampoule of ES R1 cells was thawed and seeded onto a 25cm2 flask together with feeder cells in ES medium without antibiotics. The ES medium was changed every day and cells were trypsinized every second day onto 75 cm2 or 175cm2 flasks 2 to 3 times until enough cells were available for electroporation.
2.2.3 Linearization of targeting vector
One hundred micrograms of targeting construct DNA was digested with NotI in a volume of 200 µl for 1.5 h after which 1µl of digested DNA was separated in an agarose gel and compared with undigested DNA to control the complete linearization. The DNA solution was extracted with 200 µl phenol/chloroform, and followed with 200 µl chloroform /isoamylalcohol (24:1). The DNA was then precipitated with 0.1 volume of 3M Na-acetate pH 5.2 and 2.5 volumes of 99.5% ethanol. A coiled DNA thread was visible after vigorous
shaking. The DNA string was washed with 70% ethanol once and transferred to a capped 1.5 ml tube containing 1ml 70% ethanol and stored at –200C.
2.2.4 Electroporation of construct DNA into ES cells
ES cells were washed with 1XPBS twice and harvested by trypsinization. The cells were counted and 5X10⁷ ES cells were washed twice with 10ml PBS to remove remaining serum.
At the same time, six 10-cm dishes were seeded with feeder cells in 7ml ES medium/dish.
The linearized construct DNA was spun down and the 70% ethanol was removed.
DNA was air-dried in the hood for 10 to 15 min and dissolved in 700µl PBS. The DNA/PBS solution was vortexed vigorously for 15-20 min until DNA completely dissolved and was no longer visible. The PBS/DNA solution was added to the 5X10⁷ ES cell pellet and gently mixed. The DNA/ES cell mixture was transferred to a Gene Pulser® Cuvette (0.4 cm electrode gap, Bio-Rad Laboratories) being careful to avoid air bubbles. The cuvette was incubated at room temperature for 1 min before electroporation (electroporation parameters: 0.8kv, 3uF, time constant 0.1ms). The cells were taken out from the cuvette with a glass pipette filled with 1ml ES medium and transferred to a 15 ml falcon tube with 10 ml ES medium. The electroporated ES cells were equally distributed to six 10cm-dishes with preseeded feeder cells.
2.2.5 Selection and picking of G418-resistent clones
Selection with 500 µg/ml G418 began on the day following electroporation and was carried out for 6-8 days until picking. ES medium was changed every day during selection. One day before picking, fifteen 24-well tissue culture plates were seeded with feeder cells in 1ml G418-containing ES medium. G418-resistent clones were picked onto a 96-well microtiterplate filled with 150 µl trypsin-EDTA and incubated at 37oC for 5 min. And the ES clones were dissociated into single cells by pipetting up and down several times and transferred to the wells with feeder cells. The medium was changed on the next day to remove the trypsin-EDTA. Approximately 3 days after picking, all clones on one 24-well plate were frozen at the same time. ES Clones were trypsinized and resuspended in 1 ml freezing medium. Half of this was frozen and the remaining half was left in the well, which was then filled with ES medium. The medium was replaced the next morning to prevent the toxic effect of DMSO in the freezing medium.
2.2.6 Identification of positive ES cell clones
The ES cells in 24-well plates were grown for 3-4 days until the medium turned yellow.
The yellow medium was sucked away and ES cells were lysed in 0.5ml lysis buffer (100mM Tris-HCl at pH 8.5, 5mM EDTA pH 8.0, 0.2% SDS, 200mM NaCl, 100µg/ml proteinase K). The lysates were kept in lysis buffer for 8 h to 8 days until all samples were lysed. ES cell DNA was precipitated by adding 1 ml isopropanol to each well and the plates were shaken on an orbital shaker for 4-8 h at RT. DNA became visible as web-like structure. DNA was fished out and resolved in 150 µl TE buffer by incubation at 50-550C for 10-12 h. 24 µl DNA was digested with an appropriate enzyme in 30 µl volumes for Southern analysis. Recombinant ES clones were identified with both external and internal probes on Southern blots.
2.2.7 Generation of chimeric mice and breeding scheme
Positive ES cell clones that showed equal density of wildtype and recombinant alleles on Southern blot were selected and cultured for blastocyst microinjections. For microinjection, ES cells were trypsinized and washed twice with ES medium. ES cells were microinjected into C57/B6 blastocysts (day 3.5) and transferred into the uterus of day 2.5 pseudopregnant foster mice. The microinjections were performed in the Department of Molecular Medicine or by the transgenic facility at Max-Planck-Institute of biochemistry in Martinsried. The pseudomothers gave birth to chimeric mice 17-19 days after uterus transfer of injected blastocysts. Using ES cells derived from 129/Sv mice, chimeric mice are recognized by agouti stripes. Highly chimeric male mice were mated to C57/B6 female mice for germ-line contribution of the ES cells. The heterozygous agouti offspring (if viable) were identified by Southern blotting. The heterozygous offspring were then mated to obtain homozygous mice.
2.2.8 Mouse genotyping
Mice were distinguished with numbered ear-tags and approximately 5mm piece of tails were clipped into tubes with corresponding numbers and incubated in 500 µl lysis buffer (50mM Tris-HCl, pH 7.5; 50 mM EDTA; 1% SDS; and 10 µg/ml Proteinase K) at 550C overnight with vigorous shaking. Newborn mice were identified with a toe-clipping identification method. DNA was isolated using a phenol-chloroform extraction or a simplified DNA isolation method that omitted the phenol/chloroform extraction procedure (Laird et al., 1991). PCR analysis was used to identify wildtype, heterozygote and homozygote mice. All reactions were run on a T3 Thermocycler PCR machine (Biometra)
and analyzed using agarose gel electrophoresis. For DNA amplification, genomic DNA was initially denatured for 3 min at 95°C followed by 34 cycles at 95°C for 30 sec, annealing at 53°C for 30 sec and extended at 72°C for 30 sec.
The following primers were used for mouse PCR genotyping.
4 Primers were used for genotyping γ-parvin null mice:
Wildtype allele F 5’-GTT TGA AGA ACT GCA GAA GG-3’
R 5’-GTT GAT CCA TTC CAT CAG CA-3’
Recombinant allele F 5’- CTG GGT AAT AAG CGT TGG CAA T -3’
R 5’- CCA ACT GGT AAT GGT AGC GAC-3’
3 Primers were used for genotyping α-parvin exon 2 deletion mice:
F1 5’-GGA ATG AAC GCC ATC AAC CT-3’ (for wildtype allele)
F2 (PGKf): 5’-GAT TAG ATA AAT GCC TGC TC-3’ (for recombinant allele) R1 5’-TGA AAG CAG CTT CGG CCT AAC-3’
3 Primers used for genotyping α-parvin null mice:
F1, F2 are same as those used for α-parvin exon 2 deletion mice R2 5'-TTG CGT GAG TTT GGA TCG AC-3'
2.3 In vivo and in vitro assay methods
2.3.1 Generation and purification of peptide antibodies
Peptides of 14-16 amino acids from the N-terminal region of α-, β- and γ-parvins were synthesized and lyophilized in the department of Bioorganic chemistry in Max-Planck Institute. Two mg peptides were coupled to KLH (keyhole limpet hemocyanin, Imject® Maleimide Activated mc KLH, PIERCE). KLH is a carrier protein with a large molecule capable of stimulating its own immune response. For the initial immunization, one aliquot of 500 µg peptide-hapten complexes in 500µl PBS was mixed with 500µl Inject Freund’s Complete Adjuvant (Sigma) in an adaptor (B/BRAUN) between two syringes until emulsion developed. The emulsion was immediately injected subcutaneously to a rabbit with a non-pyrogenetic needle (20G x 1/2). After the initial immunization, the animal was boosted with injection of another aliquot of immunogen. This was done 3 times with 2- week intervals. One week after the 3rd boost or 7 weeks after the initial immunization, the animal was bled. Antisera were characterized by Western blotting, cell/tissue immunostaining and immunoprecipitation assays. The antisera were further purified by using SulfoLink® kit (PIERCE).
2.3.2 Peptide blocking experiment
The specificity of peptide antisera to respective peptides was tested using a peptide blocking experiment. One microliter antiserum was mixed with corresponding peptides or control peptides. For example, 1µl α-parvin peptide antiserum was incubated with 12.5-20 µg α-parvin peptide or control peptide (same amount of β-parvin or γ-parvin peptide) in 1ml 5% milk/TBS solution and mixed overnight at 4oC. The next morning, the antibody-peptide complex was spun down and removed. The “cleaned” antibody supernatant was diluted in 5% milk/TBS solution and applied to a Western blot. The protein band was abolished by incubation with the respective peptide, but not by control peptide.
2.3.3 Western analysis
Cells were lysed with lysis buffer (0.15 M NaCl, 5 mM EDTA, 1% TX-100; PH 7.4) in the presence of proteinase inhibitors (Pepstatin 1uM, Na3VO4 1 uM, Leupeptin 10uM; or proteinase inhibitor tablet, Roche). Alternatively, tissues were homogenized in RIPA buffer (0.15 M NaCl, 50 mM Tris.HCl pH 7.4, 5 mM EDTA, 0.1%SDS, 1% sodium deoxycholate, 1%TX-100 with proteinase inhibitors). Proteins were estimated with BCATM Protein Assay kit (PIERCE).
Proteins (30 to 50 µg was used for detection of γ-parvin) were denatured at 95oC with 15mg/ml freshly added DTT or 1% 2-mecaptoethanol and separated by 10% SDS-PAGE and transferred to PVDF membrane (Amersham Pharmacia Biotech) with 15% isopropanol.
The blots were stained with 10% Ponceau S (Sigma) to record the ladder of the protein molecular weight marker (BD science, board range). The blots were blocked in 5% non-fat dry milk/TBS pH7.5/0.1%Tween20 (blocking solution) for 1 h at RT and probed with primary antibody in blocking solution for 1 h at RT or 4oC overnight. Blots were then washed with blocking solution 6 times for 5 min each and incubated with the secondary antibody diluted in blocking solution for 1 h at RT. The blots were washed with TBS 5 min 5 times and signal was detected with ECL+PlusTM kit (Amersham Pharmacia). Occasionally blots were stripped with stripping buffer (100 mM 2-mecaptoethanol, 2% SDS, 62.5mM Tris-HCl pH6.7) at 550C for 30 min with occasional agitation. The blots were washed with TBS 6 times for 5min each to remove 2-ME after stripping and then reprobed using other antibodies.
2.3.4 Immunoprecipitation (IP) assay