• Keine Ergebnisse gefunden

Identification and characterization of a genomic region involved in Drosophila gastrulation

N/A
N/A
Protected

Academic year: 2021

Aktie "Identification and characterization of a genomic region involved in Drosophila gastrulation"

Copied!
136
0
0

Wird geladen.... (Jetzt Volltext ansehen)

Volltext

(1)

Identification and characterization of a genomic region involved in Drosophila gastrulation

Inaugural-Dissertation

zur

Erlangung des Doktorgrades

der Mathematisch-Naturwissenschaftlichen Fakultät

der Universität zu Köln

vorgelegt von

Sam Jacob Mathew

aus Kerala, Indien

Köln, Dezember 2005

(2)

Prof. Dr. Maria Leptin

2. Berichterstatter:

Prof. Dr. Diethard Tautz

Tag der mündlichen Prüfung: 07 Februar 2006

(3)

Table of Contents

T

ABLE OF

C

ONTENTS

...1

1. INTRODUCTION...3

1.1 G

ASTRULATION

: A

N OVERVIEW

...3

1.2 G

ASTRULATION IN

D

ROSOPHILA

...3

1.3 V

ENTRAL FURROW FORMATION

-

THE MECHANISM

...4

1.4 G

ENES INVOLVED IN VENTRAL FURROW FORMATION

...6

1.4.1 Maternal genes ...6

1.4.2 Zygotic genes ...8

1.5 G

ENETIC SCREENS TO IDENTIFY GENES INVOLVED IN EARLY DEVELOPMENT

...12

1.6 A

IM

...16

2. MATERIALS AND METHODS ...17

2.1 M

ATERIALS

...17

2.1.1 Reagents...17

2.1.2 Drosophila melanogaster stocks...17

2.1.3 Antibodies ...21

2.1.4 Oligonucleotides ...21

2.1.5 E.coli strains ...23

2.1.6 Plasmids ...23

2.1.7 Computer software, digital photography and sectioning...23

2.2 M

ETHODS

...24

2.2.1 Genomic Sequence, EST, expression pattern and fly stock searches...24

2.2.2 Generating Drosdel deletions...24

2.2.3 Drosophila nomenclature ...25

2.2.4 Fly maintenance, embryo collection and fixation ...25

2.2.5 Antibody staining of embryos ...25

2.2.6 In situ hybridization...26

2.2.7 Embedding and sectioning of stained embryos...27

2.2.8 Single embryo PCR...27

2.2.9 Molecular cloning...28

2.2.10 Generating transgenic flies ...29

2.2.11 DNA Sequencing...29

2.2.12 RT-PCR ...29

3. RESULTS ...30

3.1 T

HE DEFICIENCY

D

F

(2L)

ED

-

DP EMBRYOS SHOW GASTRULATION DEFECTS

...30

3.2 D

EFICIENCIES ANALYSED

...34

3.2.1 A maternal locus contributes to the phenotype...37

3.2.2 A zygotic locus contributes to the phenotype ...38

3.3 N

EW DEFICIENCIES

...42

3.3.1 A locus uncovered by 3 new deficiencies ...44

3.4 C

OMPLEMENTATION AND SINGLE EMBRYO

PCR ...47

3.5 S

UMMARY

...51

3.6 A

CANDIDATE GENE RESPONSIBLE FOR THE ZYGOTIC PHENOTYPE

...52

3.6.1 Twist but not Snail is required for the ventral Traf1 expression ...57

3.6.2 Organization of the Traf1 gene and available mutants ...58

3.7 T

HE ZYGOTIC PHENOTYPE AND THE MODIFIED GENETIC BACKGROUND

...62

3.8 C

HARACTERIZATION OF THE

T

RAF

1

EX1 MUTANT

...68

3.9 S

UMMARY

...74

(4)

3.10 O

VEREXPRESSION OF

T

RAF

1

IN THE MESODERM AND ASSOCIATED EFFECTS

...75

3.11 O

VEREXPRESSION OF THE

D

ROSOPHILA

JNK

PATHWAY CAUSES DEFECTS IN GASTRULATION

...79

3.12 T

HE

JNK

PATHWAY AND WING MORPHOGENESIS

...86

3.13 S

UMMARY

...89

4. DISCUSSION ...90

4.1 S

EVERAL LOCI ESSENTIAL FOR GASTRULATION MAP TO THE

24-25

REGION

...90

4.1.1 The maternal loci...90

4.1.2 The zygotic locus ...91

4.2 T

RAF

1,

A CANDIDATE GENE INVOLVED IN GASTRULATION

...93

4.3 A

POSSIBLE ROLE FOR

JNK

AND

TNF

SIGNALLING IN GASTRULATION

...96

4.4 S

IGNALLING UPSTREAM AND DOWNSTREAM OF

T

RAF

1 ...99

4.5 C

ONCLUSIONS

...103

5. BIBLIOGRAPHY ...104

6. APPENDIX...117

6.1 M

OLECULAR MAPPING OF DEFICIENCIES BY

S

INGLE

E

MBRYO

PCR ...117

6.2.1 Df(2L)ed-dp ...118

6.2.2 Df(2L)dp-h19 ...119

6.2.3 Df(2L)dp-h25 ...121

6.2.4 Df(2L)dp-h28 ...122

6.2.5 Df(2L)dp-h24 ...123

A

BBREVIATIONS

...124

A

BSTRACT

...126

Z

USAMMENFASSUNG

...127

A

CKNOWLEDGEMENTS

...128

E

IDESSTATTLICHE

E

RKLÄRUNG

...129

L

EBENSLAUF

...130

(5)

1. Introduction

1.1 Gastrulation: An overview

Early embryonic development in various members of the animal kingdom, from sponges to higher vertebrates begins from the single celled zygote, which undergoes cell division to give rise to a hollow ball of cells, the blastula (Stern, 2004). This hollow ball of cells are remodelled to give rise to the three germ layers (two in sponges), the ectoderm, endoderm and mesoderm by the process of gastrulation. Although this is a generalized view, gastrulation essentially is the process by which the germ layers are established (Leptin, 2005). This involves a combination of different processes involving axes determination, fate specification, cell movements and cytoskeletal rearrangements, cell signalling, cell cycle regulation and so on.

1.2 Gastrulation in Drosophila

The process of gastrulation has been extensively investigated in Drosophila. It is relevant to understand the processes preceding gastrulation to appreciate gastrulation itself. After fertilization, the single celled zygote undergoes thirteen rounds of nuclear division resulting in a syncytial blastoderm (Campos-Ortega and Hartenstein, 1985). The syncytial blastoderm is converted into a cellular blastoderm by the process of cellularization, during which the plasma membrane invaginates between individual nuclei (reviewed by Lecuit, 2004). It is at this stage, about 3 hours after fertilization that the process of gastrulation begins. The initial step in gastrulation is the invagination of the mesoderm by forming a furrow on the ventral side, the ventral furrow. The already specified mesodermal cells migrate into the embryo and make up part of a tubular structure called the germ band, which then undergoes characteristic elongation and retraction movements.

The germ band is composed of ectodermal as well as mesodermal cells (Sonnenblick,

1950). Later on, the mesodermal cells start dividing and migrate out on the underlying

(6)

ectoderm and give rise to mesodermal structures, namely somatic and visceral muscles, dorsal vessel and fat body (Campos-Ortega and Hartenstein, 1985).

Gastrulation also includes the invagination of the endoderm. The endoderm invagination happens in two regions of the embryo almost immediately after ventral furrow formation has started, one at the anterior ventral part and the other at the posterior pole (Campos- Ortega and Hartenstein, 1985). The primordia that invaginate in these two regions later on contact each other and fuse to give rise to the midgut (Campos-Ortega and Hartenstein, 1985).

The work discussed here will focus on the first step in gastrulation namely ventral furrow invagination.

1.3 Ventral furrow formation- the mechanism

Ventral furrow formation, the first step in gastrulation, starts after the process of

cellularization has been completed. The first sign of ventral furrow formation is a

flattened zone of cells, about 18 cells wide and 60 cells long, the prospective mesodermal

cells, on the ventral side of the embryo (Leptin and Grunewald, 1990; Sweeton et al.,

1991). Within this domain, cells lose their ‘cobblestone’ appearance and become more

closely apposed along their entire length (Sweeton et al., 1991). More pronounced

changes commence over a period of 10-15 minutes. The cells constrict their apical sides

to become wedge shaped and then shorten along their apical-basal axis (Figure 1F, G, J

and K). The mid-ventral cells (approximately 12 cells in width) also begin to form

membranous blebs or ruffles on the surface when the apices of these cells constrict,

indicating that the apical surface area lost is displaced into these blebs (Sweeton et al.,

1991). It has been shown that not all ventral cells constrict their surfaces simultaneously,

but individual cells begin to constrict stochastically, followed by others over a period of

about 10 minutes (Kam et al., 1991; Oda and Tsukita, 2001; Sweeton et al., 1991). This is

restricted to the more ventral part of the embryo (blue region in Figure 1 E, F, G), with

the lateral parts never undergoing constriction (yellow region in Figure 1 E, F, G),

indicating a subdivision of the mesoderm into two populations (Leptin and Grunewald,

(7)

1990). As a result of these changes, the blastoderm epithelium invaginates to form the ventral furrow, which is then completely internalized and forms the germ band (reviewed by Leptin, 1999).

Figure 1: Figure representing progressive stages of gastrulation in

Drosophila and the changes

associated with each stage at the cellular level. A, B, C and D are Drosophila embryos stained with anti- Twist (brown) and anti-Even skipped (blue stripes) antibodies. Twist marks the mesoderm and the embryos shown here represent pre-gastrulation (A), ventral furrow forming (B and C) and germ band extending (D) embryos. E, F, G and H are schematic representations of cross sections through embryos of each stage shown in A, B, C and D. The blue and yellow shaded regions correspond to the Twist positive ventral region of the embryos with the blue part expressing higher Twist levels and the yellow part lower levels.

The ventral indentation signalling ventral furrow formation can be clearly seen in F and the germ band in G (blue and yellow tubular structure). The germ band has started spreading (blue part) on the ectoderm in H.

The events happening at the cellular level in a ventral cell is exemplified in the schematic I, J, K and L.

Prior to gastrulation, the ventral cells undergo flattening on their apical side, indicated by the red border in I. Then, constriction of the apical sides happen (arrows pointing at each other), pushing the previously apically placed nucleus basally (arrow) as shown in J. This force helps in invagination of the mesoderm.

Afterwards, the cells contract in an apico-basal manner (arrows pointing at each other in K) and become shortened (K). These changes are sufficient to allow these cells to migrate into the embryo and form the germ band. Later on, they lose their epithelial structure, start dividing and migrate on the ectoderm (L).

Figure courtesy of Leptin (Leptin, 1999).

(8)

Mathematical modelling has indicated that apical constriction resulting in the cell shape changes described above is sufficient to drive the formation of the invagination (Odell et al., 1981). Once inside the embryo, the mesoderm primordium loses its epithelial structure and disperses into single cells which divide, attach to the ectoderm and subsequently migrate out on the ectoderm as a single cell layer (Beiman et al., 1996;

Vincent et al., 1998).

1.4 Genes involved in ventral furrow formation

Both maternal and zygotic molecules are required for the processes described above to happen in a temporally and spatially controlled manner. Maternal molecules refer to the gene products, either RNA or protein, deposited in the embryo during oogenesis by the mother. These molecules are sufficient for early events in development (about 2 hours AEL in Drosophila), after which the zygotic transcriptional machinery becomes active (reviewed in Leptin, 1999). The maternally contributed molecules known to play a role in gastrulation as well as the zygotic components involved are discussed below.

1.4.1 Maternal genes

Several known maternal effect genes are required for normal patterning of the embryo so as to generate proper cell fates. These include genes like dorsal and toll which are essential to maintain proper dorso-ventral cell fates by activating zygotic genes such as twist and snail (discussed in the next section). Mutations have been isolated in the toll- dorsal signalling cascade, which dorsalize or ventralize the entire embryo, depending on the nature of the mutation and the function of the particular molecule in the pathway (reviewed by Moussian and Roth, 2005). Thus, these molecules function by restricting transcription of the zygotic fate determining genes to specific domains in the embryo.

The second category of maternally provided molecules include the components of the

actin cytoskeleton and associated regulatory molecules. These molecules are required

(9)

during oogenesis as well as for processes like cellularization. Therefore, mutations in such molecules disrupt earlier processes where they are required, making it difficult to study their exact role in ventral furrow formation. Actin isoforms as well as actin binding proteins have been shown to be present in the early embryo (Miller et al., 1989). Myosin, which regulates cell shape changes in a wide variety of organisms, has been shown to be dynamically localized during gastrulation (Young et al., 1991; Dawes-Hoang et al., 2005). Studies suggest that the cell shape changes necessary for ventral furrow formation might be accomplished through regulating myosin and thereby the actin cytoskeleton.

Evidence in this regard has been accumulating in recent years which suggested a pathway regulating myosin during gastrulation. Two such regulatory molecules were the small GTP binding protein Rho1 and its exchange factor RhoGEF2, reported to be required for normal gastrulation (Barrett et al., 1997; Hacker and Perrimon, 1998). Recently, the Rho effector, Rho-kinase or Drok has also been shown to be required for gastrulation (Dawes- Hoang et al., 2005).

Another maternal effect gene identified several years ago and shown to be involved in gastrulation is concertina (cta), the alpha subunit of a heterotrimeric G protein (Parks and Wieschaus, 1991). cta has been shown to affect cell shape changes and function downstream of a zygotic gene, folded gastrulation or fog (discussed in the next section).

A pathway had been proposed for activation of Cta by Fog, through an as yet unidentified

receptor (Costa et al., 1994). Recently, an interaction partner of the Gα-subunit of

heterotrimeric G proteins, Ric-8 was identified and also shown to be involved in

gastrulation (Hampoelz et al., 2005). Results from recent studies support a model for

dynamic myosin localization during ventral furrow formation according to which

signalling by Fog through the unidentified G protein coupled receptor would activate the

Gα-subunit Concertina (Morize et al., 1998; Dawes-Hoang et al., 2005). This signal is

then relayed to Rho1 through RhoGEF2 and myosin localization or activation is achieved

through the effector Drok (Dawes-Hoang et al., 2005). However, the phenotype exhibited

by embryos lacking cta is weaker compared to that of embryos lacking RhoGEF2,

(10)

suggesting that multiple signalling inputs might converge at the level of RhoGEF2 (Dawes-Hoang et al., 2005).

Other maternally provided components that might be required for actin cytoskeleton remodelling would be junctional components like Armadillo (β-Catenin), other Catenins, Cadherins and actin binding proteins such as Diaphanous and Spectrin (Hunter and Wieschaus, 2000; Wang et al., 2004; Dawes-Hoang et al., 2005).

1.4.2 Zygotic genes

Two zygotic genes identified several years ago, essential for ventral furrow formation are twist and snail (Grau et al., 1984; Nusslein-Volhard et al., 1984; Thisse et al., 1987).

Both of these genes are transcriptionally activated by the nuclear gradient of the maternal gene product Dorsal, and are expressed on the ventral side of the embryo (reviewed by Reuter and Casal, 1994). snail (sna) encodes a zinc-finger protein that represses ectodermal fates in the mesoderm primordium whereas twist (twi) encodes a bHLH protein that acts as an activator of genes in the mesoderm (Kosman et al., 1991; Leptin, 1991; Kasai et al., 1992; Nibu et al., 1998). In other words, twist and snail are the two zygotic mesodermal fate determining genes.

Embryos mutant for either twi or sna exhibit severe gastrulation defects, detectable at the

earliest stages of cell shape changes. Instead of the normal succession of apical flattening

and constriction, displacement of nuclei and cell shortening along the apical-basal axis,

only some of these processes occur in mutant embryos. In sna mutants, the ventral

epithelium becomes very thin suggesting that shortening of cells occur, but no apical

constriction is seen at all and only rudiments of a furrow forms (reviewed by Leptin,

1999). In twi mutants, ventral cells become narrow at their apical ends and nuclei move

away from the apical side. As a result, a narrow and shallow furrow is formed. However,

neither strong apical constriction nor cell shortening occurs, and the furrow fails to

invaginate fully (reviewed by Leptin, 1999). Since Twist is required for the maintenance

of sna expression in the mesoderm, the defects in twi mutants might in part be due to a

reduction in Snail function. Indeed, when additional Snail is provided in the prospective

mesoderm, the twi mutant phenotype is alleviated (Ip et al., 1994). However, the ventral

(11)

furrow is not restored to a normal appearance, suggesting that twi also has sna independent functions. This was confirmed by the analysis of embryos mutant for both genes. In such embryos, no processes characteristic of mesodermal cells occur at all and the gene expression patterns of the ventral cells are identical to those in the neighbouring neural ectoderm. Thus, Twist and Snail jointly control the activation of the molecules that mediate cell-shape changes in the ventral furrow (reviewed by Leptin, 1999).

The lateral borders of sna but not of twi expression precisely mark the lateral boundaries of the mesoderm primordium (Leptin, 1991). In sna mutants, expression of several ectodermal genes extend into the mesoderm, indicating that Snail is required to repress ectodermal fates (Leptin, 1991). However, there are a few examples of genes that require Snail for their expression in the mesoderm, such as zfh1 (Casal and Leptin, 1996). Twist, on the other hand is thought to activate genes such as fog in the mesoderm in order to maintain mesodermal identity (Leptin, 1991).

The anterior and posterior borders of the mesoderm primordium are not directly defined by the expression of twi or sna but are established by the activity of the terminal gap gene, huckebein (hkb) (Reuter and Leptin, 1994). hkb is expressed at both termini of the blastoderm. Within the posterior region of the embryo, hkb determines the border of the mesoderm by repressing sna expression whereas at the anterior region of the embryo, hkb does not repress sna because the maternal morphogen bicoid counteracts the repressive effect of hkb on sna (Reuter and Leptin, 1994). Nevertheless hkb antagonizes the effect of sna and twi on mesodermal target genes and thereby establishes the anterior border of the mesoderm primordium (Reuter and Casal, 1994).

Several target genes of Twist have been identified previously and one such target, folded

gastrulation (fog), is known to be involved in gastrulation (Zusman and Wieschaus,

1985). fog, which codes for a secreted protein, is first expressed transiently in the

prospective ventral furrow and a few minutes later in the posterior pole of the embryo

(Costa et al., 1994). Embryos mutant for fog show the same phenotype as those lacking

functional Concertina protein, where cell shape changes during ventral furrow formation

are disorganized and proceed in an uncoordinated manner (Costa et al., 1994). Further, it

(12)

has been shown that activating the fog/cta pathway results in ectopic cell shape changes (Morize et al., 1998). Evidence from recent work has led to a model for cell shape changes during gastrulation wherein Fog induced activation of Concertina leads to myosin localization or activation, suggesting that fog is an important member in the cascade triggering the cell shape changes responsible for ventral furrow formation (Dawes-Hoang et al., 2005). However, although delayed and disrupted, the ventral furrow does form in fog mutant embryos, indicating the presence of at least one parallel pathway controlling cell shape changes during ventral furrow formation (Costa et al., 1994; Dawes-Hoang et al., 2005; personal communication from Koelsch, V).

Another category of zygotic genes that are involved in ventral furrow formation are the cell cycle regulators, tribbles (trbl), fruhstart (frs) and held out wings (how) (Grosshans and Wieschaus 2000; Mata et al., 2000; Seher and Leptin, 2000; Grosshans et al., 2003;

Nabel-Rosen et al., 2005). Although the gene product of how is supplied maternally, zygotic mutant embryos exhibit similar defects as embryos lacking the maternal how gene product (Nabel-Rosen et al., 2005) and hence it is included in the category of zygotic genes. In embryos mutant for any of these three genes, ventral furrow formation is delayed and uncoordinated. This is because these three genes function to block cell division in the mesoderm during the process of ventral furrow invagination by regulating the activity of the mitotic inducer cdc25 or string (stg). In accordance with this, it has been shown that embryos mutant for these genes enter mitosis prematurely (Grosshans and Wieschaus 2000; Mata et al., 2000; Seher and Leptin, 2000; Grosshans et al., 2003;

Nabel-Rosen et al., 2005). One reason why morphogenesis and cell division might be

mutually exclusive events might be because both processes require reorganization of the

actin cytoskeleton.

(13)

Figure 2: A schematic representing the known maternal and zygotic molecules involved in ventral furrow formation: A ventral cell undergoing cell shape changes in the process of furrow formation is represented, with the grey oval being the nucleus. The apical and basal poles are represented by A and B respectively adjacent to the cell. The maternal factors are shown in blue and the zygotic, in red. The initial step is Dorsal mediated activation of Twist and Snail, the zygotic cell fate determinants. Twist maintains snail expression and also activates other targets, notably the secreted molecule Fog, which binds an unidentified G protein coupled receptor activating Cta, the α subunit of a heterotrimeric G protein. This activates a Rho signalling cascade mediated by RhoGEF2, Rho1 and ROK, which in turn activates or localizes myosin, thought to mediate actin cytoskeletal movements culminating in the cell shape changes.

However, a fog independent pathway must exist, as fog mutants can generate a ventral furrow, components of which are represented by the X, Y, Z notations. The other molecules represented are trbl, how and frs, which help in regulating cell cycle during ventral furrow formation by preventing the action of stg. Figure modified from Leptin, 1999.

A model representing most of the molecules involved in ventral furrow formation

mentioned so far is depicted in Figure 2. The initial event of activation of the zygotic

determinants twi and sna is achieved by a nuclear gradient of Dorsal. Twist maintains the

expression of sna and also activates downstream targets such as fog. Fog is a secreted

(14)

protein which activates a G protein signalling cascade through the Gα subunit Concertina.

Concertina is maternally provided and is thought to trigger a Rho signalling cascade mediated by RhoGEF2, Rho1 and ROK, culminating in myosin localization or activation (Dawes-Hoang et al., 2005). However, a fog independent pathway for ventral furrow formation must exist as fog mutants generate a ventral furrow, albeit delayed.

Components of such a pathway are represented by the X, Y, Z notations in Figure 2.

These are most likely twist targets because the known twist targets are unable to reproduce the twist loss of function phenotype (Seher and Leptin, unpublished). Zygotic factors such as trbl, frs and how are known to block cell division during ventral furrow formation, by negatively regulating the activity of stg (Figure 2). Other factors such as junctional components and actin binding proteins have not been represented in this model.

1.5 Genetic screens to identify genes involved in early development

Most of the genes described above, both maternal and zygotic, affecting ventral furrow formation and gastrulation were identified in large-scale screens for loss of function phenotypes (Nusslein-Volhard et al., 1980; Nusslein-Volhard and Wieschaus, 1980;

Simpson, 1983; Nusslein-Volhard et al., 1984; Zusman and Wieschaus, 1985). Some of the early studies on genes such as fog, located on the X chromosome were done using an unstable ring X chromosome to generate gynandromorphs (Zusman and Wieschaus, 1985).

It was clear that some loci required during early embryonic development would have

been missed in the large scale mutagenesis screens, as evidenced by earlier observations

that embryos lacking the entire X chromosome become abnormal prior to cellularization

(Poulson, 1940). Wieschaus and Sweeton, in a modification of the genetic technique used

to generate gynandromorphs (Zusman and Wieschaus, 1985), utilized the availability of

X chromosome to Y translocations and generate embryos that lacked the entire X

chromosome (Wieschaus and Sweeton, 1988). Further, they were able to generate

embryos deficient for smaller overlapping regions of the X chromosome, thereby

(15)

narrowing down the genomic stretch responsible for the defects, culminating in identification of the locus (Wieschaus and Sweeton, 1988).

In a further refinement of the aforementioned strategy, a genetic screen was designed and carried out in order to identify early requirements for autosomal zygotic gene activity, obtaining maximum coverage of the genome as possible at that time (Merrill et al., 1988).

The strategy was novel and simple, using compound autosomes and autosome -Y translocations, in order to generate embryos deficient for overlapping regions of each autosome until the entire chromosome arm was covered (Merrill et al., 1988). The advantage of this technique was that maternal effects would not skew the nature of the embryonic defects observed, as the mothers used (compound autosome stocks) have the complete chromosomal complement (Rasmussen, 1960).

A schematic representing how the chromosomal segregation pattern occurs in a compound autosomal stock is shown in Figure 3. The left arms of the chromosome are represented in blue and the right arms in red, with the centromere depicted as a black dot in between. Unlike normal stocks where one left arm is attached to one right arm, in the compound stock, both left arms are attached to each other, as are the two right arms (Rasmussen, 1960). However, the individuals have the normal genetic complement.

Segregation analysis indicated that females from these stocks produce two types of

gametes, either both left arms attached to each other or the two right arms attached to

each other, whereas males can produce gametes with all four arms attached to each other

as well as no arms at all, in addition to the two produced by females (Figure 3) (Merrill et

al., 1988). The columns marked in grey show the chromosomal combination that will

give rise to viable, fertile progeny so as to maintain the stock. The columns marked in

green are the gametes that would be helpful in generating deletions of autosomal arms.

(16)

Figure 3: Schematic representing chromosomal segregation in a compound autosomal stock. The blue lines represent the left arms of the autosome and the red lines the right arms. The black dot attaching the chromosomal arms is the centromere. Unlike normal chromosomes where one left arm is joined to one right arm by the centromere, in the compound autosomal stock the two left arms are attached to each other as are the two right arms. However, these individuals contain the normal genetic complement. Their gametes however contain either two left or two right arms of the attached autosome or all four arms or none.

Segregational analysis from previous studies indicate that virtually all the female gametes are either attached right arms or attached left arms whereas male gametes in addition include the category of all four arms attached to each other as well as none. The boxes marked in grey indicate the progeny from the stock that have the full chromosomal complement and help in maintaining the stock. The boxes marked in green are the ones lacking entire right arms or left arms, useful in studying zygotic gene function. Figure modified from Merrill et al., 1988.

When such compound stock females are crossed to males carrying autosomal

translocations, one eighth of the progeny lack the genomic stretch uncovered by the

translocation. However, since the mothers (compound stock) have the complete

chromosomal complement, they do not exhibit any maternal effect. Thus, by using

overlapping translocations that cover the entire chromosome arm, one could screen for

zygotic loci required during early embryonic development (Merrill et al., 1988). Many of

the zygotic genes involved in cellularization were identified during the course of this

screen.

(17)

Figure 4: Schematic showing the chromosomal segregation pattern in a cross between the compound stock females and a translocation stock. The blue lines represent the left arms of the chromosome, the red lines the right arms and the black dots, the centromere. In this instance, part of the genomic stretch from the left arm is translocated, represented by the break flanked by the green lines on one of the left arms. One- eighth of the progeny would exhibit any zygotic effects due to deletion of genes uncovered by the translocated segment (grey column). However, only zygotic effects would be manifest in such embryos, as the mothers have the complete chromosomal complement. By screening overlapping sets of translocations covering the entire chromosomal arm, one would be able to identify zygotic loci which are required early in development. Figure modified from Merrill et al., 1988.

This strategy of generating synthetic deficiencies by using chromosomal aberrations were used later on to screen for zygotic loci involved in wingless signalling (Muller et al., 1999), as well as to find genes involved in ventral furrow formation (Grosshans and Wieschaus 2000). The latter screen led to the identification of two zygotic cell cycle regulators during gastrulation, trbl and frs (Grosshans and Wieschaus 2000).

However, independent screens which employed other strategies also led to identification

of both or one of these loci (Mata et al., 2000; Seher and Leptin, 2000). Mata et al

identified trbl in a modular misexpression screen (Mata et al., 2000; Rorth, 1996),

whereas Seher and Leptin identified trbl and frs in a deficiency screen (Seher and Leptin,

2000; thesis, Seher). The latter screen was performed to identify target loci of twist that

(18)

are involved in gastrulation. This was because the twist loss of function phenotype was not reproduced by loss of function of the known twist targets, implying that unidentified loci might have a role. This screen was performed using deficiency stocks so that a quarter of the embryos derived by crossing deficiency males to females would be homozygous mutant for all the genes uncovered by the deficiency (thesis, Seher). Thus, zygotic effects as well as dominant maternal effects on gastrulation would be manifest in these embryos. Genomic regions uncovered by such deficiencies exhibiting gastrulation defects were ear marked for further analysis so as to facilitate mapping of the gene or genes within the uncovered stretch responsible for the defects.

In this screen, about 80% of the genome of Drosophila was scanned using deficiencies for early gastrulation phenotypes (Seher and Leptin, 2000; thesis, Seher, T). Four independent genomic regions, in addition to the known loci involved in gastrulation were identified by this screen. One such genomic region was the 24-25 cytogenetic region, uncovered by the deficiency Df(2L)sc-19-8. Later on, embryos from an overlapping deficiency, Df(2L)ed-dp which uncovers the cytogenetic region 24C3-25A2, was also shown to be defective in gastrulation (thesis, Seher, T). The work described here will focus on the characterization of the 24-25 cytogenetic region in order to identify the gene or genes responsible for the gastrulation defects exhibited by deficiencies in the region.

1.6 Aim

The aim of this work is to map, clone and characterize the gene or genes responsible for

the gastrulation defects exhibited by embryos derived from deficiency stocks in the 24-25

cytogenetic region in Drosophila melanogaster.

(19)

2. Materials and Methods

2.1 Materials

2.1.1 Reagents

Tween20, tRNA, RNase and amino acids were purchased from Sigma. New England Biolabs supplied acetylated Bovine Serum Albumen (BSA), IKB ladder, 10KB ladder, restriction enzymes or other DNA modifying enzymes and their buffers. Proteinase K was purcahsed from Qiagen. Expand High Fidelity PCR system, ssDNA (salmon sperm DNA), Nitroblue tetrazolium (NBT), 5’-bromo-4-chloro-indoxylphosphate (BCIP), unlabelled nucleotides, hexanucleotide mix and anti-DIG antibody were supplied by Roche Diagnostics GmbH. Araldite and heparin were bought from Serva. Agarose electrophoresis grade was from Gibco BRL. The Vectastain-ABC-kit was purchased from Vector Laboratories. Unless otherwise mentioned, all the other chemicals were purchased from Amersham, Invitrogen, Merck, Roth or Sigma. Drosophila EST and cDNA clones were obtained from Resgen (Invitrogen), BACPAC Resources (http://bacpac.chori.org/drosocDNA.htm) or DGRC (http://dgrc.cgb.indiana.edu/).

2.1.2 Drosophila melanogaster stocks

The following Drosophila stocks were used in this study. The genotype of the stock, the stock number if it was obtained from a stock center or the source in other cases, as well as the references (where avaiable) are provided.

Stock Genotype

Stock

No./Source Original Reference

Deficiencies 24-25 cytogenetic region

Df(2L) M24 F-B/SM1 Bl-744 Szidonya and Reuter, 1988

Df(2L) sc 19-11/In(2L) Cy,Roi Sz Szidonya and Reuter, 1988

Df(2L)dp-h25/In(2L)Cy[L]t[R], In(2R)Cy, amos[Roi-1] Bl-3081 Szidonya and Reuter, 1988

Df(2L)dp-h19/SM1 Sz Szidonya and Reuter, 1988

Df(2L)dp-h28/SM1 Sz Szidonya and Reuter, 1988

Df(2L)M24F11/Dp(2;2)B3, ed1 dpo2 cl1 Bl-3080 Szidonya and Reuter, 1988

Df(2L) sc 19-11/In(2L) Cy,Roi Sz Szidonya and Reuter, 1988

Df(2L)sc19-9/In(2L)CyLtR In(2R)Cy, Cy1 amosRoi-1 Bl-3815 Szidonya and Reuter, 1988

(20)

Df(2L)sc19-8/SM6b; Dp(2;1)B19, y1, ed1 dpo2 cl1 Bl-693 Szidonya and Reuter, 1988 Df(2L)sc19-4/In(2L)CyLtR In(2R)Cy, Cy1 amosRoi-1 Bl-3813 Szidonya and Reuter, 1988 Df(2L)sc19-3/In(2L)CyLtR In(2R)Cy, Cy1 amosRoi-1 Bl-3812 Szidonya and Reuter, 1988 Df(2L)sc19-7/In(2L)CyLtR In(2R)Cy, Cy1 amosRoi-1 Bl-3814 Szidonya and Reuter, 1988

Df(2L)ed1/CyO; P{ry+t7.2=ftz/lacC}1 Bl-5330 Szidonya and Reuter, 1988

Df(2L)dp-h24/SM6b Bl-1070 Szidonya and Reuter, 1988

Df(2L) sc 19-10/In(2L) Cy,Roi Sz Szidonya and Reuter, 1988

Df(2L) ed dp/SM1 Bl-702 Szidonya and Reuter, 1988

Df(2L) sc 19-5/In(2L) Cy,Roi Sz Szidonya and Reuter, 1988

Df(2L)sc19-1/SM6b; Dp(2;1)B19 Bl-615 Szidonya and Reuter, 1988

Df(2L)dp-cl-h3/Dp(2;2)B3, ed1 dpo2 cl1 Bl-1185 Szidonya and Reuter, 1988

EP Insertions and excisions

EP(2)578 Sz Rorth, 1996

y1 w67c23; P{w+mC y+mDint2=EPgy2}EY9771 Bellen lab Bellen et al., 2004

Traf1EP578

ex1

/Cyo Chung lab Cha et al., 2003

Traf1EP578

ex1

/ Traf1EP578

ex1

(floating balancer) ML unpublished

DTraf2EP(X)1516/Basc Chung lab Cha et al., 2003

Drosdel P element stocks

y w iso; P{FRT, w+}RS5-SZ-4048; 3iso Drosdel Ryder et al., 2004

y w iso; P{FRT, w+}RS5-SZ-3590; 3iso Drosdel Ryder et al., 2004

y w iso; P{FRT, w+}RSCB-0544-3; 3iso Drosdel Ryder et al., 2004

y w iso; P{FRT, w+}RS5-HA-1531; 3iso Drosdel Ryder et al., 2004

y w iso; P{FRT, w+}RSCB-5668-3; 3iso Drosdel Ryder et al., 2004

y w iso; P{FRT, w+}RS5-HA-1707; 3iso Drosdel Ryder et al., 2004

y w iso; P{FRT, w+}RSCB-5717-3; 3iso Drosdel Ryder et al., 2004

y w iso; P{FRT, w+}RSUM-8380-3; 3iso Drosdel Ryder et al., 2004

y w iso; P{FRT, w+}RSCB-0621-3; 3iso Drosdel Ryder et al., 2004

y w iso; P{FRT, w+}RS5-HA-1621; 3iso Drosdel Ryder et al., 2004

y w iso; P{FRT, w+}RS5-HA-1035; 3iso Drosdel Ryder et al., 2004

y w iso; P{FRT, w+}RS5-HA-1043; 3iso Drosdel Ryder et al., 2004

y w iso; P{FRT, w+}RSCB-0110-3; 3iso Drosdel Ryder et al., 2004

y w iso; P{FRT, w+}RSCB-0383-3; 3iso Drosdel Ryder et al., 2004

y w iso; P{FRT, w+}RS5-HA-1420; 3iso Drosdel Ryder et al., 2004

y w iso; P{FRT, w+}RS5-SZ-3156; 3iso Drosdel Ryder et al., 2004

y w iso; P{FRT, w+}RSCB-0211-3; 3iso Drosdel Ryder et al., 2004

y w iso; P{FRT, w+}RSCB-0494-3; 3iso Drosdel Ryder et al., 2004

Isogenized stocks for generating deletions

y w 70FLPiso; Sco/SM6a; 3iso Bl6416 Ryder et al., 2004

w1118 iso; Sco/SM6a; 3iso Bl5907 Ryder et al., 2004

Drosdel deletions constructed

P{FRT, w+}CB-0621-3r--5-HA-1621r/SM1 ED260/ML unpublished

P{FRT, w+}CB-0211-3r--5-HA-1621r/SM1 ED256/ML unpublished

P{FRT, w+}CB-0494-3r--5-HA-1621r/SM1 ED258/ML unpublished

P{FRT, w+}CB-0383-3r--5-SZ-4048r/SM1 ED247/ML unpublished

P{FRT, w+}CB-5668-3r--5-HA-1531r/SM1 ED250/ML unpublished

P{FRT, w+}CB-5668-3r--5-HA-1035r/SM1 Df(2L)1035/ML unpublished

(21)

P{FRT, w+}CB-5668-3r--5-SZ-3156r/SM1 ED251/ML unpublished

P{FRT, w+}CB-5668-3r--5-HA-1043r/SM1 ED262/ML unpublished

P{FRT, w+}CB-0110-3r--5-HA-1707r/SM1 ED252/ML unpublished

P{FRT, w+}CB-0544-3-3r--5-HA-1420r/SM2 ED270/ML unpublished

Stocks used for complementation

cn1 P{ry+t7.2=PZ}l(2)0670806708/CyO;ry506 Bl12320 BDGP

y1 w67c23; P{w+mC=lacW}edk01102/CyO Bl10490 BDGP

l(2)SH0479/CyO (CG3714) Steven Hou lab Oh et al., 2003

ft[G-rv]/SM5 Bl1894 Bryant et al., 1988

y1 w67c23; P{w+mC=lacW}tutlk14703/CyO Bl10451 BDGP

l(2)SH0805/CyO (CG18013) Steven Hou lab Oh et al., 2003

y1 w67c23; P{w+mC=lacW}Tps1k08903/CyO Bl10838 BDGP

dw-24E1 l(2)cg1 cg1/SM5 Bl292 Curry, 1941

y

1

; P{y

+mDint2

w

BR.E.BR

=SUPor-P}mRpL27

KG01128

/SM6a;

ry

506

Bl14881 BDGP

l(2)SH0840/CyO (CG15442-RpL27A) Steven Hou lab Oh et al., 2003

dplv1 b1/SM5 Bl278 Grace, 1980

l(2)SH1525/CyO (CG2937-mRpS2) Steven Hou lab Oh et al., 2003

slf1 cn1 bw1 sp1/CyO Bl3265

Nusslein-Volhard et al., 1984

y1 w67c23; P{w+mC=lacW}l(2)k10004k10004/CyO Bl10964 BDGP

y1 w67c23; P{w+mC=lacW}l(2)k10217k10217/CyO Bl10983 BDGP

y1 w67c23; P{w+mC=lacW}vkgk00236/CyO Bl10473 BDGP

y1 w67c23; P{w+mC=lacW}l(2)k10127k10127/CyO Bl10973 BDGP

y1 w67c23; P{w+mC=lacW}l(2)k11206k11206/CyO Bl11017 BDGP

EMS alleles in 24-25 cytogenetic region

l(2)jf2a6/In(2L)CyLtR In(2R)Cy, Cy1 amosRoi-1 Sz Szidonya and Reuter, 1988 l(2)jf2b8/In(2L)CyLtR In(2R)Cy, Cy1 amosRoi-1 Sz Szidonya and Reuter, 1988 l(2)jf3b25/In(2L)CyLtR In(2R)Cy, Cy1 amosRoi-1 Sz Szidonya and Reuter, 1988 l(2)jf3sz11/In(2L)CyLtR In(2R)Cy, Cy1 amosRoi-1 Sz Szidonya and Reuter, 1988 l(2)jf3sz49/In(2L)CyLtR In(2R)Cy, Cy1 amosRoi-1 Sz Szidonya and Reuter, 1988 l(2)jf3sz56/In(2L)CyLtR In(2R)Cy, Cy1 amosRoi-1 Sz Szidonya and Reuter, 1988 l(2)jf4b11/In(2L)CyLtR In(2R)Cy, Cy1 amosRoi-1 Sz Szidonya and Reuter, 1988 l(2)jf5a18/In(2L)CyLtR In(2R)Cy, Cy1 amosRoi-1 Sz Szidonya and Reuter, 1988 l(2)jf5a19/In(2L)CyLtR In(2R)Cy, Cy1 amosRoi-1 Sz Szidonya and Reuter, 1988 l(2)jf5b2/In(2L)CyLtR In(2R)Cy, Cy1 amosRoi-1 Sz Szidonya and Reuter, 1988 l(2)jf5h10/In(2L)CyLtR In(2R)Cy, Cy1 amosRoi-1 Sz Szidonya and Reuter, 1988 l(2)jf5sz31/In(2L)CyLtR In(2R)Cy, Cy1 amosRoi-1 Sz Szidonya and Reuter, 1988 l(2)jf6sz3/In(2L)CyLtR In(2R)Cy, Cy1 amosRoi-1 Sz Szidonya and Reuter, 1988 l(2)jf7h32/In(2L)CyLtR In(2R)Cy, Cy1 amosRoi-1 Sz Szidonya and Reuter, 1988 l(2)jf7h36/In(2L)CyLtR In(2R)Cy, Cy1 amosRoi-1 Sz Szidonya and Reuter, 1988 l(2)jf7h39/In(2L)CyLtR In(2R)Cy, Cy1 amosRoi-1 Sz Szidonya and Reuter, 1988 l(2)jf13sz18/In(2L)CyLtR In(2R)Cy, Cy1 amosRoi-1 Sz Szidonya and Reuter, 1988 l(2)jf14h7/In(2L)CyLtR In(2R)Cy, Cy1 amosRoi-1 Sz Szidonya and Reuter, 1988 l(2)jf15h12/In(2L)CyLtR In(2R)Cy, Cy1 amosRoi-1 Sz Szidonya and Reuter, 1988

(22)

Translocation stocks

T(Y;2)A183, y[+]/SM1; C(1)RM, y[1]/C(1;Y)1,y[1] Bl2628 T(Y;2)B184, B[S], y[+]/SM1; C(1)RM,

y[1]/C(1;Y)1,y[1] Bl2645

T(Y;2)G100, y[+]/SM1; C(1)RM, y[1]/C(1;Y)1,y[1] Bl2685 T(Y;2)L110, B[S], y[+]/SM1; C(1)RM,

y[1]/C(1;Y)1,y[1] Bl2739

T(Y;2)H158,y[+]/SM1; C(1)RM, y[1]/C(1;Y)1,y[1] Bl3683 T(Y;2)B110, B[S], y[+]/SM1; C(1)RM,

y[1]/C(1;Y)1,y[1] Bl2640

T(Y;2)B190, y[+]/SM1; C(1)RM, y[1]/C(1;Y)1,y[1] Bl2647 T(Y;2)B251, B[S], y[+]/SM1; C(1)RM,

y[1]/C(1;Y)1,y[1] Bl2661

T(Y;2)J30, y[+]/SM1; C(1)RM, y[1]/C(1;Y)1,y[1] Bl2711 T(Y;2)R50, B[S], y[+]/SM1; C(1)RM, y[1]/C(1;Y)1,y[1] Bl2763 T(Y;2)B24, y[+]/SM1; C(1)RM, y[1]/C(1;Y)1,y[1] Bl2631 T(Y;2)B63, B[S], y[+]/SM1; C(1)RM, y[1]/C(1;Y)1,y[1] Bl2633 T(Y;2)B177, B[S], y[+]/SM1; C(1)RM,

y[1]/C(1;Y)1,y[1] Bl2644

T(Y;2)B238, B[S], y[+]/SM1; C(1)RM,

y[1]/C(1;Y)1,y[1] Bl2659

T(Y;2)B26, B[S], y[+]/SM1; C(1)RM, y[1]/C(1;Y)1,y[1] Bl3682

Tp(2;Y)G/b[1]pr[1]tk[1] Bl4359

UAS stocks

w; UAS-eiger Basler lab Moreno et al., 2002

w; UAS-Traf1HA Miura lab Kuranaga et al., 2002

w; UAS-misshapen Mlodzik lab

w; UAS-basket Mlodzik lab

w; UAS-hemipterous Mlodzik lab

w; UAS-hemipterous Mlodzik lab

w; UAS-hemipterous(constitutively active) Mlodzik lab

w; UAS-Rho1dsRNA Liqun Luo lab Billuart et al., 2001

w; UAS-Traf1Fulllength(1-1466) ML Unpublished

w; UAS-Traf1

C-Trafdomain(1-1011) ML Unpublished

w; UAS-Traf1

C-Trafdomain+Zincfingers(1-803) ML Unpublished

w; UAS-Traf1

N-Exon1(809-1466) ML Unpublished

w; UAS-Traf1

N-Exon1+Zincfingers(1011-1466) ML Unpublished

w; UAS-Wengen ML Unpublished

GAL4 stocks

maternal Gal4 St.Johnston lab

Twist Gal4 Akam lab Greig and Akam, 1993

Scalloped Gal4 Klein lab

w; UAS-puckered

Martinez-Arias

lab Martin-Blanco et al., 1998

Other stocks

Df(2L)aldpbTE116(R)GW11cnsp/CyO Rolf Reuter Reuter and Leptin, 1994

w;twiEY53R12bw/SM1 Rolf Reuter Reuter and Leptin, 1994

(23)

w,fog[4a6]/FM7/Ymal[106] Wieschaus lab Costa et al., 1994

Df(2L)TE116(R)GW11Df(2R)S60/SM1 Rolf Reuter Reuter and Leptin, 1994

al1 dpov1 b1 pr1 Bl1 c1 px1 sp1/SM1 Bl213

Orgeon R wild type Bl5

C(2)v Wieschaus lab Merrill et al., 1988

w; 2XPEe Traf1 ML Unpublished

Abbreviations used

Bl- Bloomington stock centre Sz- Szeged stock center

Drosdel- Drosdel consortium for generating deficiencies ML- Maria Leptin lab

BDGP- Berkeley Drosophila Genome Project

2.1.3 Antibodies

The following primary antibodies were used:

Rabbit anti-Twist (kindly provided by S.Roth; Roth et al., 1989) at a dilution of 1:3000 and Rabbit anti-Eve (kindly provided by M. Frasch; Frasch and Levine, 1987) at a dilution of 1:5000.

The secondary antibody (anti-Rabbit biotinylated) was purchased from Dianova.

2.1.4 Oligonucleotides

Oligonucleotides were purchased from Eurogentec and Carl Roth GmbH. The lyophilised pellet was resuspended in water at a concentration of 100pmol/µl and stored at –80

0

C.

Aliquots of 15-20pmol/µl were made and used in the PCR reactions.

Oligo Name Purpose Sequence

dp1a SEPCR GCAATTACACATGCTCCTG

dp1b SEPCR GATTATCCTGACACTCGTTG

11929a SEPCR CTGGTCTACAATGCAGTAG

11929b SEPCR CAACCAAGCTACTAGTGAC

15631a SEPCR GGAATCAAACAGCTTCACG

15631b SEPCR CAGTTACACTCCTAGTGTC

3225a SEPCR CTGCTCAAGAAGATCCTTC

3225b SEPCR GATGGTTATGATCTCCTCG

CG15634F SEPCR GTTCTCCATTCGATGGAAC

(24)

CG15634R SEPCR GACTCTGCAGATTCTTGTTG

CG3702F SEPCR TCGATAGGTCCTCAACACT

CG3702R SEPCR TCAGCTCACCGAGCATATT

AtetF SEPCR ATATGCCGACTAATGCCGT

AtetR SEPCR TGTCCGCTTAGCGAATCAT

CG15429F SEPCR ACTATCTCAAGGACGAGGT

CG15429R SEPCR ATGTCGTCCGTGTAGTAGA

CG15431F SEPCR TAGCAATCGAGTCCAAGCA

CG15431R SEPCR AGTCCCAATTCTCGATGCT

CG15436F SEPCR AATGGCGGAAATATGCCGA

CG15436R SEPCR TGCTCAGCCGAAAAGTCTT

CG12677F SEPCR CCACACATTTCTGAAGAGG

CG12677R SEPCR GCGTTGAGTCAATATCGAG

Traf1 3'F SEPCR GTCTACATAAAGGTCCTGC

Traf1 3'R SEPCR GCTGCTCCGAATTTAACAC

Traf1 5'F SEPCR CTGTATCTGAAACTGAGCC

Traf1 5'R SEPCR CTCTAGATGGCCCTATTTG

CG3652F SEPCR CTACTAGATGTTCGAGGAC

CG3652R SEPCR CTAATCACTAAACGAGGCG

Tps1F SEPCR CACTGTCAACAAGCACTTC

Tps1R SEPCR GTAGTCATCGAAATCGTCC

T7 Sequencing TAATACGACTCACTATAGGG

T3 Sequencing ATTAACCCTCACTAAAGGGA

SP6 Sequencing ATTTAGGTGACACTATAG

PUASTF Sequencing GAAGAGAACTCTGAATAGGGAATTGG

PUASTR Sequencing GGTAGTTTGTCCAATTATGTCAC

LEP1F

Excision

mapping CGAGTTGCTCGTTGTTTTC

LEP1R

Excision

mapping CTCTGGCATTGCACTTTAG

LEP2F

Excision

mapping CTAAAGTGCAATGCCAGAG

LEP3F

Excision

mapping GCACTATGAAACCTCCTTG

REP3R

Excision

mapping GGCTCAGTTTCAGATACAG

Traf5RR

Excision

mapping CGAGAACTTCCGTTTGTTC

TrafFBamH1 Cloning ATAGGATCCCGCAAGCGGTTCGTATTCGTGAAGTTCGCA

TrafRXba1 Cloning ATATCTAGACTAAGAAGTCAAACATACAATAAATGAAGTA

TrafBamH1mutF Cloning TGAAAGTGGACCCCAGCAAGATAGT

TrafBamH1mutR RT-

PCR+Cloning ACTATCTTGCTGGGGTCCACTTTCA

TrafRXba1 Cloning ATATCTAGATACTTCATTTATTGTATGTTTGACTTCTTAG

TrafFBH1 Cloning ATAGGATCCATGGTTCGAAGTTTGGCCCAGTGGA

TrafFBH1RNA Cloning ATAGGATCCAATGGTTCGAAGTTTGGCCCAGTGGA

Traf1011XhR Cloning ATTCTCGAGTTAGCCGACCAGTCGGTG

(25)

TrafHind3F Cloning ATAAAGCTTATGGTTCGAAGTTTGGCCCA

HAbamF Cloning AATGGATCCCCATGGCCTACCCATATGAT

HAXbaR Cloning AACTCTAGATTAGCTCGCGTAATCTGG

Traf503RXh1 Cloning AACCTCGAGGTTCCAGTTCCGTGATGGGCATG

TrfFXho1 Cloning ATAACTCGAGCGCAAGCGGTTCGTATTCGTGAAGTTC

Traf1011XhF Cloning GACCTCGAGCACCGACTGGTCGGCTAA

TrafHind3Fnew Cloning ATAAAGCTTGCATGGTTCGAAGTTTGGCCCA

Traf804XhoIF

RT-

PCR+Cloning ACTCTCGAGATGCTAGCCGTGTCCTGCAGCTTC

Traf1009XhoIF Cloning ACTCTCGAGATGATCACCGACTGGTCGGCTAAG

HAXho1F Cloning AATCTCGAGCCATGGCCTACCCATATGAT

TrafRKpn1 Cloning ACTGGTACCACTCCTTAGACGGCCACTATCTTGCT

Traf804KpnIR Cloning ACTGGTACCGAAGCTGCAGGACACGGCTAG

HANotIF Cloning AATGCGGCCGCATGGCCTACCCATATGATGTT

TrafRXhoI Cloning AATCTCGAGCCCTCCTTAGACGGCCACTATCTTGCT

Traf804XhoIR Cloning AATCTCGAGCCGAAGCTGCAGGACACGGCTAG

Act5cF RT-PCR TGAACCCCAAGGCCAACCG

Act5cR RT-PCR ATCCAGACAGAGTACTTGCG

2.1.5 E.coli strains

The DH5α and BL-21 strains were used. Selection was done using ampicillin, kanamycin or chloramphenicol.

2.1.6 Plasmids

pUAST (Brand and Perrimon, 1993)

pBluescript KS(+) & KS(-) (Stratagene)

pSP64 (Promega)

pFLC1 (BDGP)

pOT2 (BDGP)

2XPEe pCaSperAUGβGal (Jiang and Levine, 1993)

2.1.7 Computer software, digital photography and sectioning

Digital pictures were taken using an Axiophot Photomikroscop (Zeiss) with the ProgRes

3008 (Kontron Elektronik) or Axiocam MRc5 (Zeiss) camera. The latter camera used the

Axiovision Release 4.4 imaging software. Pictures were edited using Adobe Photoshop

(Adobe Systems) software. Figures were drawn using Canvas 8.0 and 9.0 (Deneba

Systems) software. DNA sequence alignments and analysis were carried out using the

(26)

DNA Strider 1.2 software while oligonucleotide design was done using Amplify 1.2 and Primer3. Embryos were sectioned on a Leica RM2065 microtome, using glass blades. In order to predict transcription factor binding sites, the genomatix matinspector software was used. The promoter prediction was done using the genomatix gene2promoter software.

2.2 Methods

All molecular biology techniques were according to Sambrook et al., 1989.

2.2.1 Genomic Sequence, EST, expression pattern and fly stock searches Searches for annotated Drosophila genomic sequences, Drosophila ESTs and Drosophila deficiency and P-element insertion strains were conducted using Flybase (http://flybase.bio.indiana.edu/). EST and cDNA sequences were obtained from BDGP (http://www.fruitfly.org/EST/index.shtml). The mRNA expression pattern of genes were analysed from the BDGP in situ resource (http://www.fruitfly.org/cgi-bin/ex/insitu.pl).

2.2.2 Generating Drosdel deletions

Information on the crosses performed to construct deletions are given at the Drosdel website at http://131.111.146.35/~pseq/drosdel/ddinfo.html (Ryder et al., 2004) and is according to the method described by Golic and Golic, 1996. In summary, the respective forward and reverse FRT carrying P element fly stocks used to generate the deletion were crossed to each other, so as to bring both elements in the same individual. The cross was performed in a FLPase enzyme background, which facilitates recombination between the FRT sites. Embryos from such a cross were heat shocked at 37

0

C for 30 minutes to facilitate recombination. Such heat shocked embryos were allowed to develop and adult flies having mosaic eyes (indicating recombination) were crossed to isogenized balancer stocks. In the next generation, by selecting for the eye colour marker, recombinant events and thus deficiency or duplication events were recovered and stocks were established.

The deficiencies were confirmed by complementation and at least five stocks were tested

(27)

for each individual deficiency. From these, one that did not complement lethal alleles in the region was selected and maintained as stock.

2.2.3 Drosophila nomenclature

All fly nomenclature used is according to Lindsley and Zimm, 1992.

Dp(2;2)B3 is a tandem duplication. Its break points include 23E2-3; 26E2-F1 on the cytological map (Lindsley and Zimm, 1992; Szidonya and Reuter, 1988). It was recovered as trans suppressor of Df(2L)M24F11.

Dp(2;1)B19 is an inversted insertional transposition. Its break points include 24D4; 25F2;

9B14-C1 on the cytological map (Lindsley and Zimm, 1992; Szidonya and Reuter, 1988).

It is homozygous viable and female sterile.

2.2.4 Fly maintenance, embryo collection and fixation

The flies were maintained under standard conditions (Ashburner, 1989; Wieschaus and Nuesslein-Volhard, 1986).

To fix the embryos, properly staged embryos were collected on an apple juice – agar plate, dechorionated using 50% bleach and washed in tap water. Embryos were fixed in 4% Formaldehyde in PBS (Sambrook et al., 1989): heptane = 1:1 solution at 37

0

C for 20 minutes, with vigorous shaking followed by devitellinization with methanol:heptane = 1:1 solution by vortexing for half a minute. Embryos were washed several times in methanol and stored in methanol at -20

0

C if not used immediately.

2.2.5 Antibody staining of embryos

The fixed embryos were rehydrated in PBST, followed by one hour blocking at room

temperature using 5% BSA in PBST. The liquid phase was taken off and the primary

antibody was added. The reaction was left at 4

0

C overnight, on a rotating wheel. Embryos

were washed with PBST several times, at room temperature followed by incubation in

secondary antibody (biotin labeled) at room temperature for 90 minutes. The secondary

antibody was washed away by PBST. In the mean time, the ABC mix (ABC kit, Linaris

Biologische Produkte GmbH) was prepared to a dilution of 1:100 in PBST. After the

(28)

embryos were washed thoroughly, the ABC mix was added to the embryos and incubated on a rotating wheel. After 30 minutes, the reagent was washed away and the antibody was detected by adding 20% DAB (1mg/ml stock solution) and 0.3% H

2

O

2

(30% stock).

To remove the peroxidase, 3% H

2

O

2

was added and incubated for 20 minutes. After the peroxidase was washed away, a second round of antibody staining was done, if needed, as described above.

2.2.6 In situ hybridization

RNA in situ hybridization was performed according to Tautz and Pfeifle, 1989. To generate probes, the plasmid containing the cDNA sequence was digested and purified.

This was used as the template in an in vitro transcription reaction containing 2µl DIG 10X RNA labelling mix (Roche), 2µl transcription buffer, 2µl 0.1M DTT, 0.8µl RNasin (Promega), 2µl SP6, T7 or T3 RNA polymerase and incubated at 37

0

C for 2 hours. The reaction was stopped by incubation on ice; 80µl of pre-hybridization mix (50% deionized formamide, 25% 20X SSC pH 7.0, 0.5% tRNA 20mg/ml, 1% ssDNA 10mg/ml, 0.05%

heparin 100mg/ml, 0.1% Tween20 in water) was added to make a dilution of 1 in 5.

Fixed embryos were rehydrated in PBST (0.2% Tween20 in water), treated with

formaldehyde to fix again, treated with proteinase K for 30 seconds to permeabilize and

fixed once more. Several washes in PBST were performed at each step. Embryos were

pre-hybridized in pre-hybridization mix for 2 hours at 56

0

C, followed by overnight

hybridization with the probe at 1:500 dilution, at 56

0

C. After incubation, the free probe

was washed away by incubating the embryos in a decreasing concentration of pre-

hybridization mix, at 56

0

C. The embryos were then washed and treated with the anti-DIG

antibody conjugated with AP (1:500, Roche) for 1 hour at room temeperature. The

antibody was discarded and the embryos washed several times in PBST. The signal was

visualized using 1%NBT (10mg/ml Nitro blue tetrazolium in 70% Dimethylformamide)

and 1% X-Phospate solution (10mg/ml 5-bromo-4-chloro-indoxylphosphate in

Dimethylformamide) in staining buffer (100mM Na

2

CO

3

pH 9.5 or 50mM Tris-Hcl

pH9.5, 2mM MgCl

2

, 0.1% Tween20).

(29)

2.2.7 Embedding and sectioning of stained embryos

Stained embryos were dehydrated in 30%, 50%, 70%, 80%, 90%, 95% and 100%

(absolute ethanol treated with molecular Sieves, Sigma M-2010, 1/8 inch pellets) ethanol.

After dehydration, 100% acetone (treated same as absolute ethanol) was added for 15 minutes, followed by a mixture of 50% acetone and 50% Araldite (57.4g CY212 Araldite with 48g HY964 Hardener were mixed thoroughly first and then 2ml 2,4,6- Tris (dimethylaminomethyl) phenol was added and mixed). The mixture containing the embryos was transferred to a shallow plastic lid and the acetone was allowed to evaporate under the hood.

Embryos were arranged in an araldite block for sectioning and the block was allowed to polymerize at 50

0

C overnight. Sections were made on the Leica RM2065 microtome.

2.2.8 Single embryo PCR

Embryos were collected as described before on an apple juice-agar plate and fixed.

Individual embryos were dispensed in 10µl volume of a solution containing 10mM Tris- HCl pH 8.2, 1mM EDTA and 25mM NaCl and frozen. After a minimum of 30 minutes, the embryos were thawed and added 0.2µl Proteinase K (200µg/ml stock solution). The embryos were incubated at 37

0

C for 30 minutes followed by 95

0

C for 2 minutes for heat inactivation of the Proteinase K. 1µl of this extract was used as the template for PCR reactions.

The PCR was carried out in a UNO Thermoblock (Biometra). The reaction components

were: 20pmols of each primer, 10mM dNTP, 10X PCR buffer without Mg

2+

(supplier),

2.5mM Mg

2+

and 0.25µl of High Fidelity Taq Polymerase (Expand High Fidelity PCR

system from Roche) in a 25µl PCR reaction mix. The PCR programme included a

denaturation step of 3 minutes at 94

0

C followed by 35 cycles: 30 seconds at 94

0

C, 1

minute at 50

0

C the annealing temperature, 3 minutes at 72

0

C the extension temperature

and ending with a final extension of 10 minutes at 72

0

C. The PCR products were

analysed on a 1% agarose gel.

(30)

2.2.9 Molecular cloning

The 2XPEe Traf1 construct was generated by PCR amplifying the Traf1 cDNA in pBSK (LD20987) using the primers TrafFBH1 and TrafRXb1, digesting with Xba1 and BamH1 and ligating into the same sites of the 2XPEe pCaSperAUGβGal vector.

The pUAST wengen construct was generated by digesting the wengen cDNA in pFLC1 (RE29502) with EcoR1 and BamH1. The resultant fragment was cloned into pUAST at the Bgl2 and EcoR1 sites.

Traf1 was subcloned into the pSP64 vector. This was done by digesting the PCR fragment generated by the primers TrafFBH1 and TrafRXb1 using Traf1 cDNA in pBSK as template, with BamH1 which digests only at the 3’. The resulting 5’ blunt, 3’

staggered fragment was cloned into the BamH1 and Sma1 sites of pSP64 and called pSP64Traf1FL1.

Using pSP64Traf1FL as template, PCR was performed with primers HABamF and TrafRXb1 and the resulting product digested with Xba1 and BamH1. This fragment was ligated into pUAST using the Bgl2 and Xba1 sites to generate full length Traf1 in pUAST.

Traf1 was again subcloned into the pSP64 vector by digesting the PCR fragment generated by the primers TrafHind3F and TrafRXb1 using Traf1 cDNA in pBSK as template, with Hind3 and BamH1. The resulting fragment was cloned into the Hind3 and BamH1 sites of pSP64 and called pSP64Traf1FL2.

Using pSP64Traf1FL2 as template, PCR was performed with Traf804Xho1F and HAXbaR primers. The resultant product was digested with Xho1 and Xba1 and ligated into the same sites in pUAST to generate Traf1∆N-Exon1 in pUAST.

Using pSP64Traf1FL2 as template, PCR was performed with Traf1009Xho1F and HAXbaR primers. The resultant product was digested with Xho1 and Xba1 and ligated into the same sites in pUAST to generate Traf1∆N-Exon1+Zincfingers in pUAST.

Traf1 was again subcloned into the pSP64 vector by digesting the Traf1 cDNA in pBSK

with BamH1 and removing the protruding 5’ terminus by Mung Bean Nuclease

(31)

treatment. Then it was cut with Xho1 and cloned into Sma1-Sal1 digested pSP64. This was called pSP64Traf1FL3.

Using pSP64Traf1FL3 as template, PCR was performed with primers HABamF and Traf1011XhR. The resultant product was digested with Xho1 and BamH1 and cloned into Xho1- Bgl2 digested pUAST, to generate pUAST∆C-Trafdomain.

Using pSP64Traf1FL as template, PCR was performed with primers HANot1F and Traf804Xho1R. The resulting product was digested with Not1 and Xho1. This fragment was ligated into pUAST using the Not1 and Xho1 sites to generate pUAST∆C- Trafdomain+Zincfingers.

2.2.10 Generating transgenic flies

Transgenic flies were generated by DNA microinjection into blastoderm stage embryos according to Spradling and Rubin (Rubin and Spradling, 1982; Spradling and Rubin, 1982). The injected embryos were allowed to develop into flies and these were crossed to balancer stocks which were w

-

. In the next generation, flies with coloured eyes were selected and stocks were established from about 20-25 such insertions. Stocks were maintained balanced or homozygous.

2.2.11 DNA Sequencing

DNA sequencing was carried out on an ABI sequencer using Big Dye Terminator kit from Perkin Elmer.

2.2.12 RT-PCR

RNA was extracted from adult flies using the Trizol reagent (Invitrogen) as

recommended by the manufacturer. First strand synthesis was carried out using the

Cloned AMV First-Strand cDNA Synthesis Kit (Invitrogen) and PCR was performed as

recommended by the manufacturer.

(32)

3. Results

3.1 The deficiency Df(2L)ed-dp embryos show gastrulation defects

In order to allow the mapping of the gene or genes responsible for gastrulation in the region identified by T.Seher (Seher and Leptin, 2000; thesis, Seher), embryos were collected from deficiencies in the region and the gastrulation phenotype observed.

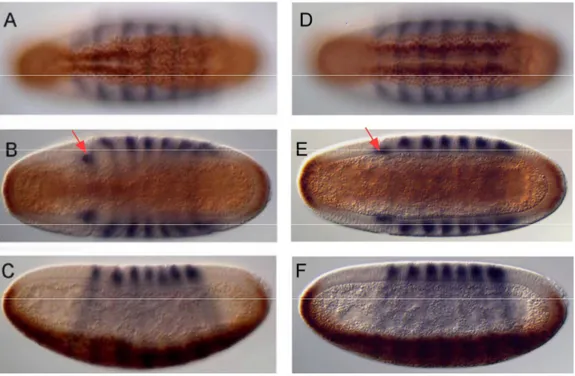
Embryos from a cross between Df(2L)ed-dp heterozygous males and females were collected, fixed and stained with anti-Twist and anti-Even skipped antibodies (Figure 5A- F). Twist stains the mesoderm and helps to track ventral furrow formation whereas Eve is a pair rule gene, expressed in seven stripes from the anterior to the posterior of the embryo which serves as a marker to determine the age of the embryo.

Figure 5: Whole mount preparations of stage 6 embryos stained with anti-Twi and anti-Eve

antibodies. A, B and C – Df(2L)ed-dp embryo; D, E and F – wild type embryo of corresponding age. A, D-

Ventral view of Df(2L)ed-dp embryo showing the delayed ventral furrow invagination (A) and wild type

embryo showing fully formed furrow at the same stage (D). B, E- Ventral view of Df(2L)ed-dp (B) and

wild type (E) embryos in a slightly different focal plane showing the cephalic furrow and the first Eve

stripe (arrow heads). C, F- Lateral view of Df(2L)ed-dp (C) and wild type (F) embryos showing mesoderm

invagination. Anterior is to the left in all embryos and dorsal is towards the top in C and F.

Abbildung

Figure  2:  A  schematic  representing  the  known  maternal  and  zygotic  molecules  involved  in  ventral  furrow  formation:  A  ventral  cell  undergoing  cell  shape  changes  in  the  process  of  furrow  formation  is  represented, with the grey ov
Figure 3: Schematic representing chromosomal segregation in a compound autosomal stock
Figure 4: Schematic showing the chromosomal segregation pattern in a cross between the compound  stock females and a translocation stock
Figure  5:  Whole  mount  preparations  of  stage  6  embryos  stained  with  anti-Twi  and  anti-Eve  antibodies
+7

Referenzen

ÄHNLICHE DOKUMENTE

In conclusion, this project allowed to identify several candidate genes using microdissected tissues to not only provide global information on gene expression

Accumulating evidence, however, suggests that the mechanosensory cells have evolved from a common ancestral cell [Fritsch & Beisel 2004]: The mechanosensory cells of

Subsequently, the parallel reporter gene assays were used to quantify the regulatory activity of chromatin elements with predictive features of regulatory function at SNPs within

The Swiss Federal Electricity Commis- sion (ElCom) and the Swiss Federal Office of Energy (SFOE) have decided to conduct a joint consul- tation concerning the question of a

Correlation analysis of an allele and the flowering time phenotype Allele sequences of the progeny of the mapping population GF.GA-47-42 x ‘Villard Blanc’.. were compared against

MDD patients carrying the short (s) allele of the 5 HTTLPR showed increased brain serotonin turnover compared to those carrying the long (l) allele at this locus (Barton et al.,

After identifying the genes that showed a difference in expression between skin samples of the different color morphs of PS, we used qRT-PCR to confirm and expand upon the results

Differential Expression of SSH Candidates in Developing Swords and Gonopodia and Regenerating Caudal Fins Our gene expression analyses of seven clones from