Method development and application of Next Generation Sequencing in forward genetics
Inaugural-Dissertation zur Erlangung des Doktorgrades
der Mathematisch-Naturwissenschaftlichen Fakultät der Universität zu Köln
vorgelegt von
Geo Velikkakam James
aus Kerala, India
Köln, November 2013
2
Die vorliegende Arbeit wurde am Max-Planck-Institut für Züchtungsforschung in Köln in der Abteilung für Entwicklungsbiologie der Pflanzen (Direktor Prof. Dr.
George Coupland) angefertigt.
Berichterstatter:
Prof. Dr. George Coupland Prof. Dr. Thomas Wiehe Prüfungsvorsitzender:
Prof. Dr. Martin Hülskamp
Tag der Disputation: Januar 2014
4
“Well done is better than well said”
Dedicated to my love and family
6
Content
Chapter 1. Introduction 15
1.1. Changes brought by Next Generation Sequencing 17
1.2. NGS enabled forward genetics 19
1.3. Guidelines for mapping-by-sequencing 22
1.4. Reference free NGS enabled mapping methods 23
Chapter 2. Fast Isogenic Mapping-by-Sequencing of Ethyl
Methanesulfonate-Induced Mutant Bulks 25
2.1. Introduction 27
2.2. Materials and Methods 31
2.2.1. Sequenced material and SNP identification 31
2.2.2. Targeted deep resequencing of individual mutations 32
2.3. Results 33
2.3.1. Analysis of isogenic mapping population for mutant identification 33
2.3.2. dCARE identifies causal change 34
Chapter 3. User guide for mapping-by-sequencing in
Arabidopsis thaliana 39
3.1. Introduction 41
3.2. Materials and Methods 45
3.2.1. Simulation of recombinant populations by Pop simulator 45 3.2.2. Simulation of whole-genome sequencing by Seq simulator 46
3.2.3. Selection of homozygous mutations 47
3.2.4. High quality marker selection for outcross simulation 48
3.2.5. Simulation of mapping-by-sequencing 48
3.2.6. Comparison of single-end and paired-end sequencing 48
3.2.7. Availability of simulation pipeline 49
8
3.3. Results 50
3.3.1. Paired-end versus single-end sequencing 50
3.3.2. In-silico mapping-by-sequencing experiments 52 3.3.3. Application of mapping-by-sequencing simulations in model crop species 65
Chapter 4. Mapping-by-sequencing in non-model organism 69
4.1. Introduction 71
4.2. Materials and Methods 75
4.2.1. A. alpina mutant sequencing 75
4.2.2. Resequencing analysis of A. alpina mutants and SNP calling using mediator
genome 76
4.2.3. SNP calling using NIKS in A. alpina mutants 76
4.2.4. Annotation of mutant SNPs 77
4.3. Results 78
4.3.1. Comparison of NIKS and comparative genomic approach with mediator
genome for pep1-1 and fde1 mutations 78
4.3.2. Annotation of candidate mutations in pep1-1 and fde1 80
Chapter 5. Discussion 83
5.1. Mutant mapping using isogenic background 83
5.2. Simulating virtual genomes and mapping-by-sequencing: Tool and lessons
learned. 85
5.3. Mapping-by-sequencing in Crops 88
5.4. Further challenges in mapping-by-sequencing 90
Literature cited 95
Appendix Notes 109
Appendix Table 115
List of abbreviations
Bp Base pair(s)
kb Kilobases
Mb Megabases
Gb Gigabases
CAMs Candidate mutations
dCARE Deep candidate resequencing
PcG Polycomb group
FNR Fast-neutron radiated
Chr Chromosome
Pos Position
QTL Quantitative trait loci
RIL Recombinant inbred line
NIL Near isogenic lines
MAGIC Multiparent advanced generation inter-cross AMPRIL Arabidopsis multiparent RIL
EMS Ethyl-methanesulfonate
NGS Next generation sequencing
BSA Bulk segregant analysis
10
Abstract
Forward genetic screens remain one of the main genetic tools to characterize gene functions in plants. Recent advances in Next Generation Sequencing (NGS) technology have greatly reduced the time required for mutant identification in forward genetic screening. The major advantage of NGS enabled mapping, known as mapping-by-sequencing, is the simultaneous marker identification and genotyping and identification of the genomic loci causing phenotypes. We have been among the first to show that mapping-by-sequencing can be performed even within the same genetic background using mutagen-induced changes as segregating markers. As a proof of this concept, we mapped a previously unknown suppressor of like heterochromatin protein1 (lhp1) mutant. We developed a computational pipeline for the same and integrated it into an existing mapping-by-sequencing pipeline called SHOREmap.
Though mapping-by-sequencing is now being routinely used, less effort has been put
in optimizing the experimental set-up. Therefore, we developed new computational
pipeline called Pop-Seq simulator that can simulate different mapping populations
and sequencing experiments. It simulates recombinant genomes by following
empirical determined recombination frequency and landscape, which make
simulations close to reality. Using Pop-Seq simulator we simulated different
mapping-by-sequencing scenarios and created guidelines for mapping-by-sequencing
experiments in Arabidopsis. Although mapping-by-sequencing has already become a
standard method in Arabidopsis, the application in crops is hindered by the large
genome sizes and the lack of complete reference genomes. Therefore, we have used
the Pop-Seq simulator to extend our analysis on the experimental design of mapping-
by-sequencing to two crop model species, rice and barley, in which next generation
sequencing-based mapping becomes tangible reality. Besides, we have developed a
reference-free method called NIKS (needle in the k-stack) that enables mapping-by-
sequencing in species without pre-assembled reference sequence, gene annotation, or
genetic map. NIKS directly compares genomes using k-mers from whole genome
sequencing data to identify homozygous mutations and extend the sequence
associated with mutation site by local de novo assembly. We have used ab initio gene
structural prediction to annotate the effect of mutations, which led us to the
12
identification of causal mutation. This method will facilitate mapping-by-sequencing
in non-model species.
Zusammenfassung
Vorwärts genetische Verfahren sind in der Pflanzengenetik eine der wichtigsten Methoden zur Identifizierung von Genen und ihrer Funktion. Jüngste Fortschritte in der Sequenziertechnik der nächsten Generation (engl. Next Generation Sequencing (NGS)) haben den Zeitaufwand für die Kartierung von Mutationen mittels vorwärts genetischer Verfahren drastisch reduziert. Eine neue Methode, die auch als Kartierung durch Sequenzierung (engl. Mapping-by-sequencing) bezeichnet wird, ermöglicht nun die simultane Identifizierung und Genotypisierung von Markern. Diese werden benötigt um die genomische Region, die einem Phänotypen zugrunde liegt, zu bestimmen. Wir waren unter den Ersten die gezeigt haben, dass Kartierung durch Sequenzierung im selben genetischen Hintergrund mittels Mutagen induzierter Marker durchgeführt werden kann. Dies konnten wir anhand der bereits bekannten Suppressions Mutante like heterochromatin protein1 (lhp1) nachweisen. Für die Kartierung haben wir eine Pipeline zusammengestellt welche nun in SHOREmap integriert ist.
Obwohl Kartierung durch Sequenzierung ein routinemäßig eingesetztes Verfahren ist, wurde der Optimierung des experimentellen Aufbaus bisher wenig Aufmerksamkeit geschenkt. Aus diesem Grund haben wir eine Simulationssoftware (Pop-Seq Simulator) entwickelt, welche empirisch bestimmte Rekombinationsfrequenzen und – landkarten verwendet und somit realitätsnahe Simulation ermöglicht. Mittels der Simulation von verschiedenen Szenarien, bei denen Kreuzungsschemata und Sequenziertiefe variiert wurden, konnten wir Leitlinien für verschiedene experimentelle Setups in Arabidopsis erstellen. Auch wenn Kartierung durch Sequenzierung mittlerweile in Arabdopsis Standard ist, ist die Verwendung dieser Methode in Kulturpflanzen durch vielfach größere Genome und das Fehlen vollständiger Referenzgenomsequenzen erschwert. Aus diesem Grund haben wir unsere Analysen auf zwei Kulturpflanzen in denen Kartierung durch Sequenzierung schon jetzt möglich ist, Gerste und Reis, erweitert, um auch in diesen optimale experimentelle Setups zu bestimmen. Darüberhinaus haben wir mit NIKS (engl.
Needle In the K-Stack) eine Methode entwickelt, die nicht auf einer
Referenzgenomsequenz, Genannotation oder genetische Karte beruht. NIKS
vergleicht Genome mittels k-mers aus NGS Daten, wobei homozygote Mutationen
mittels lokalen Assemblies der Region gefunden werden. Im Anschluss werden
14
Genstruktur und Annotation vorhergesagt, welche die Bestimmung der kausalen
Mutation ermöglichen. Durch diese Verallgemeinerung der Methode wird die
Anwendung von Kartierung durch Sequenzierung über die Grenzen von
Modellorganismen ermöglicht.
Chapter 1. Introduction
The genetic screens to identify the gene responsible for phenotypic variation have been a common task in genetics. In plants, identification of genes contributing to the variations in phenotype has great deal of implications not only in understanding fundamental processes but also for the betterment of crop (Rafalski, 2010). Genetic screens systematically associate observable characteristics or traits (known as phenotype) and the genetic make-up (known as genotype). During the course of time, different strategies have been deployed and these strategies have largely been classified into two major groups, forward and reverse genetics. Forward genetic screens select for a phenotype associated with a biological process and identify the genetic region contributing to the phenotype. Whereas reverse genetics screen select a gene of interest and analyze mutant of the gene in order to identify the process it has been involved with (Page and Grossniklaus, 2002; Alonso and Ecker, 2006).
The environment where the screen been conducted has influence on traits and higher the heritability of a trait, lesser is the influence of environment on phenotype (Paterson et al., 1991; Mauricio, 2001; Collard et al., 2005). Therefore, accurate genetic screen requires simultaneous recording of environment, phenotype and genotype. The fact that forward genetics allows the direct analysis of a biological process of interest without any prerequisite knowledge. The process of forward genetics screens start with random mutagenesis to introduce genetic variations that occasionally lead to phenotypes of interest. Subsequently, mapping localizes genetic element responsible for the phenotype.
Mapping experiments can be summarized as; first, identification of
polymorphic markers between parental lines. Second, generation of segregating
mapping population by crossing a parent with phenotype of interest to a suitable wild
type parent. Finally, genotyping the mapping population at each marker position and
associating phenotype to genotype in order to identify causal genetic region, known as
mapping interval. This may further require fine mapping to reduce the genetic region
under probe by using more segregant and even more markers, if available. If genome-
wide information such as whole genome sequence and gene annotation is available,
this could be utilized to pinpoint the candidate genes within the mapping interval.
16
Short life cycle, self-compatibility and relatively easy to be grown in a greenhouse has made Arabidopsis thaliana, a member of Brassicaceae family, a widely accepted model species in plant science (Meinke et al., 1998; Somerville and Koornneef, 2002; Koornneef and Meinke, 2010). Moreover, features like foremost sequenced genome with a stable assembly, comparatively well annotated and characterized genes and amenability to forward genetic screen has made Arabidopsis a model system of choice for plant biologist.
Traditionally, mapping populations are derived from biparental cross between phenotypically diverged parents in order to map phenotype of interest. The primary mapping population derived from such a cross is F
2progenies, facilitating uneven phenotype. The underlying genetic segregation causes such an uneven trait in F
2, which is utilized during mapping by associating the fixed allele within a group of progeny having phenotype under selection. In other words, by classifying the mapping populations into groups with same phenotype and by pooling DNA from group with phenotype of interest, mutation underlying the phenotype, as well as the closely linked genetic region will be selected. Thus, in case of a recessive phenotype the mutant region will be homozygous. On the other hand, due to recombination and independent chromosome assortment in each pooled plant, regions unlinked to mutation have equal likelihood to have both alleles, hence heterozygous in the pool.
Thus, the allele frequency at and near the mutation will be one (all alleles are the same), and this frequency will gradually decline to the random expected frequency of 0.5 with increasing genetic distance from the mutation. This way of analysis is known as Bulk Segregant analysis (BSA) (Michelmore et al., 1991).
BSA was first utilized in mapping resistant gene in lettuce by grouping
mapping population into resistance and susceptible groups. Later this method became
common for the phenotype with discrete groups. On the other hand, when the
phenotype are complex, continuous and contributed from multiple loci, method called
quantitative trait locus (QTL) mapping is used (Falconer and Mackay, 1996; Kearsey,
1998). In QTL mapping, each segregant plants are genotyped and phenotyped
separately to associate genomic loci and their contributions to phenotype (reviewed
by (Collard et al., 2005)). Depending on the objective, advanced mapping populations
were created by either selfing or backcrossing to produce recombinant inbred line
(RIL) or near-isogenic lines (NIL), respectively. In RILs, heterogeneous homozygous
genome state is obtained by several round of selfing. Whereas in NILs, repeated
backcrosses are done to introgress homozygous alleles from one parent to second parental background. Recently in Arabidopsis and in other plant species, advanced mapping populations, such as MAGIC (Multiparent Advanced Generation Inter- Cross) and AMPRIL (Arabidopsis multiparent RIL), were introduced by using multiple parental lines and complex crossing schemes to increase the power of mapping (Kover et al., 2009; Huang et al., 2011). AMPRIL crossing scheme represents the founder lines evenly, whereas MAGIC consists of more recombination events per lines (Weigel, 2012). As both designs consists of multiple parents that aids to study epistatic effects as well as is likely to generate unnatural allelic combinations.
Together with these new methods of generating mapping populations, revolution in both genotyping and up to certain extent phenotyping made the mapping process faster and powerful than ever. Due to revolution in DNA sequencing, marker discovery and genotyping has gained tremendous speed and throughput in last decade and brought up new framework of Next Generation Sequencing (NGS) integrated approaches in mapping (Varshney et al., 2011).
1.1. Changes brought by Next Generation Sequencing
During last century, plant breading has made remarkable progress in crop
improvement by utilizing molecular markers and appropriate statistical methods, 21
stcentury has even more to contribute with new developments in sequencing and
associated methods (Collard and Mackill, 2008). Last decade has witnessed the
revolution in DNA sequencing method from Sanger chain-termination technology to
pyrosequencing or sequencing by synthesis methods by Roche and Illumina (Sanger
et al., 1977; http://www.454.com/; http://www.illumina.com; reviewed by Wall et al.,
2009; L., Liu et al., 2012) The transition was massive, as the technology which served
for decades had only few kb per run compared to more than million-throughput in
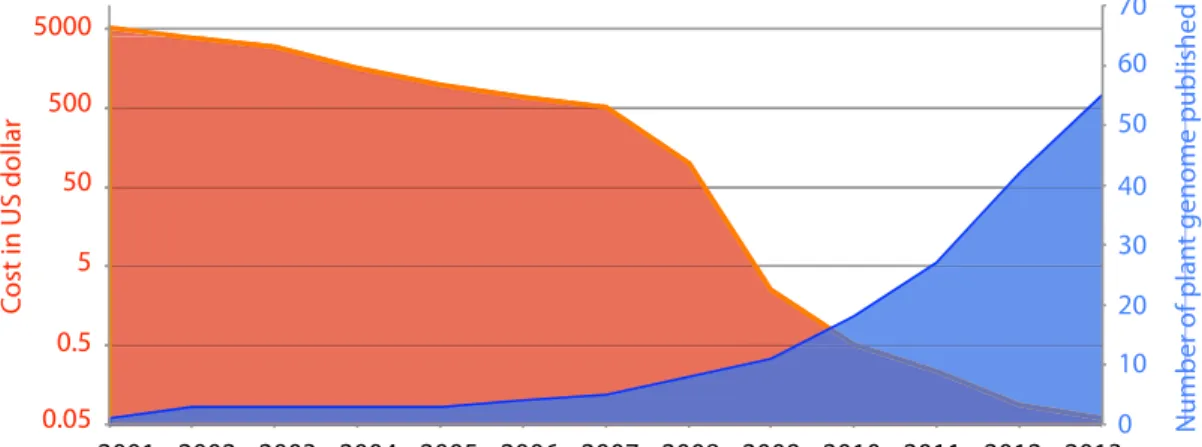
new technology. Moreover the cost per base pair got reduced during the course of
time, encouraging more sequencing project than ever before (Figure 1). Roche and
Illumina have now several platforms with different throughputs to serve various
needs. Illumina platform is known for the high throughput of ~6 billion per run with
relatively short read length of 100- 300 bp (http://www.illumina.com). On the other
hand, Roche has longer read length up to 1000 bp but comparatively lower throughput
of ~1 million reads per run (http://www.454.com/). Recently introduced Ion Torrent
18
therefore apt for specific uses (http://www.lifetechnologies.com). Recent development of sequencing from a single molecule without any pre-amplification step provides longer reads with an average size of 3 kb but with lower throughput (http://www.pacificbiosciences.com). While longer reads as well as signal from an unbiased molecule is promising, current error rate of 11-14% hamper the utility of this method alone and requires support information from another platform (Roberts et al., 2013). The other exciting but non-commercialized technologies like Nanopore sequencing, suggests that the advancement of DNA sequencing is still on its peak, and is projected to grow further. There are many more technologies, which are not mentioned above. Further comparisons between technologies have been published in various comparative studies (Liu et al., 2012; Quail et al., 2012; Jünemann et al., 2013).
Figure 1: Improvement in DNA sequencing over the years. With NGS, cost per Mb of DNA sequencing (Red y-axis, Data from www.genome.gov/sequencingcosts) has decreased unprecedentedly and together with increase in throughput, the number of published plant species genome has increased (Blue y-axis).
The throughput of NGS has revolutionized many biological fields, including
genetics and genomics. The growing sequencing throughput, has not only opened the
door for the sequencing more samples but has also changed the way forward genetics
has been conducted and practiced. The speed and throughput of NGS, has not only
stimulated the whole genome sequencing projects but also resequencing projects, to
investigate natural variations between accessions/ecotype. The number of plant
species being sequenced is growing in a great speed as the cost per base pair is
reducing (Figure 1). This momentum to generate more genomic resources with
respect to sequencing has got attention in non-model organisms as well (Tautz and Domazet-Lošo, 2011; Varshney et al., 2011). Simultaneously, resequencing projects like 1001 Arabidopsis genome project (http://1001genomes.org), where the whole genome sequencing of multiple accessions/ecotypes has given rise to rich data sets of natural variations that have direct implication in genomic studies such as whole genome profiling (WSP) and genome wide association studies (GWA) (Nordborg and Weigel, 2008; Weigel, 2012).
Other than whole genome sequencing and resequencing, NGS has improved other biological study fields such as expression analysis, direct identification of DNA binding site (Chip-seq) or DNA methylation pattern identification, just to name a few.
Most of the mentioned techniques are still under optimization and have recently been the subject of extensive studies to explore the utility of each or combined methods, which were not possible to carry out at all or in genome-wide scale before NGS.
1.2. NGS enabled forward genetics
In forward genetics, genetic mechanism of a phenotype is studied by introducing random mutations artificially by means of either chemicals or radiation, and plants showing phenotype of interest are selected to raise a mapping population.
The aim of mutagenesis is to introduce maximal genomic variation with minimal
reduction in viability and by screening this population, traits that are almost
impossible to identify by conventional breeding are being developed and
characterized at the molecular level (Sikora et al., 2012). In order to pinpoint the
molecular identity of the mutant, positional cloning is commonly employed with the
help of available genomic information (Lukowitz et al., 2000). However, the
positional cloning of mutants can be time consuming because of lower recombination
rates in the region. Feasibility of resequencing and recent developments in marker
discovery and genotyping due to the up-rise in DNA sequencing methods has brought
up new framework of NGS integrated mapping approaches. The major advantage of
so called, mapping-by-sequencing, is the simultaneous discovery of segregating
markers in the mapping population and genotype to identify mapping interval that
contribute to phenotype. Finally, using the same data together with gene annotation,
effect of mutation on gene function is predicted to pinpoint candidate genes. Hence,
mapping-by-sequencing merges three steps that were required previously to one, thus
20
Mapping-by-sequencing consists of multiple intermediate bioinformatic analysis, mainly comprising of resequencing analysis. Soon after the sequencing, base calling is done by converting the raw images of sequencing to bases with quality score. Different sequencing platforms use separate in-build pipelines for base calling.
Phred scoring is the generally accepted quality scale in sequencing and represents log- transformed error probability at every base pair.
where Q is phred quality score and P is estimated error probability (Ewing and Green, 1998). Shotgun sequencing is prone to have sequencing error and vary in magnitude and profile based on the sequencing platform. For example, base qualities towards the end of reads get reduced in case of Illumina platform (Nakamura et al., 2011).
Therefore, it is necessary to remove the sequencing-specific artifacts such as poor quality reads, low base call and adaptor contamination, before starting resequencing analysis. The quality filtered reads are aligned to the reference genome in order to identify the genetic variations in the sequenced genome. There are multiple alignment tools available for general and specific use, depending on the sequencing platform and the type of reads. Most of the alignment tools use supplementary data structure called indices, for fast and memory efficient alignment. Majority of alignment tools implement based on either hash table (seed based) or suffix/prefix tree and use it for read sequence or reference sequence, or both. Alignment step is followed by identifying variant in sequenced genome. Different tools use different statistics to identify variation. Generally, there is overlap between the outcomes, though tools provide minor portion of unique variations. Along with other reviews, Pabinger et al.
compiled a comprehensive list of tools and compared their performances (Nielsen et al., 2011; Pabinger et al., 2013). Apart from individual specific tools for specific tasks, pipelines such as SHORE, ngs_backbone, GATK and HugeSeq are few to name, that perform all the tasks sequentially (Ossowski et al., 2008; Blanca et al., 2011; DePristo et al., 2011; Lam et al., 2012).
Despite being slower, “seed” based read alignment methods are preferably
used for such analysis for aligning short reads to reference genome sequence due to
their robustness in identifying polymorphism (Jimenez-Gomez, 2011). Removal of
multiple hit reads as well as duplicate reads helps in the realistic estimation of allele
frequency in a pool. Selection of high quality markers improves the precision in
mapping interval and assists to remove false mapping intervals (Galvão et al., 2012;
Lindner et al., 2012). Filtering variations between sequenced line and reference genome introduces deceptive variations called background mutations. Since background mutations are artifacts of analysis protocol, these are uninformative and needs to be filtered out. Depending on experimental setup, different approaches have been suggested consisting of liberal approach like filtering common markers present in multiple mutants and more conservative approach such as removing mutations present in non-mutagenized progenitor. The disadvantage of last method is the obligatory sequencing of progenitor that is avoidable in first approach (Uchida et al., 2011; Nordström et al., 2013).
The method of integrating BSA with NGS, was introduced in plants by mapping Arabidopsis recessive mutation in AT4G35090 gene from a forward genetic screen using an outcrossed mapping population (Schneeberger, Ossowski, et al., 2009). In this case, segregating markers that were used for mapping, consisted of the natural variations between parents along with mutagen induced mutations. The method developed for this study is called as SHOREmap. Similar computational tools have been successfully developed in other studies to extend the analysis based on web-interface and cloud computing (Austin et al., 2011; Minevich et al., 2012).
In contrast to the initial studies done on an outcrossed population where considerable variation in phenotype may occur, mapping was done in a backcrossed population of Rice and Arabidopsis by crossing mutant plant to non-mutagenized progenitor and mutagen induced variations were used as segregating markers (Abe et al., 2012; Hartwig et al., 2012) (Chapter 2). However, in population derived from backcross, depending on mutagen, the number of segregating markers was typically lower and the average number of short reads at each marker position was usually lower than the number of plants pooled in bulk DNA. This impedes accurate allele frequency estimation, thus fictitiously including nearly fixed mutations as fixed ones.
The identification of causal mutation was possible by identifying the fixed mutation with the help of deep candidate resequencing (dCARE); the true allele frequency estimation in a large bulk DNA by targeted resequencing. This approach displays how different mapping stages can benefit from different sequencing platforms (Chapter 2).
After considerable number of backcrosses, it is even possible to directly resequence
the mutant genome to identify the genetic causal region. However, this approach is
highly time consuming and even after four rounds of backcross, one may end-up with
22
et al., 2011). Nonetheless, direct sequencing approach has the advantage of having mutant genome sequenced for further characterization studies. Availability of multiple alleles for a phenotype makes direct individual resequencing a better option by identifying commonly disturbed genes from both allelic groups (Uchida et al., 2011). In short, the key factors involved in mapping-by-sequencing are A) availability of reference genome, B) size of the genome, C) availability of genetic material such as alleles or mutants, and D) prior knowledge about mapping interval.
1.3. Guidelines for mapping-by-sequencing
All the above different strategies are now routine in forward genetic screening and are becoming replacement of traditional mapping procedure. As the cost of sequencing is going down and the number of organisms having a stable reference genome is increasing, more and more mutant identification by mapping-by- sequencing is being reported (Cuperus et al., 2010; Golas et al., 2013; Schreiber et al., 2012; Tabata et al., 2013). Practical application of mapping-by-sequencing requires decisions on the experimental setup right from generating mapping populations to the adjustment of next generation sequencing reaction. As both, the composition of mapping populations and the amount of sequencing are directly related to time and financial effort, thus it is important to optimize each step of mapping-by-sequencing experiments. However, there is only limited effort to optimize mapping-by-sequencing procedure by suggesting the best practical experimental design for such experiments (Austin et al., 2011). It usually remains unclear what the expected outcome of mapping-by-sequencing experiments could be.
Therefore, this usually leads to conservative decisions resulting in an excess of
mutants and sequencing data. Although, different studies commented on the
experimental design by sub-setting the data analyzed, these conclusions were either
incomplete and may be specific to the given data, or failed to compare different
mapping scenarios (Austin et al., 2011; Abe et al., 2012). A comprehensive study to
suggest guidelines for mapping-by-sequencing should consider the effect of mapping
population as well as sequencing depth on mapping outcome of the experiment along
with other parameters like phenotyping error and availability of allelic groups. We
have studied the effect of crossing scheme and mapping population with help of a
newly developed simulation tool called Pop-Seq simulator, which considers empirical
recombination frequency and landscape. From over 400,000 mapping-by-sequencing
simulations in Arabidopsis, we have studied the expected outcome of given experimental setups (Chapter 3). The utility of Pop-Seq simulator was further showed by realistic mapping-by-sequencing experiment setups in Rice and Barley.
1.4. Reference free NGS enabled mapping methods
However, all the above mentioned methods prerequisite the availability of a reference genome sequence. Though, the number of species having available reference genome sequence is increasing substantially, currently this requirement impedes the applicability of mapping-by-sequencing to larger portion of plant species.
Comparative genomics approaches, like utilizing the genome sequence of closely related species is an alternative or even utilization of partial syntenic blocks as reference genome (Galvão et al., 2012). Nonetheless, the evolutionary distances between species may become critical and are subject to failure due to lack of homology or even absence of genomic region in the closely related genome.
Apparently, a reference free method is needed in order to directly compare
short reads from two samples. An algorithmic framework has been introduced in
plants by mapping genes in Arabis alpina without genetic maps and reference
sequences using k-mers (Chapter 4). The short DNA reads with a length of k (k-mer)
was used to compare between mutant and parent to identify mutations. Subsequently
building up a local assembly followed by ab initio gene structural prediction in order
to predict the effect of mutation at gene level. This method also succeeded in
identifying more mutations than a comparative genomics approach using Arabidopsis
genome as reference.
24
Chapter 2. Fast Isogenic Mapping-by-Sequencing of Ethyl Methanesulfonate-Induced Mutant Bulks
This chapter explains the method for mutant identification by mapping-by-sequencing
in an isogenic population. We demonstrate how mapping-by-sequencing and
candidate gene identification can be performed within the same genetic background
using mutagen-induced changes as segregating markers. As a proof-of-principal, we
mapped the previously unknown suppressor of like heterochromatin protein1 (lhp1)
mutant, from ethyl methanesulfonate (EMS) forward screen by using mutagen-
induced mutations as markers. lhp1 in its functional form is involved in chromatin-
mediated gene repression. As a method to identify the causal mutation from
candidates, we introduced deep candidate resequencing (dCARE) using Ion Torrent
Personal Genome Machine to resolve three linked candidate mutations in the mapping
interval. dCARE reduced the number of causal candidate mutations to one, which was
further confirmed by complementation studies. This study was published under Break
Through Technologies in Plant Physiology 2012 (Hartwig et al., 2012). Appropriate
contents for this chapter are taken from the manuscript. This project was conceived
together by Korbinian Schneeberger and Franziska Turck. Ben Hartwig performed the
mutant screening as well as wet lab confirmation. I performed the analysis of short
read sequences by developing SHOREmap backcross pipeline that was later
integrated to SHOREmap.
26
2.1. Introduction
Recent advances in NGS technology have greatly reduced the time required for mutant identification in forward genetic screening. The major advantage of NGS enabled mapping, known as mapping-by-sequencing, is the simultaneous marker identification and genotyping to identify the genomic region causing phenotype. In plants, mapping-by-sequencing was introduced by mapping a mutant in an outcrossed population between Arabidopsis reference accession Columbia (Col-0) and a diverged accession Landsberg erecta (Ler). Plants with phenotype of interest were bulked and sequenced to identify markers followed by allele frequency to detect mapping region (Schneeberger, Ossowski, et al., 2009). For a recessive phenotype, pooled DNA from plants with phenotype shows homozygous mutation at the causal site. This principal was followed by other studies for successful mapping (Cuperus et al., 2010; Austin et al., 2011).
Although the integrated approach of BSA and resequencing is powerful and extremely fast, crossing with diverged accession to generate mapping population impairs the recognition of mutant with subtle phenotype. Moreover, for genetic screening of suppresser or enhancer of a preexisting mutation, availability of primary mutation in another suitable accession becomes inevitable. If not, this screening has to be first probed for the initial mutation, thus adding more complex and lengthy procedure to mutant identification. An alternative is to remain within the same accession background by backcrossing mutant to parental line. However, this will eliminate the opportunity to use natural variation among parents as markers. Thus, in a population generated by backcrossing mutant to parental line, unknown variations that are introduced by mutagen remain as markers.
Recently in rice, mapping was done using pooled mutants that were
backcrossed to parental line and used provisional reference genome in order to filter
out natural variations (Abe et al., 2012). However, in this case prior knowledge about
candidate gene was used to pinpoint the causal change. Alternatively, in Arabidopsis,
direct sequencing of four times backcrossed mutant genome to parental line produced
103 putative casual mutations that had potential to change 48 putative proteins
(Ashelford et al., 2011). Moreover, these candidate mutations were clustered to two
28
Two major tasks in analyzing mapping-by-sequencing data from a backcross population are; A) identification of mutagen induced variation as markers B) precise estimation of allele frequency in the pool as the number of plants pooled are typically higher than the average number of read count. This concern increases when the mutations are physically close by therefore has lower likelihood of conceiving recombination in between, thus results to delicate difference in allele frequency.
We have developed a backcross analysis pipeline and have integrated into
existing SHOREmap tool. The identification of mutagen-induced variations was done
by filtering out the markers identified in the genome of non-mutagenized parent. The
putative candidate casual mutations were further analyzed in detail with deep
candidate resequencing (dCARE) (Figure 2.1). dCARE involves targeted sequencing
of bulk segregant DNA. As a proof-of-concept, we applied this method to screen
suppressor of like heterochromatin protein1 (lhp1) mutant. The pleiotropic phenotype
of lhp1 mutant plants differs quantitatively between accessions such as
Wassilewskija-2 and Col-0, making it difficult to create a robust mapping population
for subtle modifiers. Therefore antagonist of lhp1-1 (alp1;lhp1) double mutant was
backcrossed to original lhp1 allele and F
2offspring of this cross gave 3:1 ratio for
suppresser phenotype, indicating that a single mutation was responsible for the
suppression.
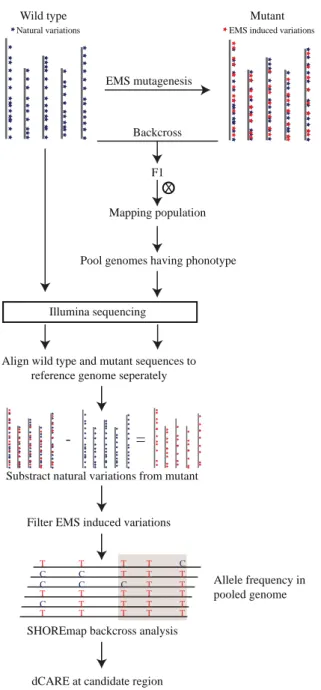
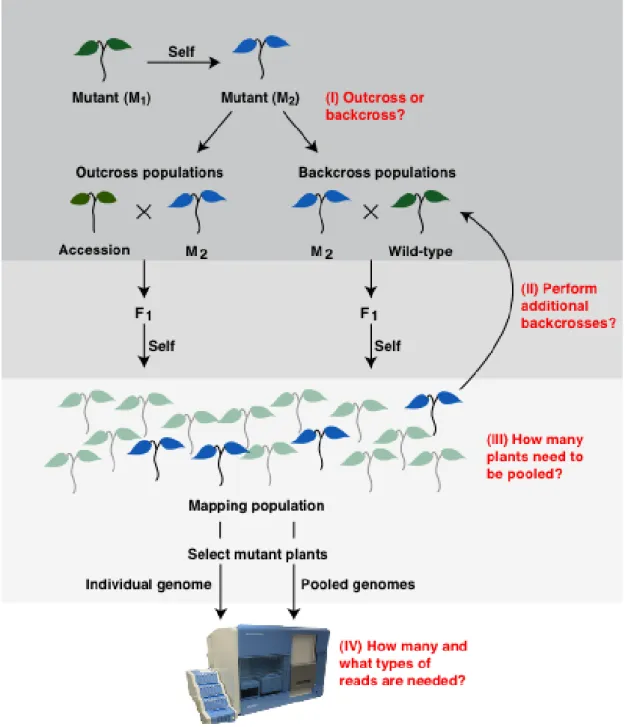
Figure 2.1: Schematic illustration of the fast isogenic mapping approach.
Chemical mutagens typically introduce hundreds of novel mutations. Within the M
2generation, mutants are screened for phenotypes. Selected plants are backcrossed to the nonmutagenized progenitor. The F
2offspring of such a cross forms an isogenic mapping population, as only novel mutations are segregating. Backcrossed individuals that display the mutant phenotype are selected, bulked, and their DNA is prepared as a pool and whole-genome is sequenced. If the parental line is genetically different from the reference line Col-0, it needs to be resequenced in order to filter naturally occurring differences that need to be differentiated from novel mutations.
EMS mutagenesis
Backcross
F1 X Mapping population
Illumina sequencing
Wild type Mutant
Natural variations EMS induced variations
Substract natural variations from mutant
Filter EMS induced variations
- =
SHOREmap backcross analysis T T T T T T
C T T T T T T
T C T T
T T T T T T T T
C T T T T T T T T T T
T T C C T T T T T T
C C T C T
T C C T T T
Allele frequency in pooled genome
dCARE at candidate region Align wild type and mutant sequences to
reference genome seperately
Pool genomes having phonotype
30
Thus, novel EMS-induced mutations can be selected for SHOREmap analysis by
filtering for mutations that do not reside in the parental line (adopted from Hartwig et
al., 2012).
2.2. Materials and Methods
2.2.1. Sequenced material and SNP identification
For the mapping of alp1;lhp1, we have sequenced pooled DNA from leaf samples of 270 BC
2F
2double mutant plants. In parallel, DNA from lhp1 single mutant that was used as parent for this screen, was sequenced. Each reaction of sequencing was done on Illumina Genome Analyzer IIx. Each DNA clone was sequenced twice from both the ends to generate interconnected sequences reads called paired-end. We have generated paired-end reads having 2x 96 bp length for alp1;lhp1 double mutant as well as parental line. We applied short read analysis pipeline, SHORE, for identification of SNPs and short INDELs. Using the function SHORE import, raw reads were trimmed based on quality values with a cutoff Phred score of +38. After import, 43.4 and 42.2 million high-quality reads from lhp1 mutant and alp1;lhp1 double mutant, respectively, were independently aligned to the Col-0 reference genome using GenomeMapper as an alignment tool (Ossowski et al., 2008;
Schneeberger et al., 2009) (Arabidopsis Genome Consortium; The Arabidopsis Information Resource 10). Out of total high-quality reads, 93% and 94% of reads were aligned to the TAIR10 Col-0 reference sequence and yielded an average nucleic genome coverage of 41 and 49 fold for lhp1 and alp1;lhp1, respectively (Table 2.1).
The alignments were corrected for the expected paired-end distance of 300 bp by SHORE correct4pe. We applied SHORE consensus to both sequence sets to identify variations between the mutant and reference genome sequence. The minimum minor allele frequency for SNP calling was kept to 20%. Inbuilt SHORE heterozygous SNP configuration was used for SNP calling. Since the SNPs from lhp1 were the natural variation between mutant line and reference sequence, these SNPs were filtered out from the double mutant to get mutagen-induced mutations. EMS changes (GC:AT) with a SHORE quality score > 24 and supported by more than seven reads, were used in SHOREmap backcross for allele frequency analysis. Allele frequency was calculated as
where C
mand C
tare coverage of mutant allele and total coverage at locus,
respectively. Sequence changes in the region that featured evidence for selection were
32
annotated for their effect on gene identity using TAIR10 gene annotation. See Appendix note I for further details on command line calls for the resequencing and mapping-by-sequencing analysis.
2.2.2. Targeted deep resequencing of individual mutations
Later on the putative candidate mutations were amplified for dCARE analysis by designing primers with the help of Primer3 (version 0.4.0) to amplify 80 to 150 bp amplicons. These amplicons contained the candidate mutations at a distance from +1 to +50 from the 3’ end of the primer that contained the A-type extension required for Ion Torrent PGM sequencing. DNA was amplified from the same pool of DNA as used for whole-genome resequencing. Amplicons were purified and sequenced in an Ion Torrent PGM (Life Technologies) using a 316K chip to a depth of 5,000 to 20,000 reads per amplicon. Allele frequencies of both the wild type and mutant were estimated from raw reads. Using a 21-mer around the mutation site, an ad-hoc script was used to count the allele occurrence with perfect match or one mismatch.
Coverage at each locus was calculated by the sum of satisfying reads from the above criteria.
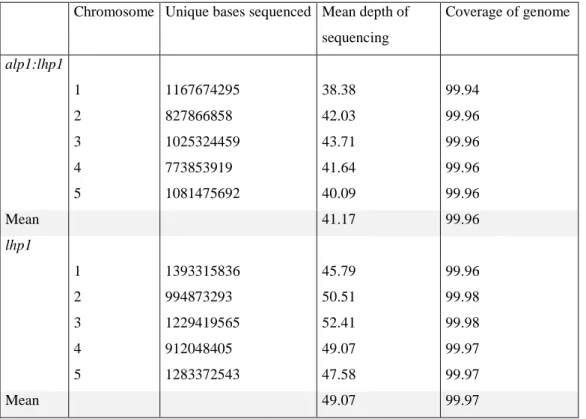
Table 2.1: Resequencing summary of mutants. Resequencing output of each mutant (adopted from Hartwig et al., 2012).
Chromosome Unique bases sequenced Mean depth of sequencing
Coverage of genome
alp1:lhp1
1 1167674295 38.38 99.94
2 827866858 42.03 99.96
3 1025324459 43.71 99.96
4 773853919 41.64 99.96
5 1081475692 40.09 99.96
Mean 41.17 99.96
lhp1
1 1393315836 45.79 99.96
2 994873293 50.51 99.98
3 1229419565 52.41 99.98
4 912048405 49.07 99.97
5 1283372543 47.58 99.97
Mean 49.07 99.97
2.3. Results
2.3.1. Analysis of isogenic mapping population for mutant identification
After quality trimming and SNP identification from short read analysis using
SHORE, we have identified 14225 and 13721 variations from alp1;lhp1 double
mutant and lhp1 mutant respectively compared to Col-0 reference genome. Mutagen
induced changes in double mutant alp1;lhp1 was identified by removing all sequence
differences identified in lhp1 mutant. These variations identified in lhp1 mutant are
the natural variations between the line used for mutagenesis and Col-0 along with
sequencing error and resequencing artifacts. alp1;lhp1 specific SNPs having at least
eight reads of support and a SHORE quality score greater than 24 were retained that
made 1351 mutations for further allele frequency analysis. As EMS introduce mainly
G/C:A/T mutations, we filtered for those and were left with a set of 412 novel EMS
changes (Appendix Table 1). Allele frequency of each EMS mutation in the pool was
plotted against chromosomal position to identify the fixed genomic region. Selection
for the lower arm of chromosome 3 became apparent through an allele frequency
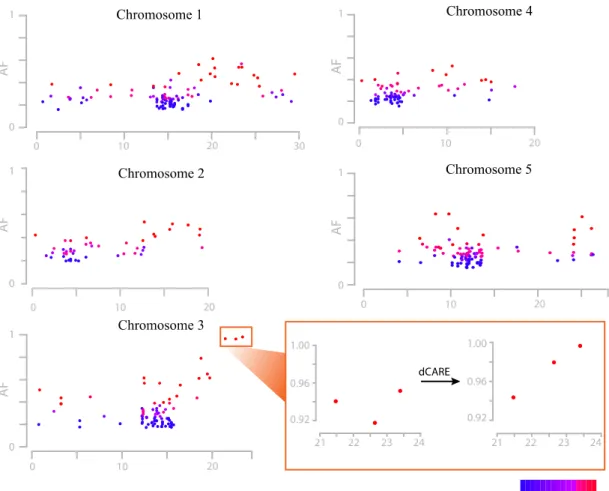
distortion in this region (Figure 2.2). Across the five chromosomes, there were only
three mutations that had a mutant allele frequency higher than 80% and clustered on
the lower arm of chromosome 3. Functional prediction of these three mutations based
on the TAIR10 gene annotation was that two mutations were located in exons of
AT3G57940 and AT3G63270 and one in an intron of AT3G61130. Moreover, the
first two mutations caused missense mutation leading to amino acid changes of
Val→Ile and Gly→Glu, respectively (Figure 2.3). The script used for EMS induced
mutant identification as well as frequency analysis and visualizations were compiled
for download under SHOREmap backcross analysis package. The complete package
is downloadable from (http://shoremap.org).
34
Figure 2.2: Allele frequency estimations at EMS changes. Allele frequency estimations at EMS-induced mutations of alp1;lhp1 across all five chromosomes were shown (x-axis: Chromosomal position in Mb). Allele frequencies (AF; y-axis) were estimated as fractions of short reads supporting the mutant allele divided by the number of all reads aligning to a given marker. The color indicates the resequencing consensus (SHORE) score, and only base calls with a quality score of more than 25 have been considered. The long arm of chromosome 3 was found to be under selection, as local allele frequencies appeared to be higher as compared to other regions in the genome. This region was magnified to show the allele frequency difference in detail (orange box) and the estimated allele frequency from dCARE was shown on right side (adopted from Hartwig et al., 2012).
2.3.2. dCARE identifies causal change
Although the putative candidate mutations were spaced over 2 Mb apart,
nearly complete linkage between the three candidate mutations was apparent in the
pooled DNA. Based on Arabidopsis genetic maps, this physical distance corresponds
to approximately 7 to 8 centimorgan, suggesting that several recombination events between these mutations are expected in a pool of 270 recombinants (Giraut et al., 2011). Our analysis of the raw reads from illumina sequencing covering the three mutations revealed two Col-0 wild-type reads out of 50 and 48 reads, for the mutation in AT3G57940 and AT3G61130, respectively. Whereas, the mutation in AT3G63270 had one wild-type read out of 41 reads. Although the mutation in AT3G63270 could therefore act as main candidate, the disparity was too minor to reliably exclude the other mutations. As usually the number of individuals pooled in bulk segregant analyses is considerably larger than the average whole genome resequencing coverage, thus not powerful enough to resolve the real allele frequency accurately.
Therefore, an increased number of short-read alignments at the mutation sites by a targeted deep resequencing of mutant locus would enable to determine the allele frequency in a bulked DNA much more precisely. In order to generate more sequencing data for the mutated regions, we amplified regions across the mutations by PCR using the pooled DNA from bulked segregant as template and sequenced the amplicons with the Ion Torrent Personal Genome Machine (Rothberg et al., 2011).
This dCARE analysis generated 20,111, 4,390, and 19,203 reads across the candidate
mutations in AT3G57940, AT3G61130, and AT3G63270, respectively. For the
changes in AT3G57940 and AT3G61130, we found 5.7% and 2.1% reads supporting
wild-type allele, whereas only less than one percentage of the reads at AT3G63270
supported the wild-type allele. The presence of Col-0 wild-type reads at all candidate
mutations can be explained by contamination of the segregant bulk, possibly due to
mis-scoring of mutants or by sequencing errors that occur at a low rate. Both types of
error affect mutations independent of their linkage to the causative change and
represent background noise. In fact, the rate of wild type allele at AT3G63270 is even
slightly lower than the rate of sequencing errors reported for Ion Torrent PGM
sequencing (Rothberg et al., 2011). As a consequence, we could not reliably identify
any wild-type alleles for the mutation affecting AT3G63270, whereas the wild-type
allele was clearly apparent for both linked mutations (Table 2.2). Thus, dCARE
reduced the list of candidates to AT3G63270. dCARE demonstrates the apt utilization
of different NGS platforms on mapping-by-sequencing experiment. Utility of dCARE
resembles the traditional fine mapping procedure in a mapping-by-sequencing
context.
36
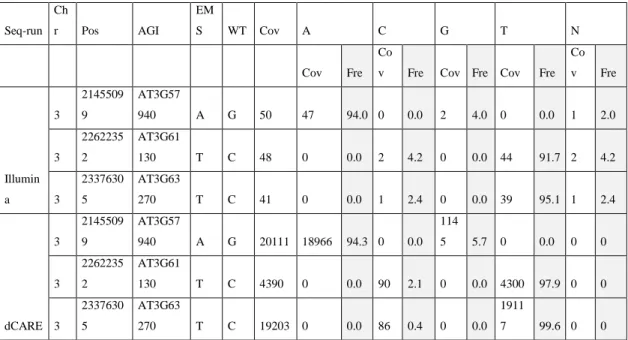
Table 2.2: Raw reads and allele frequency calculations at three putative candidate mutation locus. Illumina platform was used for whole genome resequencing, whereas dCARE used Ion Torrent sequencing platform for targeted deep resequencing (adopted from Hartwig et al., 2012).
Seq-run Ch
r Pos AGI
EM
S WT Cov A C G T N
Cov Fre
Co
v Fre Cov Fre Cov Fre Co v Fre
Illumin a
3
2145509 9
AT3G57
940 A G 50 47 94.0 0 0.0 2 4.0 0 0.0 1 2.0
3
2262235 2
AT3G61
130 T C 48 0 0.0 2 4.2 0 0.0 44 91.7 2 4.2
3
2337630 5
AT3G63
270 T C 41 0 0.0 1 2.4 0 0.0 39 95.1 1 2.4
dCARE 3
2145509 9
AT3G57
940 A G 20111 18966 94.3 0 0.0 114
5 5.7 0 0.0 0 0
3
2262235 2
AT3G61
130 T C 4390 0 0.0 90 2.1 0 0.0 4300 97.9 0 0
3
2337630 5
AT3G63
270 T C 19203 0 0.0 86 0.4 0 0.0 1911
7 99.6 0 0
Independent of dCARE analysis, AT3G63270 was established as the antagonist of lhp1 (alp1) by complementation study and test cross between independent alleles. ALP1 encodes a gene related to Harbinger-like transposases.
From phylogenetic study of available homologous, ALP1 is likely to be derived from
an ancient Harbinger transposon but seems to have acquired a plant-specific function
over time. However, ALP1 is an expressed gene that is not directly regulated by
LHP1 and the Polycomb Group (PcG) pathway, thus required further study to reveal
its function and interaction with lhp1 mutant (Hartwig et al., 2012).
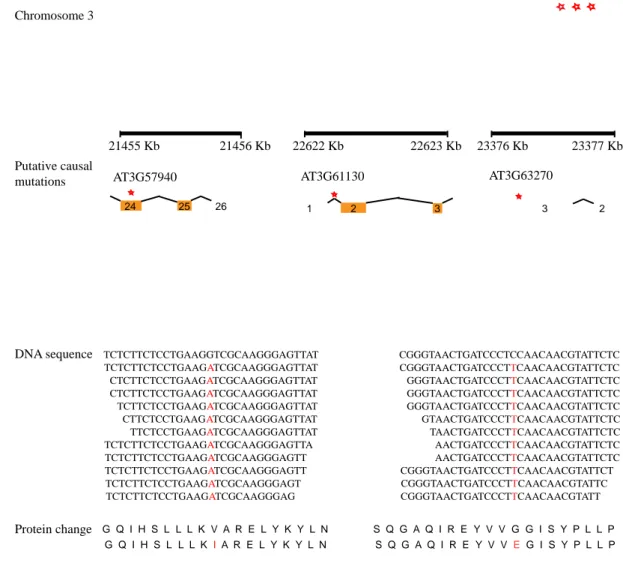
Figure 2.3: Annotation of putative causal mutations. The genomic regions of candidate EMS mutations (red asterisks) along with gene annotations are shown (top).
Only partial gene structure is shown where orange boxes indicate exons. Locations of EMS mutations that have putative effects on amino acid sequences are shown in red letters; for clarity, the DNA sequences in the graph do not reflect the actual number of reads at these locations (coverage was shown in table 2.2) (adopted from Hartwig et al., 2012).
21455 Kb 21456 Kb 22622 Kb 22623 Kb 23376 Kb
26 25 24
AT3G57940
2
1 3
AT3G61130
23377 Kb AT3G63270
Chromosome 3
Putative causal mutations
2 3
TCTCTTCTCCTGAAGGTCGCAAGGGAGTTAT TCTCTTCTCCTGAAGATCGCAAGGGAGTTAT CTCTTCTCCTGAAGATCGCAAGGGAGTTAT CTCTTCTCCTGAAGATCGCAAGGGAGTTAT TCTTCTCCTGAAGATCGCAAGGGAGTTAT TTCTCCTGAAGATCGCAAGGGAGTTAT CTTCTCCTGAAGATCGCAAGGGAGTTAT TCTCTTCTCCTGAAGATCGCAAGGGAGTTA TCTCTTCTCCTGAAGATCGCAAGGGAGTT TCTCTTCTCCTGAAGATCGCAAGGGAGTT TCTCTTCTCCTGAAGATCGCAAGGGAGT TCTCTTCTCCTGAAGATCGCAAGGGAG
CGGGTAACTGATCCCTCCAACAACGTATTCTC CGGGTAACTGATCCCTTCAACAACGTATTCTC
AACTGATCCCTTCAACAACGTATTCTC TAACTGATCCCTTCAACAACGTATTCTC GTAACTGATCCCTTCAACAACGTATTCTC GGGTAACTGATCCCTTCAACAACGTATTCTC GGGTAACTGATCCCTTCAACAACGTATTCTC GGGTAACTGATCCCTTCAACAACGTATTCTC
CGGGTAACTGATCCCTTCAACAACGTATTC CGGGTAACTGATCCCTTCAACAACGTATTCT AACTGATCCCTTCAACAACGTATTCTC
CGGGTAACTGATCCCTTCAACAACGTATT
S Q G A Q I R E Y V V G G I S Y P L L P G Q I H S L L L K V A R E L Y K Y L N
G Q I H S L L L K I A R E L Y K Y L N S Q G A Q I R E Y V V E G I S Y P L L P DNA sequence
Protein change
38
Chapter 3. User guide for mapping-by-sequencing in Arabidopsis thaliana
Though mapping-by-sequencing accelerates mutant identification by combining genetic mapping with whole-genome sequencing, less effort has been put in optimizing the experimental set up. Moreover, different strategic approaches reported so far has not compared comprehensively. This chapter explores the different strategies and optimal experimental design for each of the mapping-by-sequencing scenarios. The guidelines are formulated based on simulations of different experimental setups mainly the type of mapping population, sequencing coverage and sequencing methods by following empirically determined recombination frequency and landscape of Arabidopsis thaliana. Using a newly developed simulation tool called Pop-Seq simulator, different mapping populations and sequencing experiments were simulated to replicate different mapping-by-sequencing scenarios in-silico. This study was published recently in a special edition of Genome Biology for Plant Genomics (Velikkakam James et al., 2013). Within few weeks’ span of time, this paper was designated as ‘Highly accessed’ and made to top two in the list of most popular recently viewed articles. Appropriate contents for this chapter are taken from the published manuscript. Korbinian Schneeberger and myself designed this study.
The simulation tool; Pop-Seq simulator was designed and implemented by me
together with Vipul Patel and Korbinian Schneeberger. Karl J.V. Nordstrom and
Jonas R. Klasen helped with ad-hoc external scripts for SHOREmap analysis and
collecting recombination frequency for rice and barley, respectively. I simulated
different scenarios and performed analysis to formulate results. Patrice Salome and
Detlef Weigel provided empirical recombination data for A. thaliana.
40
3.1. Introduction
Forward genetic screens remain one of the major genetic tools to discover gene function in plants as well as in other organisms. Soon after the realization of applicability of NGS in mapping, several analysis pipelines have been introduced and were already applied to various model species, including plants, yeast, nematodes, mammals, and invertebrates (Schneeberger, Ossowski, et al., 2009; Birkeland et al., 2010; Doitsidou et al., 2010; Austin et al., 2011; Abe et al., 2012; Hartwig et al., 2012). The two main parts of mapping-by-sequencing is first, to generate a mapping population, and second, selection of mutant and whole genome shotgun resequencing.
Different types of crossing schemes for mapping-by-sequencing have been suggested to develop mapping population. The very first mapping-by-sequencing experiments were performed on pooled genomes of mutant recombinants that were generated by crossing the mutants to diverged strains followed by one round of selfing (Schneeberger, Ossowski, et al., 2009; Cuperus et al., 2010). Recently, several groups suggested use of backcrossed instead of outcrossed individuals as mapping population, as mutagen-induced changes segregate like natural polymorphisms. Even though there is no prior knowledge about their distribution or location, mutagen- induced changes can be identified within whole-genome sequencing data and subsequently used for mapping (Abe et al., 2012; Hartwig et al., 2012; Lindner et al., 2012). Similarly, direct sequencing of an individual mutant recombinant, as suggested for Caenorhabditis elegans and later for A. thaliana, will allow for a rough mapping of the causal mutation (Zuryn et al., 2010; Ashelford et al., 2011). Although multiple rounds of backcrossing are usually not sufficient to considerably minimize the size of linked regions around causal mutations, this strategy has the advantage to characterize the complete genome of a mutant recombinant. Alternatively, direct sequencing of two or more independently generated alleles of the same mutant followed by a subsequent search for genes that carry mutations in all mutant alleles is powerful enough to unambiguously identify the causal mutation (Uchida et al., 2011;
Nordström et al., 2013).
Irrespective of the actual strategy, application of mapping-by-sequencing
involves decisions on the experimental makeup, for instance the size of the mapping
population, as well as the amount of next generation sequencing data. Since both are
42
mapping-by-sequencing experiments. The lack of general guidelines describing an optimal design might lead to conservative decisions that prime an unnecessarily high number of individuals and sequencing coverage.
Within this study, we established guidelines for mapping-by-sequencing for A.
thaliana by simulation. Simulation studies are powerful and well utilized to study the
power of linkage map and crossing scheme with respect to QTL identification in
different mapping population (Slate, 2008; Klasen et al., 2012). However, simulations
solely dependent on theoretical calculation may differ from reality. Thus, we
developed a simulation tool called Pop-Seq simulator that follows an experimentally
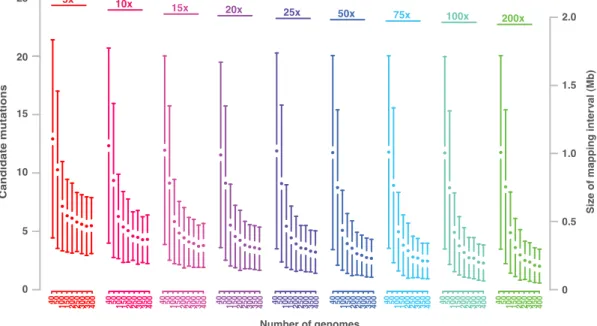
established recombination landscape. We simulated more than 400,000 mapping-by-
sequencing experiments to analyze the differences in the design of mapping
populations in relation to the number of candidate mutations identified in the course
of such an experiment. Pop-Seq simulator consists of two parts, first, Pop simulator
which simulates virtual genotype from a given cross of two parents. Successively,
these virtual genomes that are represented in genotypes are passed to Seq simulator,
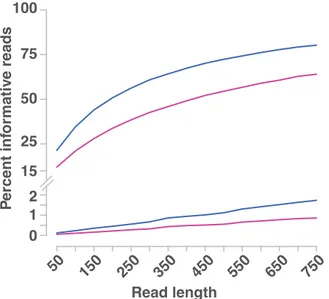
which generate the sequence read count per allele per locus. Furthermore, we
evaluated the impact of technical aspects, such as read length and read pairing, on
mapping-by-sequencing.
Figure 3.1: Overview of different strategies in mapping-by-sequencing. Various
questions during experimental setup of mapping-by-sequencing are shown in red. (I)
Mutants can be crossed to diverged accessions or backcrossed to the wild-type. (II)
The number of backcrosses and number of plants used as parents contribute to the
outcome of mapping-by-sequencing. (III) The number of mutant plants sampled from
mapping population greatly impacts the mapping results. (IV) Finally, the sequencing
coverage as well as type of sequencing (single-end or paired-end) affects the outcome
of mapping-by-sequencing (adopted from Velikkakam James et al., 2013).
44
Even though our simulations were focused on A. thaliana, our simulation
pipeline is generic and can be applied to other species as well as other mapping or
sequencing strategies. In the last section, we describe the extension of our analysis on
the experimental design of mapping-by-sequencing to two crop model species; rice
and barley, in which next generation sequencing-based mapping becomes tangible
reality.
3.2. Materials and Methods
3.2.1. Simulation of recombinant populations by Pop simulator
We implemented Pop-Seq simulator in Perl 5.14.2. Both simulation tools could stand-alone and were based on object-oriented programming. In case of Pop simulator, initial parental genomes were generated using user specified number of homozygous makers placed randomly or at the specified locus. If the marker under selection was not specified, then one of those markers was randomly selected as causal mutation and used for selection at the end of each population stage if specified.
Similarly, a wild-type genome was simulated except marker loci with wild-type allele.
Throughout the Pop simulator, each parental allele was coded internally with parental name and decoded back at the end of the simulation. In order to simulate offspring genomes, we combined recombined haploid genomes from one or two virtual parents.
Offspring genomes were used as parents for further crosses. During each cross, the virtual gametes were generated from each genome by determining the number and location of recombination involved. The actual number of recombination per meiosis for each chromosome was randomized based on the distribution of recombination events in Arabidopsis; these empirical determined recombination frequencies were derived from a cross between Arabidopsis Col-0 and Fei-0 (Salome et al., 2011). It was calculated by
[ ]
where p1, p2 and p3 are the observed frequencies of none, one and two or more recombination per chromosome per meiosis. The location of each recombination was selected after the observed frequencies over each marker along the chromosome and placed in-between two adjacent markers. The probability of a recombination at position x
ijbetween two adjacent markers was calculated by
( ) ( )