Clinical Research in Stroke
Cerebrovasc Dis
Decline and Recurrence of Stroke Consultations during the COVID-19 Pandemic Lockdown
Parallels Population Activity Levels
Felix Schlachetzki
aSibylle Wilfling
aNikolai Dominik Hubert
bAndrea Wagner
aRoman L. Haberl
bRalf Andreas Linker
aGordian Jan Hubert
baDepartment of Neurology, TEMPiS Telemedical Stroke Center, Bezirksklinikum Regensburg, University of Regensburg, Regensburg, Germany; bDepartment of Neurology, TEMPiS Telemedical Stroke Center, Academic Teaching Hospital of the University of Munich, München Klinik Harlaching, Munich, Germany
Received: August 9, 2020 Accepted: November 22, 2020 Published online: February 4, 2021
Felix Schlachetzki
© 2021 The Author(s) karger@karger.com
DOI: 10.1159/000514154
Keywords
COVID-19 · Stroke · Telestroke · Lockdown · Thrombolysis
Abstract
Background: The COVID-19 pandemic lockdown (CPL) lead to a significant decrease in emergency admissions world- wide. We performed a timely analysis of ischemic stroke (IS) and related consultations using the telestroke TEMPiS “work- ing diagnosis” database prior (PL), within (WL), and after eas- ing (EL) of CPL. Methods: Twelve hospitals were selected and data analyzed regarding IS (including intravenous thrombol- ysis [intravenous recombinant tissue plasminogen; IV rtPA]
and endovascular thrombectomy [EVT]) and related events from February 1 to June 15 during 2017–2020. In addition, we aimed to correlate events to various mobile phone mo- bility data. Results: Following the significant reduction of IS, IV rtPA, and EVT cases during WL compared to PL in 2020 longitudinally (p values <0.048), we observed increasing numbers of consultations, IS, recommendations for EVT, and IV rtPA with the network in EL over WL not reaching PL levels yet. Absolute numbers of all consultations paralleled best to mobility data of public transportation over walking and driv- ing mobility. Conclusions: While the decrease in emergency
admissions including stroke during CPL can only be in part attributed by patients not seeking medical attention, stroke awareness in the pandemic, and direct COVID-19 triggered stroke remains of high importance. The number of consulta- tions in TEMPiS during the lockdown parallels best with mo- bility of public transportation. As a consequence, exposure to common viruses, well-known triggers for acute cerebro- vascular events and other diseases, are reduced and may add to the decline in stroke consultations. Further studies comparing national responses toward the course of the CO- VID-19 pandemic and stroke incidences are needed.
© 2021 The Author(s) Published by S. Karger AG, Basel
Introduction
The current COVID-19 pandemic challenges diagnos- tics and treatment of patients with a variety of neurologi- cal diseases. Infection with SARS-CoV-2 has been linked to stroke in critically ill patients and unusual stroke man- ifestations, and may be an additional stroke risk factor and predictor for bad outcome [1–8]. A complicating matter is that in this scenario stroke neurologists need to organize rapid specific stroke management of possible
COVID-19-positive patients from the preclinical setting through the ambulance and emergency system, to stroke units, and in the neuroradiological department, including IV thrombolysis (intravenous recombinant tissue plas- minogen; IV rtPA) and endovascular treatment (EVT), and adequate protection of all hospital personnel [9–11].
Other phenomena related to the COVID-19 pandemic are the compiling reports from hospitals around the globe of a significant decline in a large variety of diseases such as stroke, subarachnoid hemorrhage (SAH), myocardial infarction, acute heart failure, and diverticular disease, amongst others [12–19].
Various groups noted a timely link of declining stroke cases to the beginning of the various nationwide lock- downs [16, 20–24]. Controversy exists whether or not this phenomenon is purely related to changes in stroke aware- ness due to reduced social contact or reluctance to seek medical treatment in fear of potential COVID-19 infec- tion after years of successful stroke education efforts and changes in hospital transport guidelines. In addition, some of these publications report additionally lower numbers of IV rtPA, EVT, and large ischemic stroke (IS) volumes while others reported unchanged relations of IV rtPA and EVT within the smaller stroke collective [2, 19, 24–30]. However, the unprecedented decline in a broad variety of vascular diseases including severe IS, SAH, and myocardial infarction needs further analysis.
In a previous analysis of the TEMPiS telestroke work- ing database, we noted a significant decrease of IV rtPA and EVT recommendations within 6 weeks after begin- ning of the COVID-19 lockdown to parallel activity data from mobile phones [31, 32]. In this study, we follow up on this development in relation to rising of various activ- ity levels after easing of social distancing measures.
Material and Methods
Data from daily consultations at 12 hospitals without neurol- ogy departments in the telestroke network TEMPiS form the basis of this study as previously described [32]. The consultations took place between February 1 and June 15 in the years 2017–2020. All data were pseudonymized. We extracted the actual working diag- noses based on telemedical consultation and neuroimaging results, mainly cerebral computed tomography. The major “working diag- nostic groups” of the TEMPiS data were as follows: (1) IS, (2) tran- sient ischemic attack (TIA), (3) intracranial hemorrhage (ICH, in- cluding SAH, subdural hematoma and intracerebral bleeding [ICB]), (4) epileptic seizure, (5) migraine, (6) other disorder (in- cluding facial palsy, headache, and brain tumor), and (7) all con- sultations. Furthermore, cases were analyzed regarding recom- mendations for IV thrombolysis (IV rtPA) or endovascular thera- py (EVT, thrombectomy) for large-vessel occlusion.
Before comparing 2020 data with the previous years, data from 2017 to 2019 (January–July each) were plotted for all con- sultations, EVT recommendations, and recommendations for IV thrombolysis in order to get a general overview (Fig. 1 and 2).
Overall, the number of consultations has been increasing slightly over the years (presumably based on more and better therapies being available, maybe also due to an increase of the average age in the overall population or other causes), while the number of recommendations for IV thrombolysis seemed to stay roughly constant within the analyzed years. As expected, the numbers of EVT recommendations had been increasing from 2017 to 2020, presumably mainly because this method was established as a standard of care. Due to the small case numbers and weekly fluc- tuations as well as data being only available for the first 6 months of each year, we decided against correction for these increasing numbers. The lack of correction is unfavorable for our working hypothesis – a decrease of case numbers in 2020 due to the lock- down – and thus should not lead to falsely small significances.
For this, when comparing with the previous years, we only ana- lyzed the data regarding potentially significant decreases but not increases.
Three 6-week periods were analyzed: prior to (PL) the CO- VID-19 pandemic lockdown (CPL) from February 1 to March 15, within (WL) the CPL from March 16 to April 30 and upon easing (EL) of the CPL starting May 1 to June 15. These 6-week blocks were divided into 3 subgroups again, each spanning a time frame of 2 weeks. We decided for blocks spanning such small time frames in order to adjust for weekly/seasonal and other fluctuations with- in the data. Data from the respective time frames from 2017 to 2019 served as reference.
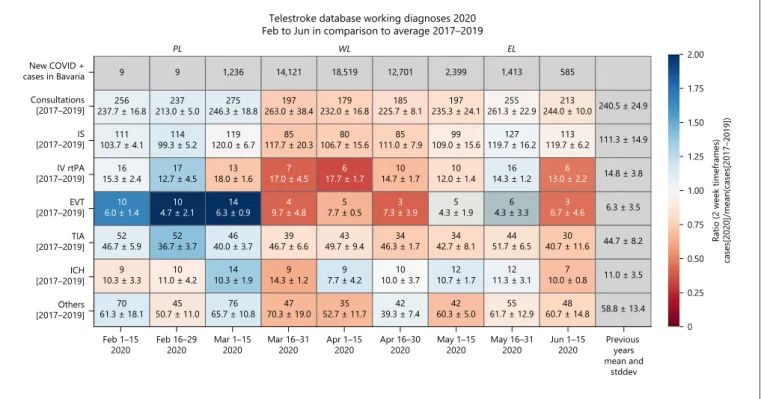
Exploratory descriptive summary statistics with mean values and standard deviations were applied to generate heat maps with intensities defined by the ratio of cases in 2020 divided by the mean number of cases from 2017 to 2019. For better comparability, the overall means and standard deviations of the previous years (Janu- ary 1–July 15) are shown in an extra column at the right end of the heat map.
Three different analyses of the time periods were applied. In a first step, data from 2020 were compared to data from 2017 to 2019. One sample, two-tailed t tests were used on all subgroups to calculate the corresponding p values. These tests compared the case number in 2020 to the 3 case numbers in 2017, 2018, and 2019.
The results are shown as a heat map (Fig. 3) with each field repre- senting one entity in a 2-week block and the color coding repre- senting the ratio of cases in 2020 to the mean of the case number in the previous 3 years. Red fields depict ratios smaller than 1 – cor- responding to a decrease of cases – while blue fields show an in- crease in cases, which was mainly but not solely to expect for EVT cases in general in 2020.
Additionally, data were analyzed longitudinally in 2020. For this, the data were split into the aforementioned 3 blocks – PL, WL, and EL, each covering 6 weeks – and compared one to another.
According to our hypothesis, statistical analysis was performed for the comparison of the lockdown situation with the prior lockdown situation for IS and related events. “ICH” and “Other” events were excluded from this analysis as well as migraine and epilepsy due to relatively small numbers. For clarity reasons, additional data are shown in the heat map, including the development of cases in the EL situation (Fig. 3). As all data are placed within 2020, again there was no correction for increasing or decreasing case numbers under
the assumption of minor baseline changes in a time frame of the considered few weeks. As the null hypothesis was strongly one- sided – “no change or an increase in cases when comparing the within-lockdown situation to the prior lockdown situation” – one- tailed t tests were performed. p values were Bonferroni-corrected, values <0.05 were considered significant.
Last, IS and related events information from previous years was combined with longitudinal information. For this, ratios of (cases [2020]/mean [cases 2017–2019]) were compared using one-tailed t tests again with Bonferroni correction and a null hypothesis of an increase or no change in ratios for EL to PL. Statistics were only applied to events that were regarded as virus triggered/IS or isch-
emia-related again – so for “all consultations,” “EVT recommen- dations,” “IV rtPA recommendations,” “IS,” and “TIAs”.
Furthermore, the heat map shows the number of COVID-pos- itive cases in Bavaria. These data are available for public at https://
experience.arcgis.com/experience/478220a4c454480e823b17327 b2bf1d4/page/page_1/. As these data are given in calendar weeks rather than in daily format, the numbers of COVID-positive cases do not exactly correspond to the given time frames. They only serve as illustration and were not used for any statistical analysis.
General public activity curves related to “walking,” “driving,”
and “public transportation” were created using a moving average over the last 28 days based on the mobility data available at https://
Cumulative TEs registered in TEMPiS
Cumulative events
100
80
60
40
20
0
Date, month-day
01–01 02–01 03–01 04–01 05–01 06–01
20202019 20182017
Cumulative thrombolysis registered in TEMPiS
Cumulative events
175 150 125 100 75 50 25 0
Date, month-day
01–01 02–01 03–01 04–01 05–01 06–01
20202019 20182017 Fig. 1. Blot showing the increasing number
of recommendations endovascular throm- bectomies for the first 6 months from the years 2017 to 2020. Note the decline with the beginning of the COVID-19 pandemic starting March 2020.
Fig. 2. Blot showing the relatively steady number of recommendations for intrave- nous thrombolysis for the first 6 months from the years 2017 to 2020. Note the de- cline with the beginning of the COVID-19 pandemic starting March 2020.
www.apple.com/covid19/mobility. These mobility data were gen- erated from the relative request volume for directions in specific regions compared to a base volume on January 13, 2020. A similar approach was applied for the TEMPiS registered event data before calculating correlations. Traffic data were analyzed for all available regions regarding Bavaria or the whole of Germany – 7 situations with very similar data in total: Munich (driving and walking), Nuremberg (driving, walking, and transit), Bavaria (driving), and Germany (transit). Transit depicts public transportation. Correla- tions of moving averages of traffic data to IS, IV rtPA, EVT, and consultations in the TEMPiS telestroke database were calculated for each of the 7 available datasets. As all traffic curves showed a very similar course, the data used for our analyses can be regarded as representative for all available datasets in Germany provided by Apple mobility data. As these data include different cities in Ba- varia as well as Bavaria and Germany as whole and all the datasets were very similar, it can be assumed to be – at least locally – rep- resentative for the TEMPiS data spanning a large area in Bavaria.
One might discuss age effects as it is possible that the data given by Apple mobility trends represents a collective younger than the av- erage TEMPiS patient. Due to a lack of representative data, we can- not fully exclude such effects. Nevertheless, we would assume such effects being rather differences in absolute numbers instead of ra- tios (e.g., less elderly patients being included in Apple mobility trends, but the decline and increase in public transportation, walk- ing and car usage being similar in younger as well as in older pa- tients), thus not affecting the course of the data and consequently also not the correlation.
Results
A total of 8,498 telemedical consultations with the 12 TEMPiS network hospitals during the specific time frames were investigated. Of these, 29 cases were exclud- ed before further analysis being non-acute consultations (i.e., follow-up examinations). The absolute number of COVID-19-positive cases in the whole of Bavaria rose from a 2- or at maximum small 3-digit area at the end of February 2020 to over 47,000 cases on June 15, 2020, with new cases spiking within the COVID-19 lockdown fol- lowed by a steady decline thereafter (Fig. 3).
Comparing case numbers in 2020 to the preceding years 2017–2019, no 2-week block reached statistical dif- ference on one-sample, two-tailed T tests when corrected for multiple testing (Fig. 3). The lack of significant chang- es is due to the small case numbers, high fluctuation in the data, and the triennium serving as reference. Never- theless, compared to case numbers of previous years, in the weeks prior to lockdown (PL), an increase compared to the case numbers of the previous years indicated in blue heat map colors could be observed, and overall con- sultations and EVT recommendations were constantly above the means of the previous years. Within the lock-
Telestroke database working diagnoses 2020 Feb to Jun in comparison to average 2017–2019
PL WL EL
New COVID + cases in Bavaria Consultations [2017–2019]
[2017–2019]IS
IV rtPA [2017–2019]
[2017–2019]EVT
[2017–2019]TIA
[2017–2019]ICH
Others [2017–2019]
Feb 1–15
2020 Feb 16–29
2020 Mar 1–15
2020 Mar 16–31
2020 Apr 1–15
2020 Apr 16–30
2020 May 1–15
2020 May 16–31
2020 Jun 1–15
2020 Previous years mean and
stddev 9
237.7 ± 16.8256
103.7 ± 4.1111
15.3 ± 2.416
6.0 ± 1.410
46.7 ± 5.952
10.3 ± 3.39
61.3 ± 18.170 9
213.0 ± 5.0237
99.3 ± 5.2114
12.7 ± 4.517
4.7 ± 2.110
36.7 ± 3.752
11.0 ± 4.210
50.7 ± 11.045 1,236
246.3 ± 18.8275
120.0 ± 6.7119
18.0 ± 1.613
6.3 ± 0.914
40.0 ± 3.746
10.3 ± 1.914
65.7 ± 10.876 14,121
263.0 ± 38.4197
117.7 ± 20.385
17.0 ± 4.57
9.7 ± 4.84
46.7 ± 6.639
14.3 ± 1.29
70.3 ± 19.047 18,519
232.0 ± 16.8179
106.7 ± 15.680
17.7 ± 1.76
7.7 ± 0.55
49.7 ± 9.443
7.7 ± 4.29
52.7 ± 11.735 12,701
225.7 ± 8.1185
111.0 ± 7.985
14.7 ± 1.710
7.3 ± 3.93
46.3 ± 1.734
10.0 ± 3.710
39.3 ± 7.442 2,399
235.3 ± 24.1197
109.0 ± 15.699
12.0 ± 1.410
4.3 ± 1.95
42.7 ± 8.134
10.7 ± 1.712
60.3 ± 5.042 1,413
261.3 ± 22.9255
119.7 ± 16.2127
14.3 ± 1.216
4.3 ± 3.36
51.7 ± 6.544
11.3 ± 3.112
61.7 ± 12.955 585
244.0 ± 10.0213
119.7 ± 6.2113
13.0 ± 2.26
6.7 ± 4.63
40.7 ± 11.630
10.0 ± 0.87
60.7 ± 14.848
240.5 ± 24.9
111.3 ± 14.9
14.8 ± 3.8
6.3 ± 3.5
44.7 ± 8.2
11.0 ± 3.5
58.8 ± 13.4
Ratio (2 week timeframes) cases[2020]/mean(cases[2017–2019]) 2.00
1.75
1.50
1.25
1.00
0.75
0.50
0.25
0
Fig. 3. Heat map of working diagnoses in TEMPiS 2020 compared to 2017–2019.
down (WL) phase, the number of consultations, IS, IV rtPA, EVTs, and TIAs stayed constantly below the means of the previous years, indicated in red colors. After the easing of the lockdown (EL phase), a less homogenous picture with some still decreased case numbers compared to the previous years (mainly consultations overall, stroke, and TIA) and other already increasing case numbers could be observed. Overall, this indicates rising case num- bers again not reaching PL levels yet.
The analysis of case numbers 6-week blocks in 2020 PL (February 1–March 15), WL (March 16–April 30), and EL (May 1–June 15) revealed significant differences in longitudinal analysis. Comparing the PL to WL period, it exhibited rapid and significant decreases of all consulta- tions, IS, IV rtPA, and EVTs (adjusted p values <0.0304, 0.0017, 0.0269, 0.0472, and respectively). EL, represent- ing the situation after easing of the lockdown, still re- vealed decreases.
In order to adjust for both weekly and longitudinal ef- fects, additionally the ratios of (2020/mean [2017–2019]) were compared. Again, the WL ratios of overall consulta- tions, EVTs, and IS showed significant decreases com- pared to PL (adjusted p values <0.034 each). With respect to public mobility indicated by Apple® mobility trends data analysis, the initiation of public lockdown March 15, 2020, resulted in a decrease in walking, driving, and tran- sit activity in mid-end March 2020 to about −80% (−70.9 to −82.45% for 7 different traffic datasets, minimum on
March 21, 2020) on a day-based level, resulting in a de- crease to about 40% (35–45%) for moving averages over the last 28 days reaching their minima at the midst of April.
When correlating mobility data to telestroke network consultation, correlation coefficients between traffic data and IS ranged from 0.91 to 0.97 (mean 0.94), for IV rtPA from 0.84 to 0.94 (mean 0.90), and for EVTs from 0.69 to 0.85 (mean 0.76) for the available datasets. Consultations showed the highest value of correlation with Germany public transport (range = 0.90–0.97, mean = 0.94), al- though all mobility datasets showed a similar picture.
Specifically, correlation coefficients of Germany public transport and TEMPiS consultations were as followed:
0.97 for all consultations, 0.85 for EVT, 0.90 for rtPA, 0.92 for stroke, and 0.84 for TIAs (Fig. 4). Data of COVID- positive cases did not parallelize to any of the subgroups of events registered in TEMPiS suggesting no positive correlation.
Discussion
The current study using the TEMPiS telestroke work- ing database shows a correlation between the decrease and recovery of teleconsultations and population activity levels during COVID-19 lockdown for all stroke subtypes except ICH. The number of consultations with facing dis-
Correlation of transit in Germany and events in TEMPiS 2020
Daily averages over last 28 days, scaled
r = 0.92
r = 0.97 r = 0.84
r = 0.90 r = 0.85 2.5
2.0
1.5
1.0
0.5
0
Date in 2020, month-day Lockdown
02–15 03–01 03–15 04–01 04–15 05–01 05–15 06–01 06–15 Transit in Germany
IV rtPA EVTTIA ISConsultations Fig. 4. Correlations between events regis-
tered in TEMPiS and transit/public trans- portation in Germany. Shown in the back- ground as semi-transparent are the moving averages of daily case numbers calculated for each day over the last 28 days (IV rtPA, EVT, TIA, IS, and Consultations). Pear- son’s correlation coefficients are shown as r on the right and were calculated based on unsmoothed averages on a daily basis for a time frame between February 9 and June 15, 2020 (both inclusive). Overlying are smoothed curves for graphical reasons.
Values for TIAs are scaled to 1/2, values for IS to 1/4 and values for events overall to 1/10. Transit data are shown as red dashed line. These data are given as the ratio with the denominator (reference) being the val- ue of transit on January 13, 2020. IS, isch- emic stroke; IV rtPA, intravenous recom- binant tissue plasminogen activator; EVT, endovascular thrombectomy; TIA, tran- sient ischemic attack; ICH, intracranial hemorrhage.
abling stroke from IS requiring IV rtPA or EVT also di- minished and increased in parallel to activity levels with- out reaching prior levels yet. The COVID-19 lockdown itself appears to have a profound effect not only on stroke occurrence and intensity, but on other (neuro-) vascular diseases and illnesses as well. The common perspective is that altered prehospital awareness and reluctant behavior to seek medical help during the lockdown resulted in di- minished and less timely stroke code alerts, yet also dif- ferent physical activity levels and especially an overall lower risk of general infection due to social distancing and wearing of mouth-nose masks may play a role.
The decline of severe stroke cases requiring IV rtPA and even EVT observed in the TEMPIS telestroke net- work after initiation of the lockdown parallels the devel- opment in a large variety of vascular diseases as shown by several groups [18, 27–29, 32–34]. The general notion in the stroke expert field toward falling numbers of stroke cases strongly suggest that patients and stroke symptoms observing persons refrain to seek medical help because of the risk of SARS-Cov-2 infection in the hospital [35, 36].
In addition, Aguiar de Sousa et al. [37] speculated on ad- ditional reasons for this phenomenon: (1) reduced social contact between relatives may lower third party detection rate of stroke symptoms that patients themselves are of- ten not aware of, (2) the emergency system may be “clot- ted” with COVID-19 cases and patients do not reach the hospital, (3) ongoing COVID-19 respiratory infection are the leading clinical working diagnosis overshadowing stroke, and (4) altered environmental factors such as re- duced pollution may have a more profound effect than previously thought. Indeed, in Akershus University Hos- pital, Norway, stroke patients during the lockdown had on average a significantly higher NIHSS than before (5.9 vs. 4.2), and upon multivariable logistic regression ad- justed for sex, age, living alone, and NIHSS ≤5, there was a significantly increased odds ratio for not reaching hos- pital within 4.5 h for IV rtPA [6]. This observation is in line with data from Hongkong, China, with prolonged symptom to hospital time during the CPL [19]. Diegoli et al. [16] analyzing a population-based stroke registry in Joinville, Brazil, found 36.4% reduction in stroke admis- sions upon initiation of lockdown measures in 2020 com- pared to the equivalent time in 2019 with no difference in admissions for severe stroke defined as NIHSS >8, ICB, and SAH. These findings may also be local phenomenon as shown by a publication of the Lyon Stroke Center net- work and the combined descriptive data of 4 German uni- versity stroke units by Hoyer et al. [2, 38]. The latter group showed a significant decrease in the number of admis-
sions for TIA in 3 of 4 centers upon the lockdown by 85%
and a reduction of stroke admission to 46% in 2 of 4 cen- ters. A relevant effect on reperfusion therapies was found for a single center only with a 60% reduction for both IV rtPA and EVT. In accordance with our current study they found a positive correlation in 3 of 4 centers between mo- bility data obtained from Teralytics® (Zurich, Switzer- land) and stroke admissions. They conclude that “there are no reasons to assume that the incidence of stroke is decreasing, if anything, it may rise in the context of the pandemic, given the disease-associated predisposition for thromboembolic events.” It has to be kept in mind that strict epidemiological data are scarce and travel restric- tions, COVID-19 outbreaks in neighboring hospitals with its temporary closure, and re-organization of local emergency pathways to specific high-end hospitals such as university hospitals may limit the assertion of single- center studies.
The perhaps largest study to date analyzed data of the central RAPID-software platform and Kansagra and Goyal confirm that also severe stroke volumes dimin- ished during the early lockdown phase of the COVID-19 pandemic [27]. The number of ischemic core volumes 100–150 and >150 mL were observed to decrease by 39.2 and 45.5%, respectively; core volumes 15–100 mL de- creased by 16.6 and 25%; and very small core infarct vol- umes measuring 0–15 mL decreased 41%. The decrease in the number of very small infarct volumes may well be explained by the generally proposed hesitation to seek emergency care. However, the observed reduction in large ischemic core volumes, consistent with fewer large- vessel occlusions and less severe stroke symptoms, is more in line with our study including the decline in IV thrombolysis and thrombectomy recommendations.
Severe disabling stroke symptoms are impressive events even for non-medical educated persons and initi- ate emergency alerts, and the same applies to patients ex- periencing excruciating headache from SAH. Two publi- cations on the rate of SAH during COVID-19 pandemic describe a marked reduction of aneurysmal SAH in To- ronto, Canada, and Paris, France [14, 17]. Our dataset does not show any significant changes in either SAH, ICB, or subdural hematoma; however, the numbers are small.
No publications with regard to ICB during the CO- VID-19 pandemic have been published to the best of our knowledge and the prevalence of ICB in COVID-19 pa- tients appears low [39].
Our data show a parallelization of cerebral ischemic events to traffic data with high correlation coefficients.
While correlation cannot prove causality, we suggest that
this strong correlation may indicate some kind of depen- dency in between these variables. This, for example, can be observed looking at the number of traumatic brain in- juries during the CPL in New York [40]. Another expla- nation could be, on the other hand side, that there might be one or more other variables influencing both ischemic events and traffic data or that the COVID-19 pandemic event itself influences both the curves without any cau- sality between traffic and the consultation activity in TEMPiS.
Besides the aforementioned changes in prehospital stroke detection, stroke awareness, and avoidance of hos- pital admission upon only minor stroke symptoms among others during the COVID-19 pandemic, we propose 2 ad- ditional mechanisms by which not only stroke but a vari- ety of other diseases may be affected: reduced physical activity – represented by transit data in our study – and low infectious burden by social distancing and face masks.
Physical activity is well known to be accompanied by sud- den and sometimes extensive blood pressure increases, thus leading to aneurysmal SAH and myocardial infarc- tion [41, 42]. The most interesting concept for diminish- ing cardiovascular disease during the COVID-19 pan- demic may be an overall reduction of common infection by face masks and social distancing. These measures have recently been proven to be highly effective in reducing the spread of SARS-Cov-2, and may indeed hinder other viral infections [43, 44]. And general viruses have shown to trigger atherosclerosis and plaque rupture resulting in neuro- and cardiovascular morbidity [45, 46]. In a na- tionwide survey in Denmark, Butt et al. [47] also observed falling IS numbers during the CPL but also less cases of influenza virus infection that is well known for triggering IS. A reduction of Helicobacter pylori infection, also a strong risk factor for acute upper gastrointestinal bleed- ing, may be responsible for an observed reduction of 40%
of this emergency in a majority of Austrian hospitals [48, 49]. Reduced common respiratory tract infection that could trigger acute heart failure and myocardial infarc- tion may explain the up to 50% decline in cases reported from centers in the USA, Great Britain, Denmark, and France [15, 18, 50]. An interesting recent publication linking reduced stroke incidence and new-onset atrial fi- brillation during the COVID-19 pandemic has analyzed the Danish national registry with all of its 5.6 million in- habitants. Holt et al. [50] noted a close to 50% decrease of new-onset atrial fibrillation following the lockdown, and atrial fibrillation remained strongly associated with se- vere stroke symptoms, and general inflammation is a strong trigger for atrial fibrillation [51].
The assumption that additional factors evoked by the COVID-pandemic lockdown such as physical activity and social distancing may lead to a reduced infectious burden and significantly contribute to the decline and now rise in stroke cases in our telestroke network cannot be proven with our dataset. But, the correlation between number of consultations and mobility levels is striking and almost exactly parallels the fast reduction and (slow- er) recovery. The mobility “walking” may resemble best physical activity, while mobility “transit/ public transpor- tation” may reflect social distancing/face mask wearing as people refrain to public transportation being afraid for SARS-Cov-2 transmission.
Limitations of the study are (a) the retrospective anal- ysis of a teleconsultation registry, not discharge diagnosis, (b) data from 12 hospitals of a larger network were used with a defined structure and defined standard operating procedures not optimized for the COVID-19 pandemic, and (c) incidence was different in each county of the par- ticipating hospitals [32]. However, the large amount of data of teleconsultations and the multicenter approach strengthen the results of this study.
Conclusions
Our study using the TEMPiS telestroke database dem- onstrate a parallel development of stroke consultations.
The magnitude of the decline in IV rtPA and EVT as an indicator for severe stroke as well as reports on reduced SAH and severe cardiac disease by other groups question the notion that only reluctance within the population to seek immediate medical assistance is solely responsible for this phenomenon. We postulate that factors related to mobility, especially reduced physical activity and reduced general infection due to social distancing measures, may significantly contribute as with rising mobility we observe higher stroke consultations in our telestroke network.
This effect may potentially complicate stroke treatment with regard to a “second wave.” Larger datasets on both, epidemiological data and behavioral changes during the COVID-19 pandemic are needed to shed light into this phenomenon.
Acknowledgements
The authors acknowledge all consulting neurologists in TEMPiS and colleagues in partner hospitals in Bad Reichenhall, Burglengen- feld, Ebersberg, Eggenfelden, Erding, Freising, Kelheim, Mühldorf, Rotthalmünster, Vilsbiburg, Dingolfing, and Zwiesel.
Statement of Ethics
This retrospective study was approved by the local Ethics Com- mittee of the University of Regensburg (20-1789-104) and per- formed in accordance with guidelines of the World Medical As- sociation Declaration of Helsinki.
Conflict of Interest Statement
The authors declare no conflict of interest related to this study.
Funding Sources
The authors did not receive any funding.
Author Contributions
F.S.: study design and first draft of the manuscript; S.W. and N.D.H.: data analysis and graphical layout; A.W., R.L.H., and R.A.L.: critical revisions of the manuscript; G.J.H.: study design and critical revisions of the manuscript.
References
1 Belani P, Schefflein J, Kihira S, Rigney B, Del- man BN, Mahmoudi K, et al. COVID-19 is an independent risk factor for acute ischemic stroke. AJNR Am J Neuroradiol. 2020 Aug;
41(8):1361–4.
2 Hoyer C, Ebert A, Huttner HB, Puetz V, Kall- münzer B, Barlinn K, et al. Acute stroke in times of the COVID-19 pandemic: a multi- center study. Stroke. 2020 Jul;51(7):2224–7.
3 Mao L, Jin H, Wang M, Hu Y, Chen S, He Q, et al. Neurologic manifestations of hospital- ized patients with coronavirus disease 2019 in Wuhan, China. JAMA Neurol. 2020 Jun 1;
77(6):683–90.
4 Miller A, Segan S, Rehmani R, Shabsigh R, Rahme R. Letter: dismantling the apocalypse narrative: the myth of the COVID-19 stroke.
Neurosurgery. 2020 Sep 5:nyaa419.
5 Oxley TJ, Mocco J, Majidi S, Kellner CP, Shoi- rah H, Singh IP, et al. Large-vessel stroke as a presenting feature of Covid-19 in the young.
N Engl J Med. 2020 May 14;382(20):e60.
6 Saxhaug Kristoffersen E, Holt Jahr S, Thom- messen B, Morten Ronning O. Effect of CO- VID-19 pandemic on stroke admission rates in a Norwegian population. Acta Neurol Scand. 2020 Dec;142(6):632–6.
7 Yaghi S, Ishida K, Torres J, Mac Grory B, Raz E, Humbert K, et al. SARS-CoV-2 and stroke in a New York healthcare system. Stroke. 2020 Jul;51(7):2002–11.
8 Zhang Y, Xiao M, Zhang S, Xia P, Cao W, Ji- ang W, et al. Coagulopathy and antiphospho- lipid antibodies in patients with Covid-19. N Engl J Med. 2020 Apr 23;382(17):e38.
9 Bhaskar S, Sharma D, Walker A. H, McDon- ald M, Huasen B, Haridas A, et al. Acute neu- rological care in the COVID-19 era: the Pan- demic Health System REsilience PROGRAM (REPROGRAM) Consortium Pathway. Front Neuro. 2020;11:579.
10 Khosravani H, Rajendram P, Notario L, Chapman MG, Menon BK. Protected code stroke: hyperacute stroke management dur- ing the coronavirus disease 2019 (COVID-19) pandemic. Stroke. 2020 Jun;51(6):1891–5.
11 Leira EC, Russman AN, Biller J, Brown DL, Bushnell CD, Caso V, et al. Preserving stroke care during the COVID-19 pandemic: poten- tial issues and solutions. Neurology. 2020 Jul 21;95(3):124–33.
12 Andersson C, Gerds T, Fosbøl E, Phelps M, Andersen J, Lamberts M, et al. Incidence of new-onset and worsening heart failure before and after the COVID-19 epidemic lockdown in Denmark: a nationwide cohort study. Circ Heart Fail. 2020 Jun;13(6):e007274.
13 Anteby R, Zager Y, Barash Y, Nadler R, Cor- doba M, Klang E, et al. The impact of the coro- navirus disease 2019 outbreak on the atten- dance of patients with surgical complaints at a Tertiary Hospital Emergency Department. J Laparoendosc Adv Surg Tech A. 2020 Sep;
30(9):1001–7.
14 Bernat AL, Giammattei L, Abbritti R, Froelich S. Impact of COVID-19 pandemic on sub- arachnoid hemorrhage. J Neurosurg Sci. 2020 Aug;64(4):409–10.
15 Bromage DI, Cannata A, Rind IA, Gregorio C, Piper S, Shah AM, et al. The impact of CO- VID-19 on heart failure hospitalization and management: report from a Heart Failure Unit in London during the peak of the pan- demic. Eur J Heart Fail. 2020 Jun;22(6):978–
16 Diegoli H, Magalhaes PSC, Martins SCO, 84.
Moro CHC, Franca PHC, Safanelli J, et al. De- crease in hospital admissions for transient ischemic attack, mild, and moderate stroke during the COVID-19 era. Stroke. 2020 Aug;
51(8):2315–21.
17 Diestro JDB, Li YM, Parra-Farinas C, Sarma D, Bharatha A, Marotta TR, et al. Letter to the editor ‘aneurysmal subarachnoid hemor- rhage: collateral damage of COVID?’ World Neurosurg. 2020 Jul;139:744–5.
18 Hall ME, Vaduganathan M, Khan MS, Papad- imitriou L, Long RC, Hernandez GA, et al. Re- ductions in heart failure hospitalizations dur- ing the COVID-19 pandemic. J Card Fail.
2020 Jun;26(6):462–3.
19 Teo KC, Leung WCY, Wong YK, Liu RKC, Chan AHY, Choi OMY, et al. Delays in stroke onset to Hospital arrival time during COV- ID-19. Stroke. 2020 Jul;51(7):2228–31.
20 Bhatt AS, Moscone A, McElrath EE, Varshney AS, Claggett BL, Bhatt DL, et al. Declines in hospitalizations for acute cardiovascular con- ditions during the COVID-19 pandemic: a multicenter tertiary care experience. J Am Coll Cardiol. 2020 Jul 21;76(3):280–8.
21 Bres Bullrich M, Fridman S, Mandzia JL, Mai LM, Khaw A, Vargas Gonzalez JC, et al. CO- VID-19: stroke admissions, emergency de- partment visits, and prevention clinic refer- rals. Can J Neurol Sci. 2020 May 26;47(5):
693–6.
22 Morelli N, Rota E, Terracciano C, Immovilli P, Spallazzi M, Colombi D, et al. The baffling case of ischemic stroke disappearance from the Casualty Department in the COVID-19 era. Eur Neurol. 2020;83(2):213–5.
23 Siegler JE, Heslin ME, Thau L, Smith A, Jovin TG. Falling stroke rates during COVID-19 pandemic at a comprehensive stroke center. J Stroke Cerebrovasc Dis. 2020 Aug;29(8):
104953.
24 Uchino K, Kolikonda MK, Brown D, Kovi S, Collins D, Khawaja Z, et al. Decline in stroke presentations during COVID-19 surge.
Stroke. 2020 Aug;51(8):2544–7.
25 Esenwa C, Parides MK, Labovitz DL. The ef- fect of COVID-19 on stroke hospitalizations in New York City. J Stroke Cerebrovasc Dis.
2020 Oct;29(10):105114.
26 Kamdar HA, Senay B, Mainali S, Lee V, Gu- lati DK, Greene-Chandos D, et al. Clinician’s perception of practice changes for stroke dur- ing the COVID-19 pandemic. J Stroke Cere- brovasc Dis. 2020 Oct;29(10):105179.
27 Kansagra AP, Goyal MS, Hamilton S, Albers GW. Collateral effect of covid-19 on stroke evaluation in the United States. N Engl J Med.
2020 Jul 23;384(4):400–1.
28 Kerleroux B, Fabacher T, Bricout N, Moïse M, Testud B, Vingadassalom S, et al. Mechanical thrombectomy for acute ischemic stroke amid the COVID-19 outbreak: decreased ac- tivity, and increased care delays. Stroke. 2020 Jul;51(7):2012–7.
29 Rudilosso S, Laredo C, Vera V, Vargas M, Renú A, Llull L, et al. Acute stroke care is at risk in the era of COVID-19: experience at a Comprehensive Stroke Center in Barcelona.
Stroke. 2020 Jul;51(7):1991–5.
30 Siegler JE, Heslin ME, Thau L, Smith A, Jovin TG. Falling stroke rates during COVID-19 pandemic at a comprehensive stroke center. J Stroke Cerebrovasc Dis. 2020 Aug;29(8):
104953.
31 Audebert HJ, Schenkel J, Heuschmann PU, Bogdahn U, Haberl RL; Telemedic Pilot Proj- ect for Integrative Stroke Care G. Effects of the implementation of a telemedical stroke network: the Telemedic Pilot Project for Inte- grative Stroke Care (TEMPiS) in Bavaria, Germany. Lancet Neurol. 2006 Sep;5(9):742–
32 Schlachetzki F, Theek C, Hubert ND, Kilic M, 8.
Haberl RL, Linker RA, et al. Low stroke inci- dence in the TEMPiS telestroke network dur- ing COVID-19 pandemic – effect of lock- down on thrombolysis and thrombectomy. J Telemed Telecare. 2020 Aug 18.
33 AoK. Available from: https://aok-bv.de/im- peria/md/aokbv/aok/zahlen/zuf_2018_ppt_
final.pdf.
34 Amukotuwa SA, Bammer R, Maingard J.
Where have our patients gone? The impact of COVID-19 on stroke imaging and interven- tion at an Australian stroke centre. J Med Im- aging Radiat Oncol. 2020 Oct;64(5):607–14.
35 Jasne AS, Chojecka P, Maran I, Mageid R, El- dokmak M, Zhang Q, et al. Stroke code pre- sentations, interventions, and outcomes be- fore and during the COVID-19 pandemic.
Stroke. 2020 Sep;51(9):2664–73.
36 Markus HS, Brainin M. COVID-19 and stroke-A global World Stroke Organization perspective. Int J Stroke. 2020 Jun;15(4):361–
4.
37 Aguiar de Sousa D, Sandset EC, Elkind MSV.
The curious case of the missing strokes during the COVID-19 pandemic. Stroke. 2020 Jul;
51(7):1921–3.
38 Plumereau C, Cho TH, Buisson M, Amaz C, Cappucci M, Derex L, et al. Effect of the CO- VID-19 pandemic on acute stroke reperfu- sion therapy: data from the Lyon Stroke Cen- ter Network. J Neurol. 2020 Sep 9.
39 Md Noh MSF. COVID-19 and cerebral hem- orrhage: proposed mechanisms. J Neurora- diol. 2020 Jun 1;S0150–9861(20):30194–2.
40 Lara-Reyna J, Yaeger KA, Rossitto CP, Cama- ra D, Wedderburn R, Ghatan S, et al. “Staying home”-early changes in patterns of neu- rotrauma in New York City during the CO- VID-19 pandemic. World Neurosurg. 2020 Nov;143:e344–50.
41 Qian Z, Kang H, Tang K, Jiang C, Wu Z, Li Y, et al. Assessment of risk of aneurysmal rup- ture in patients with normotensives, con- trolled hypertension, and uncontrolled hy- pertension. J Stroke Cerebrovasc Dis. 2016 Jul;25(7):1746–52.
42 Kato A, Minami Y, Katsura A, Muramatsu Y, Sato T, Kakizaki R, et al. Physical exertion as a trigger of acute coronary syndrome caused by plaque erosion. J Thromb Thrombolysis.
2020 Apr;49(3):377–85.
43 Chu DK, Akl EA, Duda S, Solo K, Yaacoub S, Schünemann HJ, et al. Physical distancing, face masks, and eye protection to prevent per- son-to-person transmission of SARS-CoV-2 and COVID-19: a systematic review and me- ta-analysis. Lancet. 2020 Jun 27;395(10242):
1973–87.
44 Marriott D, Beresford R, Mirdad F, Stark D, Glanville A, Chapman S, et al. Concomitant marked decline in prevalence of SARS-CoV-2 and other respiratory viruses among symp- tomatic patients following public health in- terventions in Australia: data from St Vin- cent’s Hospital and associated screening clin- ics, Sydney, NSW. Clin Infect Dis. 2020 Aug 45 Grau AJ, Urbanek C, Palm F. Common infec-25.
tions and the risk of stroke. Nat Rev Neurol.
2010 Dec;6(12):681–94.
46 Pagliano P, Spera AM, Ascione T, Esposito S.
Infections causing stroke or stroke-like syn- dromes. Infection. 2020 Jun;48(3):323–32.
47 Butt JH, Fosbøl EL, Østergaard L, Yafasova A, Andersson C, Schou M, et al. Effect of CO- VID-19 on first-time acute stroke and tran- sient ischemic attack admission rates and prognosis in denmark: a nationwide cohort study. Circulation. 2020 Sep 22;142(12):
1227–9.
48 Tielleman T, Bujanda D, Cryer B. Epidemiol- ogy and risk factors for upper gastrointestinal bleeding. Gastrointest Endosc Clin N Am.
2015 Jul;25(3):415–28.
49 Schmiderer A, Schwaighofer H, Niederreiter L, Profanter C, Steinle H, Ziachehabi A, et al.
Decline in acute upper gastrointestinal bleed- ing during Covid-19 pandemic after lock- down in Austria. Endoscopy. 2020 Nov;
52(11):1036–8.
50 Holt A, Gislason GH, Schou M, Zareini B, Biering-Sorensen T, Phelps M, et al. New-on- set atrial fibrillation: incidence, characteris- tics, and related events following a national COVID-19 lockdown of 5.6 million people.
Eur Heart J. 2020 Jun 1;41(32):3072–9.
51 Hu YF, Chen YJ, Lin YJ, Chen SA. Inflamma- tion and the pathogenesis of atrial fibrillation.
Nat Rev Cardiol. 2015 Apr;12(4):230–43.