EVALUATION OF SETA MEASURES
(WP 5.3)
MARCH 31ST, 2014
Authors:
Alexander Schnabl (IHS), Gerhard Platzer (TMC), Martha Ecker (IHS), Zuzana Filkova (IHS), Hans Fritzsche (TMC), Brigitte Hochmuth (IHS), Sebastian Koch (IHS), Sarah Lappöhn (IHS),
Alina Pohl (IHS), Barbara Zucker (IHS)
Table of contents
1 Introduction (IHS) ...8
2 Consolidated Economic Analysis (IHS) ...9
3 The SETA project and inputs from earlier work packages (IHS) ... 12
3.1 Bottleneck analysis ... 13
Objective ... 13
3.1.1 Scenarios ... 13
3.1.2 Reference case and additional SETA measures ... 15
3.1.3 3.2 Transport demand model results ... 16
3.3 Alternatives ... 17
4 Financial analysis (TMC) ... 20
4.1 Financial analysis approach ... 20
Evaluation of measures within the SETA process ... 20
4.1.1 The SIC! financial analysis approach ... 21
4.1.2 4.2 The calculation model in the financial analysis ... 30
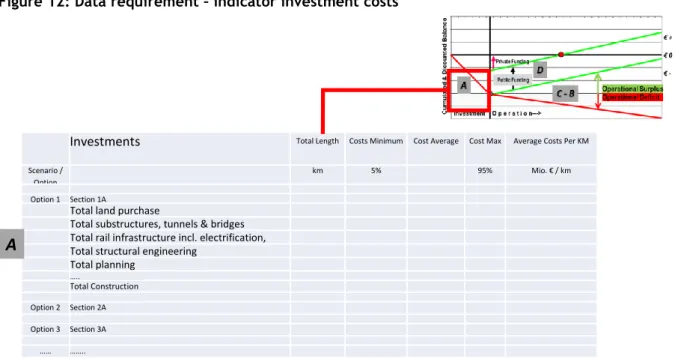
4.2.1 Indicator: Investment costs ... 31
4.2.1 Indicator: Maintenance costs and operation costs ... 32
4.2.2 Indicator: Infrastructure access charges ... 32
4.2.3 4.3 Basic Requirements ... 33
Infrastructure investment costs ... 34
4.3.1 Infrastructure maintenance and operating costs ... 39
4.3.2 Infrastructure revenues (access charges) ... 40
4.3.3 4.4 Financial analysis – results ... 43
Calculated parameters ... 43
4.4.1 Financial analysis of SETA infrastructure investments - financial quick 4.4.2 check ... 44
Financial analysis of SETA infrastructure investments - dynamic investment 4.4.3 analysis ... 45
Sensitivity analysis ... 47
4.4.4 4.5 Results of the financial analysis ... 50
5 Short-term economic effects (IHS) ... 53
5.1 Description of method ... 53
Multi-regional input-output model to assess the impact of construction and 5.1.1 maintenance on regional development ... 53
3 / 144
Input-output analysis... 53
5.1.2 Regionalisation of the input-output tables ... 55
5.1.3 Types of classifications ... 55
5.1.4 Construction of the input-output tables ... 56
5.1.5 Construction of the use table ... 58
5.1.6 Construction of the supply table ... 59
5.1.7 Methodology of the input-output analysis ... 60
5.1.8 Determination of specified expenditures effects ... 63
5.1.9 Added value effect, employment, wages and operating surplus ... 63
5.1.10 Purchasing power and employee charges ... 64
5.1.11 Consumption-induced effects ... 64
5.1.12 Summary of definitions of calculated effects ... 64
5.1.13 Assumptions ... 66
5.1.14 Necessary data ... 68
5.1.15 5.2 Results ... 68
Socio-economic effects – MRIOM - impacts of SETA measure expenses .... 68
5.2.1 Economic effects of investments and maintenance and operating expenses 5.2.2 ... 68
Effects of investments – national results ... 75
5.2.3 Effects of investments – regional results ... 78
5.2.4 5.3 Summary ... 83
6 Long-term economic effects (IHS) ... 85
6.1 Theoretical background: economic effects of transport infrastructure ... 85
Evaluation of effects in the construction phase ... 85
6.1.1 Evaluation of effects during the operating phase ... 85
6.1.2 6.2 Method description: regional accessibility-dependent model (EAR) ... 87
The IHS model (EAR 2.0) for assessing the operating phase ... 87
6.2.1 Accessibility ... 87
6.2.2 Regional production function ... 91
6.2.3 Estimating the factor elasticities of output ... 92
6.2.4 6.3 SETA and the EAR 2.0 Model ... 94
Objectives of the economic analysis ... 94
6.3.1 Data and statistical methods ... 94
6.3.2 Estimating factor elasticities of output using a Bayesian spatial 6.3.3 econometrical approach ... 95
Description of parameters: ... 95 6.3.4
4 / 144
6.4 Results of the IHS-EAR 2.0 model simulation ... 96
Data inputs and assumptions ... 96
6.4.1 Simulation of economic effects ... 99
6.4.2 6.5 Results ... 100
6.6 Results of Alternatives ... 105
6.7 Summary ... 105
7 Environmental and socio-economic evaluation (IHS) ... 107
7.1 Description of method ... 107
External effects included in the analysis ... 107
7.1.1 Air pollution ... 108
7.1.2 Global warming ... 109
7.1.3 External costs not included in this study ... 110
7.1.4 7.2 Results ... 110
National results ... 112
7.2.1 Regional results ... 114
7.2.2 Results of alternatives ... 115
7.2.3 Sensitivity of results ... 115
7.2.4 7.3 Summary ... 117
8 Consolidated economic analysis (IHS and TMC) ... 119
8.1 Consolidated summaries of financial analysis, short-term and long-term economic analysis, and environmental analysis ... 119
Results of the financial analysis ... 119
8.1.1 Results of the short-term economic effects (multi-regional input-output- 8.1.2 model) ... 121
Results of the long-term economic effects (IHS EAR 2.0 model) ... 122
8.1.3 Results of the environmental and socioeconomic analysis ... 122
8.1.4 8.2 Consolidated economic analysis ... 123
Consolidated economic analysis for SETA countries ... 124
8.2.1 Consolidated economic analysis for the EU28 countries ... 125
8.2.2 8.3 Conclusions ... 126
9 Literature ... 128
10 Appendix 1 ... 130
13 Appendix 2: Regional fact sheets ... 132
5 / 144
List of tables
Table 1: Reference case infrastructure measures ... 15
Table 2: Additional SETA measures ... 16
Table 3: Costs of individual additional SETA measures ... 19
Table 4: Comparison of CBA guidelines and SETA methodology ... 22
Table 5: SETA corridor: Railway freight traffic scenario results (volume of freight, number of trains) ... 26
Table 6: SETA corridor: RC investment measures and investment costs 2015-2030; Source: National development plans ... 34
Table 7: SETA corridor: RC planned investment cost (national development plans) ... 35
Table 8: SETA corridor: Additional (AM) investment measures and investment costs ... 36
Table 9: Additional (AM) infrastructure investment per railway section ... 37
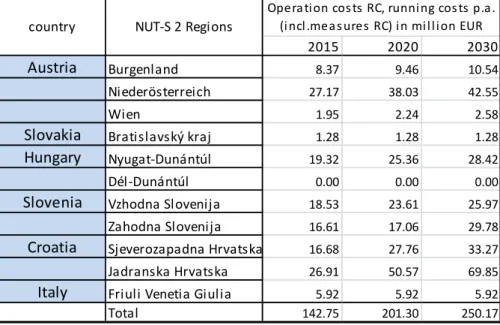
Table 10: SETA corridor: RC operating and maintenance costs (in million EUR p.a.) ... 39
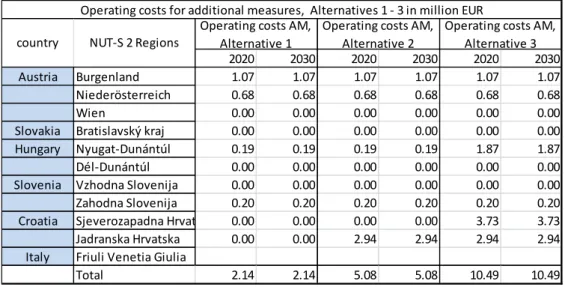
Table 11: O&M cost of additional measures 2015-2030 ... 40
Table 12: Access charges for use of infrastructure (2012) ... 40
Table 13: Weights and measures of railway wagons ... 41
Table 14: Calculation of revenues from access charges ... 42
Table 15: Static quick check ... 45
Table 16: Results of dynamic investment analysis, financial base scenario ... 46
Table 17: Results of dynamic investment analysis, O&M costs reduced by 20 % ... 48
Table 18: Results of dynamic investment analysis, O&M costs reduced by 20% and infrastructure access charge ... 49
Table 19: Recommended measures 1 ... 50
Table 20: Recommended measures 2 ... 51
Table 21: SETA corridor: Organisational measures ... 51
Table 22: SETA cash flow table (Alternative 3 – all measures) ... 52
Table 23: CPA 2008 goods classification ... 56
Table 24: Basic structure of an input-output table ... 58
Table 25: Basic structure of a use table ... 59
Table 26: Basic structure of the supply table ... 60
Table 27: Economic effects on value added in countries and regions for the three alternatives, in million EUR ... 69
Table 28: Economic effects on employment in person-years for the three alternatives on a country and regional basis... 71
Table 29: Economic effects on employment in full-time equivalent employees for the three alternatives on a country and regional basis ... 73
Table 30: Fiscal effects at national level for the three alternatives, in million EUR ... 74
Table 31: National effects of investments, investing countries, Alternative 1 ... 76
Table 32: National effects of investments, investing countries, Alternative 2 ... 76
Table 33: National effects of investments, investing countries, Alternative 3 ... 76
Table 34: National effects of investments, profiting countries, Alternative 1 ... 77
Table 35: National effects of investments, profiting countries, Alternative 2 ... 77
Table 36: National effects of investments, profiting countries, Alternative 3 ... 78
Table 37: Regional effects of investments, investing regions, Alternative 1 ... 79
Table 38: Regional effects of investments, investing regions, Alternative 2 ... 80
Table 39: Regional effects of investments, investing regions, Alternative 3 ... 81
Table 40: Regional effects of investments, profiting regions, Alternative 1 ... 82
6 / 144
Table 41: Regional effects of investments, profiting regions, Alternative 2 ... 82
Table 42: Regional effects of investments, profiting regions, Alternative 3 ... 83
Table 43: Calculation of AI ... 89
Table 44: Example of estimated parameters of the production function in case of sectorial model specification and an aggregate specification (based on experience in the past). ... 96
Table 45: Overall economic effects due to SETA measures, present values ... 100
Table 46: Average additional employment during operational phase ... 101
Table 47: Additional tax revenue ... 102
Table 48: Final results of long-term economic analysis based on IHS-EAR 2.0 model simulation. (GVA = Gross Value Added) ... 103
Table 49: Prices based on Watkiss et al. (2005) in EUR2002 (factor prices) per ton of CO2 equivalent emitted ... 109
Table 50: Overview of emissions reduced by SETA measures ... 111
Table 51: Present value of total positive effects of emission reductions in million EUR ... 113
Table 52: Net Present value by region in 2012 (base year 2012) ... 114
Table 53: Share of different monetised emissions by type (before discounting) ... 114
Table 54: SETA investment measures ... 120
Table 55: Aggregation of results for SETA countries, View 1 (potential subsidising institution) ... 124
Table 56: Aggregation of results for SETA countries, View 2 (tax revenues) ... 124
Table 57: Aggregation of results for SETA countries, View 3 (economic effects) ... 125
Table 58: Aggregation of results for the EU-28 countries, View 1 (potential subsidising institution) ... 126
Table 59: Aggregation of results for the EU-28 countries, View 3 (economic effects) ... 126
Table 60: Classifications for goods (CPA) and companies (NACE): sectors 01 to 30... 130
Table 61: Classifications for goods (CPA) and companies (NACE): sectors 31 to 74... 131
Table 62: Classifications for goods (CPA) and companies (NACE): sectors 75 to 99... 132
List of figures Figure 1: The IHS approach to consolidated economic analysis ...9
Figure 2: Profitable infrastructure investment project ... 11
Figure 3: Infrastructure project with negative FNPV and positive ENPV ... 11
Figure 4: The SETA corridor ... 12
Figure 5: Financial evaluation: basic scheme and data requirements ... 24
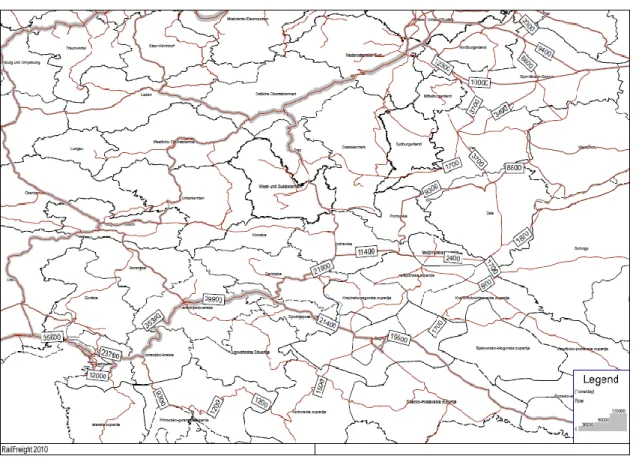
Figure 6: SETA corridor: Railway freight volume 2010 ... 27
Figure 7: SETA corridor: Railway freight volume 2015 ... 27
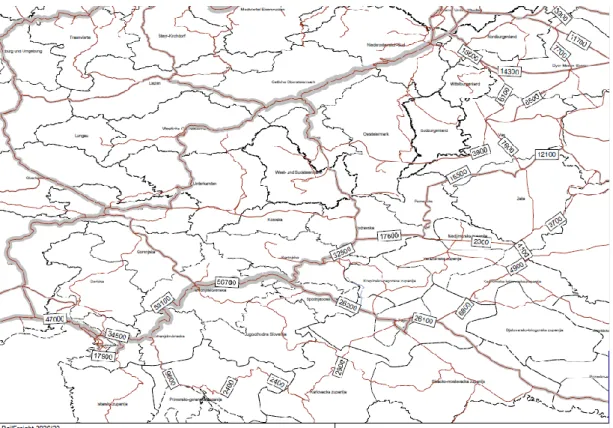
Figure 8: SETA corridor: Railway freight volume 2020 ... 28
Figure 9: SETA corridor: Railway freight volume – difference 2020 RC – 2020 AM ... 28
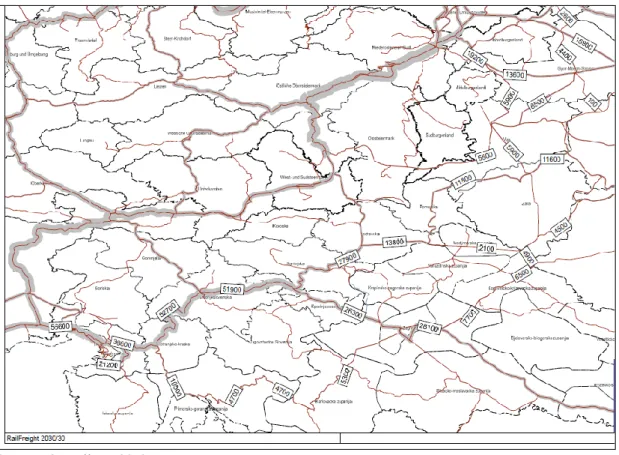
Figure 10: SETA corridor: Railway freight volume 2030 ... 29
Figure 11: SETA corridor: Railway freight volume 2030 (max) ... 29
Figure 12: Data requirement – indicator investment costs ... 31
Figure 13: Data requirement – O&M costs / infrastructure use fees (access charges) ... 32
7 / 144
Figure 14: Sensitivity analysis: Calculation model ... 33
Figure 15: SETA corridor: Additional infrastructural measures 2013-2020 ... 36
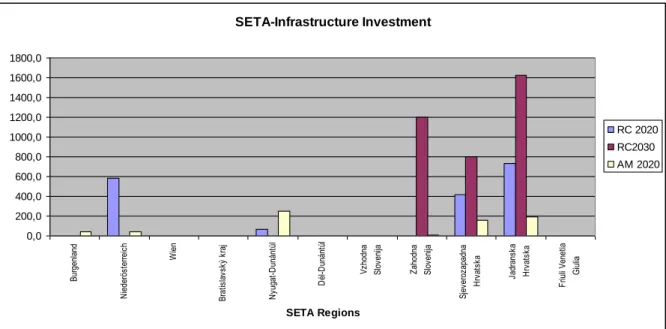
Figure 16: Infrastructure investment (RC + AM) per railway section ... 38
Figure 17: Rijeka: Upgrading and new construction of dry port – port railway connections 38 Figure 18: Cumulated, discounted cash flows, SETA measures vs. RC ... 46
Figure 19: Cumulated discounted cash flows, SETA measures only ... 47
Figure 20: Reduction in O&M costs by 20 % ... 48
Figure 21: Reduction in O&M costs by 20 % and increase in infrastructure use fees by 20 %49 Figure 22: Illustration of value creation effects, employment effects, purchasing power effects, and fiscal effects. ... 54
Figure 23: Schematic depiction of factors influencing the accessibility indicator ... 88
Figure 24: Economic activity weighted according to travel times, comparison of various β coefficients. ... 91
Figure 25: Schematic effects of an infrastructure project over time ... 93
Figure 26: GDP effects over time – present value method ... 94
Figure 27: Graphical summary of the travel time matrices: Relative savings in travel time for 2015. Relative savings in travel time for selected origin-destination connections (links) are coloured according to the region of origin. ... 98
Figure 28: SETA measures – GDP effects over time ... 100
Figure 29: Additional GVA in % due to SETA measures – 2015 values ... 104
Figure 30: Positive external effects by country and year in EUR ... 112
Figure 31: Distribution of cumulated monetised positive environmental effects by country, monetized present value 2012 ... 113
Figure 32: Shares of monetised emissions by emission types (before discounting) ... 115
Figure 33: Sensitivity analysis of monetised CO2 values (before discounting) ... 116
Figure 34: Sensitivity analysis of discounted effects over time. ... 117
8 / 144
1 Introduction (IHS)
Infrastructure projects lie at the centre of almost every development strategy. Both their installation costs and their effects on well-being in the regions involved can span over decades. What impacts is the South European Transport Axis (SETA) project expected to have on economic growth, employment, society and the environment? How does improved accessibility affect the investing regions? Do the potential benefits justify the financial investments in the project? These are the questions we intend to answer in the following chapters.
Following the EU 2020 cohesion policy of investment in smart, sustainable and inclusive growth, the proposed measures in the SETA project were designed with the goals of identifying bottlenecks in rail transport and providing efficient solutions towards a green transport future in the SETA region. This study aims to provide a broad insight into the socio-economic effects of SETA measures on a range of levels from the regional impacts of reductions in air pollutants to employment effects and impacts on European GDP.
In order to be able to tackle these questions adequately, crucial data input was required from the project partners, an aspect which is explained in more detail in Chapter 3.
This report is organised as follows:
First, a methodological introduction to the chosen evaluation approach is given (Chapter 2) and is followed by a description of inputs derived from previous Work Packages (Chapter 3). The subsequent chapters contain the Financial Analysis (Chapter 4), the estimation of Economic Effects (Chapters 5 and 6) and the Environmental and Socio-Economic Evaluation (Chapter 7). The results obtained are then aggregated in the central element of this evaluation study, the Consolidated Economic Analysis (Chapter 8), which also offers some conclusions on the viability of different SETA scenarios.
9 / 144
2 Consolidated Economic Analysis (IHS)
The Institute for Advanced Studies’ (IHS- Institut für Höhere Studien) approach to a Consolidated Economic Analysis (see Figure 1) consists of four parts and follows the overall goal of providing a complete analysis of an investment project, including its effects on the economy, society and the environment.
Figure 1: The IHS approach to consolidated economic analysis
Source: IHS – Institute for Advanced Studies, 2013
These four parts are as follows:
1. Financial analysis: The financial analysis concentrates on analysing effects from the point of view of a railway operator or railway infrastructure company. It takes account of investment costs, maintenance and operating costs as well as operating revenues. The financial analysis does not include any external effects.
2. Short term economic analysis: The assessment of short and medium term effects is based on multiregional input-output analysis methods. The IHS model concentrates on detailed regionalised input-output tables, which are compiled as appendices to national accounts and show the links between the individual production sectors in an economy and between its various regions.
3. Long term economic analysis: The economic benefits of infrastructure projects only become apparent with time. To estimate these effects, IHS has developed an accessibility-dependent regional model (EAR), which follows a Bayesian spatial econometric approach. Since improvements in accessibility facilitate a higher degree of economic interaction, the emphasis in this model lies on the evaluation -
10 / 144
on a NUTS21 level- of improved infrastructure in terms of additionally generated gross domestic product (GDP) or gross value added (GVA).
4. Environmental and social analysis: New or upgraded infrastructure does more than just improve accessibility between regions and nations. It also reduces the overall level of negative externalities, such as accidents, air pollution, noise and global warming. The IHS ESA model takes these external effects into account and supplies information on environmental and social effects on a local, national and international level.
In accordance with the 2008 EU Cost-Benefit Analysis (CBA) guidelines2, two performance indicators are of particular importance in a cost-benefit analysis, namely financial net present value (FNPV) and economic net present value (ENPV).
Whereas the FNPV represents the railway operator or railway infrastructure company perspective, the ENPV of a project includes not only economic effects but also social and environmental impacts. Both values represent a discounted monetary value of costs and benefits. In the case of the SETA, the evaluation and supplied information for decision makers are condensed into the ENPV.
Only a few infrastructure projects have a positive FNPV (see Figure 2 for a project that is profitable in the long run), and in many cases of infrastructure projects this value stays negative.
The ENPV, however, might still be positive (see Figure 3) since it includes the external effects of such infrastructure projects, such as increased accessibility for the regions involved, reduced number of accidents and a reduction in pollutant emissions. This, in turn, means that even though a project might not be profitable for an operator, it can be beneficial for society and should therefore still be implemented since the societal benefits (which in this case need to be monetized for comparison reasons) exceed the investment costs.
In order to correctly identify the overall costs and benefits of investments, the IHS approach focuses on the economic net present value (ENPV) of a project, i.e. the value which includes not only its economic effects but also its social and environmental impacts.
1 NUTS (Nomenclature of Territorial Units for Statistics) is a geocode standard for referencing the subdivisions of countries for statistical purposes used in the European Union.
2 European Commission (2008)
11 / 144 Figure 2: Profitable infrastructure investment project
Source: IHS – Institute for Advanced Studies, 2013.
Figure 3: Infrastructure project with negative FNPV and positive ENPV
Source: IHS – Institute for Advanced Studies, 2013.
12 / 144
3 The SETA project and inputs from earlier work packages (IHS)
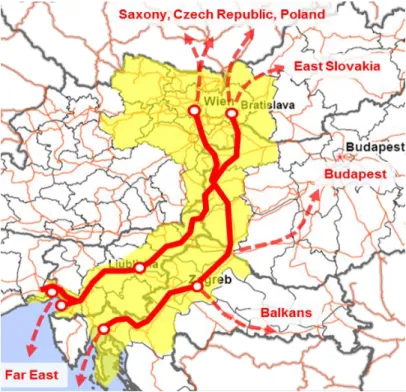
The SETA corridor provides an efficient railway connection on existing tracks between the European Core Network Corridors (CNC), the Baltic Adriatic Corridor, the Mediterranean Corridor, the Orient/East-Med Corridor and the Rhine-Danube Corridor.
Figure 4: The SETA corridor
The following railway sections are included in the SETA corridor:
- The Austrian section Wien Meidling - Wr.Neustadt – Sopron and Wien Meidling – Ebenfurth – Sopron
- The Slovak section from Bratislava hl st. – Rajka (Hungarian border)
- The Hungarian sections Sopron - Szombathely – Zalaszentiván – Nagykanisza – Gyékényes (Croatian border)
- The Hungarian sections Rajka – Hegyeshalom – Csorna – Porpác – Szombathely - The Hungarian sections Zalaszentivan – Hodoš (Őrihodos)
- The Slovenian sections Hodoš – Murska Sobota – Pragersko, Pragersko – Zidani most – Ljubljana – Pivka - Divača – Villa Opicina, Divaca – Koper and Pivka –Šapjane
- The Croatian sections Botovo – Koprivnica – Zagreb – Karlovac – Rijeka and Rijeka – Šapjane
- The Italian sections Villa Opicina – Trieste, Trieste - Monfalcone
13 / 144
Inputs from previous Work Packages and project partners - especially WP 4 on traffic system analysis - provide an essential background for the evaluation of SETA measures. The goal in WP 4 was to define requirements for the transport system (especially rail transport) as well as to develop strategies and network scenarios to eliminate deficiencies (bottleneck analysis) and allow the implementation of an effective, competitive (rail) transport service.
3.1 Bottleneck analysis Objective 3.1.1
The objective of the bottleneck analysis (Output 4.4.1 by TMC, will further on be referred to as Bottleneck Report) was to identify obstacles which hamper the SETA corridor in providing a competitive connection between the CENTROPE region3 and the Northern Adriatic seaports of Rijeka, Koper and Monfalcone. All types of bottlenecks (technical, administrative, legislative, information) were included in the analysis. In addition, a reduction in greenhouse gas emissions was sought to ensure any improvements to the transport infrastructure were sustainable.
The main results of this analysis include scenario definitions (see 3.1.2 below), detailed descriptions of the SETA railway network and transport conditions as well as a list of SETA bottleneck elimination measures for the scenario years 2015, 2020 and 20304.
No alternative routes were calculated in the SETA corridor, since any future developments will lie not in the construction of new buildings but in the customized upgrading of the existing (and already operational) railway lines. To produce a continuous rail corridor that meets the same technical and infrastructural requirements in all sections and to allow direct train links between the SETA regions and the Northern Adriatic Ports, both the infrastructure measures envisaged in the national development plans for the period to 2030 within the scope of the reference cases 2015-2030 (RC) and the necessary additional measures (AM) required to resolve the “bottlenecks”5 were considered.
Scenarios 3.1.2
According to the different time horizons necessary for the implementation of proposed infrastructural measures the dates 2015, 2020 and 2030 were chosen. In addition to infrastructural measures, the bottleneck scenarios also include organisational measures designed primarily to reduce the clearly high passenger and freight waiting times in the existing rail transport network. Corresponding expansions in the rest of the European transport network were also taken into account for all expansion periods. Special attention was paid to measures and periods of planned expansion in the adjoining Baltic Adriatic Corridor (BATCO).
3 An INTERREG IIIA project to establish a multinational region in Central Europe encompassing four European countries: Slovakia, Austria, Hungary and Czech Republic.
4 see Bottleneck Report, p. 119
5 see Bottleneck Report, p. 119
14 / 144
The following scenarios were specified in the bottleneck analysis6:
Scenario 2015 “short-term measures”
“For the year 2015 changes of design speed from 140 km/h to 160 km/h are only foreseen for the section Krizevci-Dugo Selo on the Croatian line Gyekenyes/Botovo – Zagreb, where also a 2nd track is available for this section after the year of 2015.
Also till 2015 the Hungarian Dieses section Szombathely should be electrified. In all the other part of the SETA railway network till 2015 no other measures are expected to be completed, design speed, number of tracks and traction should remain more or less on the existing level in the SETA-network.
Additional measures, which are feasible as short term measures till 2015 are primarily organizational measures. Nevertheless these measures are able to reduce the travel time between Vienna and Zagreb at about 50 minutes.
At 2015 direct railway connections between the CENTROPE region and he Northern Adriatic ports will not yet be available, on the one hand due to the missing interoperability, which is focused on the section Szombathely – Zalaszentivan, and on the other hand due to the changing of traction in the Austrian section Wr.Neustadt – Sopron ad on the Hungarian section Zalaszentivan – Nagykanisza.”
Scenario 2020 “medium-term measures”
“In this period till 2020 most of the national renewal and recovery programs should be finished, so that the aspired level of 120 km/h for passenger and 100 km/h for freight trains can be achieved for a large part of the SETA network. Additional measures will allow reducing travel time for passenger trains between Vienna and Zagreb of 37 Minutes. Together with the additional measures of 2015 the reduction amounts to 1 h 30 minutes, together with the increased speed, a travel time of less than 4 hours can be expected.
Direct trains could run the whole SETA Corridor to the Northern Adriatic ports of Rijeka, Koper and Monfalcone. The bottlenecks on the Croatian sections will be solved; a comparable safety system will allow interoperability and the operation of direct trains.”
Scenario 2030 “long-term measures”
“In this period the last measures (Moravice – Rijeka) will be finished. The planned renewal and upgrading of the SETA railway network will be completed. For this period no additional measures have been generated.
Special attention is to spend to the complementary European railway network, in particular to the BATCO axis. The planned completion of the new axis was given at 2023/24. For the period till 2030 the new axis has to be taken into consideration.”
6 Bottleneck Report, p. 121
15 / 144
Reference case and additional SETA measures 3.1.3
Based on the scenario descriptions above and their corresponding tables7, the infrastructure measures for the reference case and the additional SETA measures that were developed are described in Tables 1 and 2 below.
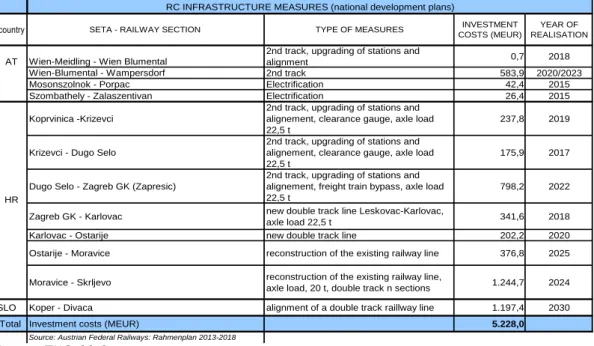
Table 1: Reference case infrastructure measures
Source: TMC, 2013.
Please note that the above measures represent those infrastructure measures that are already planned and are included in the relevant country’s national development plan. The implementation of these measures is used to establish the reference case. They thus do not form part of the financial, economic and socio-environmental effects of the SETA measures described below.
7 see Bottleneck Report, p. 122, 124, 126
country SETA - RAILWAY SECTION TYPE OF MEASURE INVESTMENT COSTS
(million EUR)
YEAR OF REALISATION
Wien-Meidling - Wien Blumental 2nd track, upgrading of stations
and alignment 0.7 2018
Wien-Blumental - Wampersdorf 2nd track 583.9 2020/2023
Mosonszolnok - Porpac Electrification 42.4 2015
Szombathely - Zalaszentivan Electrification 26.4 2015
Koprvinica -Krizevci
2nd track, upgrading of stations and alignment, clearance gauge, axle load 22,5 t
237.8 2019
Krizevci - Dugo Selo
2nd track, upgrading of stations and alignment, clearance gauge, axle load 22,5 t
175.9 2017
Dugo Selo - Zagreb GK (Zapresic)
2nd track, upgrading of stations and alignment, freight train bypass, axle load 22,5 t
798.2 2022
Zagreb GK - Karlovac new double track line Leskovac-
Karlovac, axle load 22,5 341.6 2018
Karlovac - Ostarije new double track line 202.2 2020
Ostarije - Moravice reconstruction of the existing
railway line 376.8 2025
Moravice - Skrljevo
reconstruction of the existing railway line, axle load, 20 t, double track on few sections
1 244.7 2024
SLO Koper - Divaca realignment of a double track
raillway line 1 197.4 2030
Total Investment costs (million EUR) 5 228.0
REFERENCE CASE INFRASTRUCTURE MEASURES (national development plans)
AT
HU
HR
Source: Austrian Federal Railways: Rahmenplan 2013-2018
16 / 144 Table 2: Additional SETA measures
Source: TMC, 2013.
The additional SETA measures described here form the basis of all further evaluations within the SETA project. Their costs, for instance, were evaluated and subsequently entered into the financial analysis in Chapter 4 on page 10.
The additional SETA measures also have implications for passenger and freight transport demand. Thus, they also form the basis for the transport demand model (Work Package 4.3.1 by IBV Fallast). The next section provides a brief summary of the results of that particular Work Package. The results of the transport demand model are needed as inputs for the consolidated economic analysis.
3.2 Transport demand model results
In order to provide an economic impact analysis as described in Chapter 8 (consolidated economic analysis), the effect(s) of the additional SETA measures have to be analysed using a transport demand model. With the help of the TRANSTOOLS traffic model, the measures in the “reference cases” and the “additional measures” were simulated in terms of changes in passenger and freight transport. Results from the bottleneck analysis8 were fed into transport demand model (Output 4.3.1 by IBV Fallast) with the aims of showing the current state of traffic flows, forecasting future traffic flows and examining the additional effects of the SETA measures along the SETA corridor. Outputs supplied by this transport model report include changes in travel time(s), goods volume(s) and passenger traffic flows due to SETA measures.
Output of the transport demand model needed for further analysis:
8 Bottleneck Report
Country SETA - RAILWAY SECTION TYPE OF MEASURE INVESTMENT
COSTS (MEUR)
ANTICIPATED YEAR OF REALIZATION
Neudörfl, Sauerbrunn, Mattersburg Side tracks 2015
Wr.Neustadt - Sopron Electrification 2020
Ebenfurth Loop 2020
Steinbrunn Side track 2020
Bősárkány & Csorna Reduction of block distance 2015
Hegyeshalom-Csorna Increasing the loading class 2020
Szombathely Reduction of block distance + reconstruction of station 2020
Csorna-Porpác Increasing the loading class 2020
Nagycenk &Lövő Electrification of third side track 2015
Körmend-Zalalövö Electrification 2020
Vasvar & Egervár Lengthening of side tracks 2020
Szombathely - Zalaszentivan Increasing axle loading class 2020
Zalaszentivan - Nagykanizsa Electrification 2020
Zalaszentiván Loop 2020
Zalaszentivan - Nagykanizsa Increasing axle loading class 2020
Nagykanizsa Lenghten side track 2020
Gyekenyes/Zarkany Loop 2020
Koprvinica-Kotoriba 2nd track 2020
Skrljevo-Rijeka-Matulj Dry port connection 2020
SLO Koper - Divaca 3 side tracks 2020
To be determined
in financial analyis AT
HU
HR
ADDITIONAL SETA MEASURES
(NOTE: The measures shown here do NOT form part of the respective country's national development plan, BUT do form part of the additional SETA measures)
17 / 144
- Travel time for passenger trains (origin/destination matrix) - Travel time for freight trains (origin/destination matrix)
- Volume of passengers transported by rail (origin/destination matrix) - Volume of goods transported by rail (origin/destination matrix) - Travel time for cars (origin/destination matrix)
- Travel time for trucks (origin/destination matrix)
- Volume of passengers transported by road (origin/destination matrix) - Volume of goods transported by road (origin/destination matrix)
All of the above are needed for the following cases in order to evaluate the changes resulting from the SETA measures:
- Reference case 2015 and case including the SETA measures 2015 - Reference case 2020 and case including the SETA measures 2020 - Reference case 2030 and case including the SETA measures 2030
Further, the transport demand model was needed to derive input values for the following environmental and socio-economic variables9:
- CO2 (carbondioxide) - NOx (nitrogen oxide)
- PM10, PM2.5 (particulate matter) - NMHC (non-methane hydrocarbons) - SO2 (sulphur dioxide)
- N2O (nitrous oxide) - CH4 (methane)
All of the above are then included into the consolidated economic analysis.
3.3 Alternatives
So far, the only differentiation has been between
1.) the reference case or reference scenario (which is sometimes also referred to as the ‘BAU’ or ‘business-as-usual’ scenario) and
2.) the SETA scenario, which consists of measures at three different points in time (2015, 2020, and 2030)
The term “scenario” is in fact somewhat misleading here, since the three “scenarios” - scenario 2015, scenario 2020 and scenario 2030 - developed in the bottleneck analysis are actually one scenario consisting of measures at three different points in time.
During the process of determining the costs for each individual additional SETA measure the need for a further differentiation became apparent for the following reason:
Since not every measure included in the list of additional SETA measures (see Table 2) has the same cost or effect and to permit the identification of the most effective and
9 Ideally, data on severe injuries, minor injuries and noise levels would also be considered.
18 / 144
economic measure, the results of the bottleneck analysis were also used to categorise the additional SETA measures into three alternatives.
These three alternatives were developed based on the following considerations:
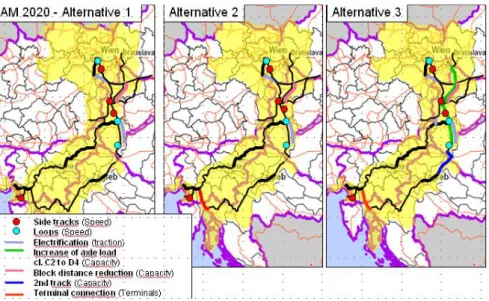
Alternative 1 includes all measures that reduce travel time.
Alternative 2 includes all measures that reduce travel time (Alternative 1) AND eliminate capacity constraints on the Skrljevo-Rijeka line.
Alternative 3 includes all measures that reduce travel time (Alternative 1) AND eliminate capacity constraints on the Skrljevo-Rijeka line (Alternative 2) AND improve capacities, especially by improving axle loading class.
In other words, Alternative 1 is a subset of Alternative 2, which is a subset of Alternative 3, which represents all measures identified as additional SETA measures.
For reasons of completeness and brevity, some results of the financial analysis are anticipated below, namely the costs of each individual SETA measure.
Note: The assessment of the three different alternatives was only possible in the financial analysis. However, the transport demand model is only set up in line with Alternative 2, since Alternative 2 (which includes Alternative 1) captures all travel time changes and assumes the installation of all measures that reduce capacity constraints (a working assumption of the accessibility-dependent regional model (version 2.0) that was subsequently applied).
19 / 144 Table 3: Costs of individual additional SETA measures
Source: TMC, 2013.
Al terna tive 1 Al terna tive 2 Al terna tive 3
Side tracks Neudörfl, Sauerbrunn, Mattersburg 2.8 2.8 2.8
Electrification Wr.Neustadt - Sopron 28.4 28.4 28.4
Loop Ebenfurth 44.8 44.8 44.8
Side track "Steinbrunn" 13.0 13.0 13.0
Bősárkány & Csorna reduction of block distance 0.7 0.7 0.7
Hegyeshalom-Csorna increasing the loading class* 33.9
Szombathely reduction of block distance +
reconstruction of station 7.5 7.5 7.5
Csorna-Porpác increasing the loading class* 47.9
Nagycenk &Lövő electrification of third side track 0.3 0.3 0.3 Upgrading of Körmend-Zalalövö line (and
electrification) 22.1
Vasvar & Egervár lengthening of side tracks 0.6 0.6 0.6
Increasing axle loading class Szombathely -
Zalaszentivan* 44.4
Electrification Zalaszentivan - Nagykanizsa 31.0 31.0 31.0
Zalaszentiván loop 6.0 6.0 6.0
Increasing axle loading class Zalaszentivan -
Nagykanizsa* 44.5
Nagykanizsa lenghten side track 2.4 2.4 2.4
Loop Gyekenyes/Zarkany 6.0 6.0 6.0
2nd track Koprvinica-Kotoriba 161.9
Dry port connection Skrljevo-Rijeka-Miklavje 189.1 189.1
SLO 3 side tracks Koper - Divaca 6.8 6.8 6.8
Total Investment costs (million EUR) 150.2 339.3 694.0
ADDITIONAL SETA MEASURES Investment costs in million EUR SETA - RAILWAY SECTION
country
AT
HU
HR
2020
20 / 144
4 Financial analysis (TMC)
4.1 Financial analysis approach
Evaluation of measures within the SETA process 4.1.1
The SETA corridor includes sections of railway lines in Austria, Slovakia, Hungary, Croatia, Slovenia and Italy, and the proposed rail infrastructure improvements measures affect seven national railway companies. All these railway companies have presented – in coordination with their respective national government – development plans for their railway infrastructure to 2020 and 2030. In the course of the “bottleneck analysis”, it was verified whether these proposed measures would be sufficient to ensure the following objective defined for the whole SETA corridor:
Creation of a continuous rail link with direct connections between the CENTROPE regions, the other SETA regions and the northern Adriatic ports of Rijeka, Koper and Monfalcone/Trieste.
This requires uniform conditions for the transport of passengers and goods throughout the SETA corridor in relation to
traction
safety standards
speed
axle loads
organisation.
In addition to infrastructure measures by national railway companies for the expansion of individual sections of the SETA corridor, all additional measures (not provided for in national development plans) required to implement a continuous, competitive rail corridor were identified and determined in WP4.4 under the lowest cost premise. Examples of such measures include:
the electrification of continuing diesel routes (even after implementation of the planned expansion programmes)
small measures (e.g. connection loops) to speed up the traffic flow
selected measures for the unification of security systems
measures for the uniform increase of axle loads
small measures to increase the line capacity (Dodge)
organisational measures to reduce waiting time.
The objective of this report is to assess the financial, economic and ecological relevance and feasibility of these additional measures as a basis for their subsequent financing.
The cost-benefit analysis (CBA) for investment projects is explicitly required in the new EU regulations for the Structural Fund (SF), the Cohesion Fund (CF) and the structural instruments for the preparation of EU accession (ISPA) for all projects with a total budget in excess of 50 million EUR, 10 million EUR and 5 million EUR respectively. While Member
21 / 144
States are responsible for the initial assessment, the Commission has to assess the quality of these projects to authorize the proposal for co-financing and to set the co-financing rate.
Co-financing of infrastructure projects by the Structural Fund (SF), the Cohesion Fund (CF) and ISPA are an important support for the implementation of EU regional policies (cohesion policy). According to EU regulations, infrastructural and productive investments may be financed by one or more of the Community’s financial tools - mainly grants (SF, CF, but also as repayable aid for the ISPA), loans and other financial tools (European Investment Bank).
According to SF Reg. 1260/1999, Art. 26, CF Reg. 1265/1999, Art. 1 and ISPA Reg.
1267/1999, Annex II (C), the Commission is responsible for the prior appraisal of major projects on the basis of information given by the proposer.
Community regulations indicate which information must be included in the respective application form for the purposes of allowing an effective evaluation on the part of the Commission. Article 26 of SF Reg. 1260/99, which covers the co-financing of major projects, asks for:
a cost-benefit analysis,
a risk analysis,
an evaluation of the environmental impact (and the application of the Polluter Pays Principle), and
an assessment of impact on equal opportunities and employment.
In addition to stating that the proposals for co-financing must contain a cost-benefit analysis, a risk analysis and a detailed indication of the alternatives rejected, the regulations regarding the Cohesion fund and the ISPA also require the inclusion of some indications of the criteria to be applied to ensure the quality of the evaluation.
For the period from 2014 – 2020, the plan is to attach more importance to the regional impact of infrastructural measures than to CBA. The SETA evaluation approach also satisfies this condition.
The SIC! financial analysis approach 4.1.2
The approach to financial analysis applied within the present project follows the one eveloped in the Interreg IIIb CADSES project “Sustrain implement corridor” (SIC!), Vienna 2007.
With the separation of railway companies into separate sales and infrastructure divisions (EU Directive 91/440/EC) and the financing of infrastructure maintenance and operating costs through charges for its use (access charges), the question of the evaluation of infrastructure measures has to be asked anew. As an essential (ongoing) income from the infrastructure, the access charge (AC) deserves special interest. Assuming that a) the assessment relates to the whole SETA corridor and b) that any measures taken by a railway company in one country will affect the other railway companies in the corridor, a cost- benefit assessment based on the optimal benefit to each individual company is not
22 / 144
possible. The optimal measures for the individual railway companies are not necessarily identical with the optimal measures for the entire corridor.
The consideration of the impact of infrastructure measures for the railway company and revenues are therefore also not the content of the assessment of infrastructure measures.
In the SETA financial analysis, revenues are limited to the proceeds of infrastructure use (access charge). While in the case of road funding the high proceeds derived from toll revenues can be used to refinance, no comparable high revenues are available in the case of railway infrastructure from access charges/IBE. In addition, even if this might have been the original intent, the high investments required in the rail sector from an economic perspective cannot be refinanced – in contrast to their counterparts in the roads sector – entirely through the access charge. The rail sector is therefore reliant on federal grants for refinancing. This fact is reflected in the financial analysis, where the changing contribution of access charges and their contribution to the repayment of the investment is taken into account to cover the infrastructure operating costs (with consistent federal grants). The revenues considered in the financial analysis are those that accrue to the owner of the infrastructure. This method has some advantages over the recommendation that consideration be given to revenues accruing to the operational users of the infrastructure.
Table 4: Comparison of CBA guidelines and SETA methodology
Source: TMC, 2013.
The financial analysis follows the EU’s recommendations and is based on the internal interest rate method. It consists of three parts:
the financial analysis, which determines the financial rate of return of capital employed
23 / 144
the economic analysis, where costs and benefits are discounted and compared according to the net present value method. As an evaluation measure, the value of capital, economic profitability and the cost-benefit ratio are determined.
the risk analysis, in which the critical variables (or assumptions) are varied (sensitivity analysis) in order to document the stability of earnings, describe the risks and discuss measures to reduce existing risks.
PPP considerations (SIC! approach)
Back in 2002, the European Commission had already urged a reinforced coordination of public financing instruments for the railway sector and the development of adequate procedures for public-private partnership (PPP) projects. Funding opportunities through EU venture capital funds and guaranties were announced. In the case of the rail sector, the Commission clearly realised that there is a large financing gap on the one hand and only limited experience with PPP projects on the other. The financial analysis therefore also sought to evaluate the reasonableness of the use of private capital for the financing of infrastructure projects.
Prominent examples of PPP projects in the European rail sector can be found for the following high speed lines:
Channel Tunnel Rail Link (UK)
HSL Zuid (NL)
Perpignan-Figueras (E/F)
All these projects aimed - in addition to a cost-efficient construction of infrastructure – to improve the speed and reliability of rail transport. The private shares in the projects were financed through deployment payments (such as the shadow tolls used for the HSL Zuid line) but also through user fees (real tolls such as in the case of Perpignan-Figueras).
In the PPP considerations for the SIC! Project, the fundamental issues were:
1. Given the defined investment volume for new and upgraded lines, can the charges obtained for infrastructure usage (“real tolls”) cover the running costs for operation and maintenance (O+M) of the line?
2. Will there be a surplus after deduction of O+M which could be used to cover interest and capital costs?
This can be presented in a simplified graphic way as follows:
24 / 144 Figure 5: Financial evaluation: basic scheme and data requirements
Source: TMC, 2013.
This scheme will also be used as a base for the financial analysis of the SETA project.
4.1.2.1 The future railway development scenarios (2015-2020-2030)
Scenarios of future development usually consist of different alternative routes. In the SETA project no alternative routes were calculated, but 3 different levels of investment measures as SETA does not rely on high investment as a basis of future development but in the customized upgrading of the existing (and already operating) railway lines. To produce a continuous rail corridor that meets the same technical and infrastructural requirements in all sections and to allow direct train links between the SETA regions and the Northern Adriatic Ports, both the infrastructure measures envisaged in the national development plans for the period to 2030 within the scope of the reference cases 2015-2030 (RC) and the necessary additional measures (AM) required to resolve the “bottlenecks” (see Bottleneck Report p. 127ff) were considered. In addition to the infrastructural measures, the bottleneck scenarios also include organisational measures designed primarily to reduce the clearly high passenger and freight waiting times in the existing rail transport network.
Corresponding expansions in the rest of the European transport network were also taken into account for all expansion periods. Special attention was paid to measures and periods of planned expansion in the adjoining BATCO corridor.
The starting point for the scenario calculation is the year 2012. Based on the frequencies of rides and the infrastructure required for passenger and freight transport in this year, and with the help of the TRANSTOOLS traffic model, the measures in the “reference cases”
and the “additional measures” were all simulated in terms of the change in frequencies of rides in the passenger and freight transport.
The calculations were carried out for the following scenarios (see Bottleneck Report p.123ff):
Scenario 2015 “short-term measures”
Includes the scheduled measures specified in the national development plans.
Additional measures are primarily measures that lead to a considerable reduction in
25 / 144
waiting times. Infrastructural measures were proposed only to a limited extent.
There are no continuous uniform transport connections for passengers or freight.
Scenario 2020 “medium-term measures”
By this point in time, the majority of the measures envisaged in the national development plans will be completed. These are not all measures that are necessary to enable continuous, uniform transport conditions across the entire corridor Additional measures were developed and grouped into three alternatives.
The continuous electrification of the entire SETA corridor, for example, should be completed by 2020 as a result of the additional measures. There will be a few bottlenecks on sections of the Zagreb-Rijeka line, which can only be eliminated in the 2020-2030 period through infrastructure measures implemented in line with the national development plans.
Scenario 2030 “long term measures”
This scenario represents the maximum transport potential for sections of the SETA corridor. We distinguish between two different variants in the “long term measures” scenario:
The expected passenger and freight volumes in 2030 (identified using the traffic demand model) were taken as the base of the financial analysis.
The maximum freight volume assumes that the maximum loading capacity foreseen for trains in the ports of Koper and Rijeka in 2030 can actually be used (90 trains per day for Koper and 128 trains per day for Rijeka). This is equivalent to an annual railway tonnage of around 15 million tons in Koper or 23 million tons in Rijeka, or 2.5 T EUR per year (Bottleneck Report, p.38ff)
In an additional scenario (2030 maximum incl. BATCO scenario), the completion of the Baltic Adriatic Corridor (BATCO) was assumed and its impact in relation to the shift of traffic flows for freight traffic was calculated. On the basis of these calculations, a reduction of the transport substrate on the SETA axis of around 7 % is to be expected.
These “shifting potentials“ will be exceptionally high for Slovenian destinations, with drive shifts of up to 20 % calculated on the Slovenian rail lines in the SETA corridor. On the other hand, increases in train frequencies for connections to the BATCO corridor can also be expected. In contrast, the competition through the expanded BATCO axis will be of no importance for Croatian destinations. A comparison with a moderate development in freight traffic (2030 RC) shows that the following requirements are a necessity for the management of the maximum traffic volume (2030 max): a twin-track continuous expansion of the Zagreb-Rijeka line, a direct port connection and a continuous connection between Skrljevo-Rijeka-Opatija-Sapjane. As far as the interpretation of these results is concerned, it should also be mentioned that the designated values are valid for the entire section. Trains which only use parts of the sections (e.g. local suburban services) were not taken into account in the calculations.
26 / 144 Table 5: SETA corridor: Railway freight traffic scenario results (volume of freight, number of trains)
Source: IBV Fallast, TMC, 2013.
In passenger transport terms, average increases in passenger volumes of up to 25 % were calculated for all periods (2012-2030). However, the additional measures could lead to a potential increase of 40 %. It is quite evident - particularly for the period from 2012 – 2020 - that the measures planned in the national development plans (RC) will only result in small increases in passenger traffic (+13 %). The implementation of the proposed additional measures needs to be carried out in time (as proposed) in order to be effective in 2020. If this is indeed the case, an increase in passenger volumes of up to 31 % could be achieved. The effects of the additional measures to 2030 were calculated on the basis of 27 % more passengers than without the additional measures. The results of the demand model calculations (2012-2030) indicate another situation for railway freight traffic, where the calculated growth in the volume of freight will increase by 71 %. The effect of the additional measures for the same period was calculated to be 23 % higher than a situation without the proposed additional measures. In 2020, the calculated effect was +37 %.