on Photocatalytic Reactions and Photochromic Materials
Dissertation
zur Erlangung des Doktorgrades der Naturwissenschaften (Dr. rer. nat.)
an der Fakultät für Chemie und Pharmazie der Universität Regensburg
vorgelegt von
Hanna Bartling
aus Rosenheim
August 2016
Promotionsgesuch eingereicht am 19.08.2016
Die Arbeit wurde angeleitet von: Prof. Dr. Ruth M. Gschwind Promotionsausschuss:
Vorsitzender: PD Dr. Rainer Müller
1. Gutachter: Prof. Dr. Ruth M. Gschwind 2. Gutachter: Prof. Dr. Burkhard König 3. Prüfer: Prof. Dr. Werner Kremer
Themenstellung und die intensiven und fruchtbaren Diskussionen, die ganz entscheidend zum Gelingen dieser Arbeit beigetragen haben. Darüber hinaus möchte ich mich für die Möglichkeit bedanken, ein Teil des Graduiertenkollegs 1626 „chemical photocatalysis“ zu sein, durch das ich meine Kompetenzen über das Fachliche hinaus erweitern konnte.
Herrn Prof. Dr. Burkhard König danke ich für die Übernahme des Zweitgutachtens, für die erfolgreiche Kooperation bei dem THIQ Projekt und die Betreuung im Rahmen des GRK 1626.
Bei Herrn Prof. Dr. Werner Kremer und Herrn PD Dr. Rainer Müller möchte ich mich für die Ausübung des Amtes als Prüfer bzw. als Vorsitzende recht herzlich bedanken.
Der Deutschen Forschungsgemeinschaft (DFG) danke ich für die finanzielle Unterstützung im Rahmen des Graduiertenkollegs 1626 „Chemische Photokatalyse“.
Meiner Kooperationspartnerin des THIQ Projekts Anna Eisenhofer gilt mein besonderer Dank für ihr großes Engagement und ihr Fachwissen, das sie in dieses Projekt eingebracht und ihre Geduld mit der sie die vielen gemeinsamen Stunden intensiver Arbeit bereichert hat. Ohne sie wäre dieses Projekt so nicht möglich gewesen. Den Forschungspraktikanten Nane Eiber und Daniel Schneider danke ich für ihre Mitarbeit und ihr Engagement.
Meinen Kooperationspartnern des Spiropyran/Merocyanine Projekts, Frau Prof. Dr. Christina Thiele, Dr.
Christiane Wolff und Jonas Kind möchte ich herzlich für die Möglichkeit danken, unseren LED Aufbau auf ein neues Feld der Chemie auszuweiten und gemeinsam an diesem Projekt zu arbeiten.
Herr Dr. Christian Feldmeier danke ich für die intensive Zusammenarbeit, die vielen Anregungen und Gespräche, die mir den Einstieg in die Photokatalyse sehr erleichtert haben. Zudem möchte ich mich für die Möglichkeit, an den gemeinsamen Projekten des LED-Aufbaus und der Flavin-Katalyse mitzuwirken, bedanken.
Einen besonderen Dank möchte ich all meinen aktuellen und ehemaligen Kollegen aussprechen, die mir stets mit Rat und Tat zur Seite standen und mit so manchen Uni- und Freizeitaktivitäten für ein angenehmes Arbeitsklima sorgten. Dr. Diana Drettwan, Dr. Evelyn Hartmann, Dr. Maria Neumeier, Dr.
Christian Feldmeier, Dr. Felicitas von Rekowski, Dr. Carina Koch, Dr. Michael Haindl, Michael Hammer, Nils Sorgenfrei, Florian Hastreiter, Julian Greindl, Andreas Seegerer, Kerstin Rothermel, Philipp Nitschke, unseren PostDocs Dr. Johnny Hioe, Dr. Fabio Morana, Dr. Maxime Melikian, Dr. Polyssena Renzi, Dr. Lokesh Nanjundappa, dem Nachwuchs Nele Berg, Verena Streitferdt und Daniel Schneider.
Euch allen vielen vielen Dank! Ein riesiges Dankeschön geht an meine Unimädels Franziska Fendt, Veronika Kropf, Carina Koch und Kathrin Magerl für die unzähligen Kaffepausen, Feierabendbiere, o.ä.
welche für den nötigen Ausgleich sorgten und nicht zuletzt für eure Unterstützung in allen Lebenslagen. Ihr seid die Besten!
Den Mitarbeitern der NMR-Abteilung, Dr. Ilya Shenderovich, Fritz Kastner, Annette Schramm, Georgine Stühler, sowie unserer TA Nikola Kastner-Pustet und unserer Sekretärin Ulrike Weck gilt mein Dank für ihre Hilfe und Unterstützung in allen technischen und bürokratischen Fragen.
Ein großes Dankeschön geht auch an meine Freunde innerhalb und außerhalb der Uni, da sie stets Verständnis aufbrachten, ein offenes Ohr für mich hatten oder einen wichtigen Ausgleich zum Arbeitsalltag schufen.
Vor allem aber gilt mein Dank meiner Familie und meinem Freund Stephan, ohne deren Rückhalt, Zuspruch, Verständnis und Glaube an mich diese Arbeit nicht zustande gekommen wäre. Danke für euer Vertrauen, eure Geduld und eure Unterstützung.
Vielen Dank!
NMR Spectroscopic Investigations on Photocatalytic Reactions and
Photochromic Materials
Table of Content
1 Introduction and Outline ... 1
2 LED based NMR Illumination Device for Mechanistic Studies on Photochemical Reactions – Versatile and Simple, yet Surprisingly Powerful ... 5
2.1 Abstract ...7
2.2 Introduction ...9
2.3 Materials and Methods ... 10
2.4 Results and Discussion ... 13
2.5 Conclusions ... 16
2.6 Additional Findings ... 17
2.7 References ... 18
3 The Photocatalyzed Aza-Henry Reaction of N-Aryltetrahydro-isoquinolines — Comprehensive Mechanism, H•- versus H+-Abstraction and Background Reactions ... 21
3.1 Abstract ... 23
3.2 Introduction ... 25
3.3 Results and Discussion ... 28
3.4 Summary of the Mechanistic Proposal and Conclusion ... 40
3.5 Supporting Information ... 43
3.6 Additional Findings ... 71
3.7 NMR spectra ... 90
3.8 References ... 96
4 LED-illuminated NMR Studies of Flavin-Catalyzed Photo-oxidations Reveal Solvent Control of the Electron-Transfer Mechanism ... 103
4.2 Introduction ... 107
4.3 Materials and Methods ... 107
4.4 Results and Discussion ... 109
4.5 Conclusions ... 112
4.6 Supporting Information[1] ... 113
4.7 References ... 132
5 Spiropyran/Merocyanine — Studies of a Photochromic Model System
Using NMR with Ex-Situ and In-Situ Irradiation Devices ... 137
5.1 Abstract ... 139
5.2 Introduction ... 141
5.3 Materials and Methods ... 142
5.4 Results and Discussion ... 143
5.5 Conclusions ... 150
5.6 Supporting Information ... 152
5.7 Additional Information ... 159
5.8 References ... 161
6 Summary... 165
7 Zusammenfassung ... 169
1 Introduction and Outline
The idea of using sunlight to promote chemical processes has been growing, since Giacomo Ciamician proclaimed the impending energy problematic in 1912. Very early he realized that the sun is the most efficient sustainable energy source mankind can harness. However, only in the last decades the urgency to replace fossil materials by sustainable sources and therewith the use of sunlight for a multitude of applications has increased tremendously. Nowadays, the adoption of visible light became a major topic in organic synthesis, which is reflected in the fast increasing number of publications. In contrast to the multitude of synthetic applications, only an evanescent number of mechanistic studies investigating photochemical and photo- catalytic reactions have been published. However, an in-depth knowledge of the reaction mechanisms and the ongoing processes is of utmost importance for an efficient reaction de- sign. The method of choice for the investigation of light absorbing processes constitutes UV/Vis spectroscopy, due to its ultrashort time resolution, even enabling the detection and characterization of excited states and electron transfer processes. Until now, NMR spectros- copy played only a minor role for the investigation of photochemical and photocatalytic reac- tions, due to its comparatively low sensitivity and time resolution. Nevertheless, it is a power- ful spectroscopic method, providing structural information not only of light absorbing mole- cules but all kinds of diamagnetic species, as well as insights into aggregation and solvent effects or chemical exchange processes. Taking into account the laser based compositions, commonly used for Photo-CIDNP studies, we developed an LED based NMR illumination de- vice. Due to their high energy lasers are not prone to follow chemical reactions, as they often lead to fast degradation processes. In contrast, LEDs exhibit many advantages for the moni- toring of photocatalytic reactions and offer comparability with the synthetically used light sources. By applying a new strategy for the sample illumination inside the magnet the full capacity of this powerful method NMR spectroscopy can be exploited for the investigation of light induced processes. After implementation of the illumination setup prominent model re- actions were chosen to examine the potential as well as the limitations of the setup. Demon- strating the diversity, central photocatalytic reactions as well as photochromic materials were investigated, using excitation wavelengths ranging from ultraviolet to visible light.
In chapter 2 the LED based illumination device is presented. This setup allows for the in situ illumination of NMR samples thus, providing a new approach for the detection and character- ization of photochemical processes by NMR spectroscopy. The setup consists of an optical fiber, guiding the light of the LEDs into the sample placed inside the magnet. The operation of the LEDs by the spectrometer hardware enables both continuous illumination as well as pulsed mode. The application of short duty cycles in combination with reasonable high light intensities made the setup suitable even for time resolved Photo-CIDNP spectroscopy.
In chapter 3 the cross-dehydrogenative coupling reactions of N-aryl-tetrahydroisoquinolines and in particular the aza-Henry reaction were investigated. An in depth mechanistic study including in situ and ex situ NMR techniques, ESR measurements and synthetic strategies re- vealed, that the aza-Henry reaction can be divided into three main reaction types: the back-
1 Introduction and Outline
ground reaction independent of light, the light-induced background reaction and the photo- catalyzed process. The latter can be further separated into a hydrogen atom abstraction and a deprotonation pathway, depending on the terminal oxidant. The study combined NMR and ESR spectroscopy as well as synthetic strategies, to provide an exceptional comprehensive picture of the overall mechanism.
In chapter 4 the flavin-catalyzed photooxidation of benzyl alcohol was studied by using the in situ illumination setup. The reaction was performed in acetonitrile and acetonitrile/D2O mix- tures, since from synthesis strongly deviating reaction rates were known, however their origin remained so far unclear. The NMR spectra and reaction profiles, supported by Photo-CIDNP and UV/Vis measurements revealed the solvent dependent stabilization of a flavin semiqui- none radical. The solvent properties turned out to be responsible for the stabilization of the zwiterionic ion pair and thus for the subsequent reaction mechanism. Depending on the ex- perimental conditions flavin was found to be capable of acting as a one- or two-electron ac- ceptor in solution, which has so far only been observed for proteins.
In chapter 5 the in situ illumination setup is applied for the investigation of photochromic materials. A spiropyran/merocyanine structure was selected to examine the switching behav- ior of this model system before embedding the photo switch into polymers. The photo- chromic properties of the compounds were studied in dependency on solvent, sample con- centration, temperature, light intensity and irradiation wavelength. Regarding additional in- formation e.g. about the excitation process of the metastable compound, the in situ setup revealed to be superior to the ex situ illumination. Furthermore, insights into the stationary states could be gained and the setup provided access to two dimensional NMR spectroscopy and carbon chemical shifts, unknown before.
ly Powerful
The setup was developed and tested in close collaboration with Dr. C. Feldmeier. The prepara- tion of the fiber tip and the corresponding measurements were conducted by H. Bartling.
Christian Feldmeier, Hanna Bartling, Eberhard Riedle, Ruth M. Gschwind J. Magn. Reson. 2013, 232, 39–44.
DOI: 10.1016/j.jmr.2013.04.011
© 2013 Elsevier Inc. Reproduced with permission.
2.1 Abstract
2.1 Abstract
An LED based illumination device for mechanistic studies on photochemical reactions by means of NMR spectroscopy is presented. The LEDs are directly switched by the NMR spec- trometer with the help of a one-stage electronic circuit. This allows for continuous or alterna- tively pulsed operation of the LEDs. Continuous operation provides direct comparability with conditions in synthetic chemistry, in pulsed operation the short time light power can be en- hanced ninefold. The LEDs are efficiently coupled to a 1000 μm core optical fiber guiding the light into the spectrometer by simply bringing it in close contact to the fiber. The tip of the fiber is roughened by sandblasting and thus emits light in a uniform and efficient way over the full length of the receiver coil. The combination of these techniques tremendously in- creases the amount of light brought into the NMR sample and makes LEDs an easy, versatile and handy light source for the in situ illumination of NMR samples allowing even for single millisecond time resolved Photo-CIDNP spectroscopy.
2.1 Abstract
2.2 Introduction
A detailed understanding of the mechanisms of chemical reactions is essential for their appli- cation and further development. In classical catalytic reactions such as applied in organocatal- ysis and transition metal catalysis, NMR has proven to be a very powerful tool for revealing diamagnetic intermediate species and for mechanistic investigations. For example, recently the elusive enamine intermediates,[1] the Breslow intermediate,[2] the key intermediate in enan- tioselective palladium catalyzed allylic substitution,[3] or Brønsted acid catalysis intermediates[4]
were detected and characterized by means of NMR. However, to apply the whole variety of NMR methods to photochemical reactions it is essential to be able to run the reaction inside the spectrometer, which implies that the NMR sample has to be illuminated inside the spec- trometer. This not only allows the in situ detection of diamagnetic intermediates in photore- actions but also the analysis of the kinetics and reaction mechanisms. In situ illumination of NMR samples is applied in various different fields such as organometallic photochemistry[5] or monitoring the kinetics of protein folding.[6,7]
In addition to the standard NMR spectroscopic approaches feasible for reactions in the dark, there is a special hyperpolarization technique applicable exclusively to photoreactions, the Photo-CIDNP spectroscopy.[8-10] Caused by the influence of the nuclear spin state on the inter- system crossing in radical pairs the Photo-CIDNP effect results in anomalous NMR signal in- tensities. The power of the CIDNP effect is that even extremely short-lived precursor radicals, not detectable in ESR, leave traces in the signal intensity pattern of their diamagnetic products detectable by NMR.[11,12] In this way not only standard NMR techniques can be used for mech- anistic studies on photocatalytic systems but even paramagnetic radical intermediates can be detected and characterized by means of NMR. However, both the application of well- established NMR techniques to photochemical reactions and the Photo-CIDNP spectroscopy require the illumination of the samples inside the spectrometer.
Various approaches have been reported to illuminate the sample inside the spectrometer and to guide the light into the sample using lasers or various lamps as light sources.[5,13] The illumi- nation of the sample from the side or from below by selected types of light guides is an ap- proach compatible with both continuous wave light sources and intense pulsed lasers, but requires modifications of the NMR probe and hampers uniform illumination of the NMR sam- ple. By using an optical fiber to guide the light into the spectrometer the sample can be illu- minated from the inside by placing the tip of the optical fiber into a coaxial insert.[14] Illumina- tion uniformity is improved by replacing the coaxial insert by a cone shaped insert[6,7] or by tapering the optical fiber stepwise[13] making the tip of the fiber emit light over the whole range of the receiver coil, instead of just from above. A shutter placed in the optical path and synchronized with the NMR spectrometer controls the illumination of the sample and allows the implementation of well-defined light pulses in NMR pulse sequences.[14,15]
LEDs provide an extraordinarily inexpensive, energy saving and easy to handle light source available in a huge diversity of wavelengths in the infrared, visible and ultraviolet range.
Among other reasons LEDs have therefore become the light source of choice in the recently rapidly expanding area of photocatalysis.[16-20] Despite these indisputable advantages LEDs have so far not been used as light sources for systematic illumination of NMR samples to the best of our knowledge.
2.3 Materials and Methods
Here we present a notably versatile, easy and inexpensive setup for the illumination of NMR samples using LEDs as light source. To achieve maximal and uniform illumination of the sam- ple (i) the LEDs are switched directly by the spectrometer, (ii) they are brought in direct con- tact with the optical fiber and (iii) the tip of the optical fiber inserted in the sample is rough- ened by sandblasting. This setup allows both, the investigation of photo catalytic reactions under synthetic conditions and by pulsed operation of the LEDs even millisecond time re- solved Photo-CIDNP spectroscopy.
2.3 Materials and Methods
2.3.1 Circuit – light source
As light source different LEDs are used for the described setup. The high power LEDs are con- trolled by an electronic circuit, shown schematically in Figure 2.1 a. It consists of a power supply, the LED, a potentiometer to regulate the current through the LEDs and a transistor switched by a TTL signal from the time control unit of the spectrometer. With this circuit the LED can be switched on and off directly by the spectrometer. The potentiometer controls the current through the LEDs and so they can be operated as (i) continuous wave (cw) devices (at specified maximum cw operation currents or below) or (ii) in a pulsed manner at much higher currents. By pulsing the LEDs significantly higher short time powers for the duration of a short pulse in a low duty cycle can be achieved. The currents applied to the LEDs are usually limited by the heat the LEDs produce. However, if heating is minimized by a combination of short light pulses, proper heat dissipation methods realized by an aluminum heat sink, and low duty cycles currents higher by as much as a factor of 9 than those recommended for continuous operation can be used and significantly higher peak output light powers can be achieved. This technique is used in various different fields such as imaging flow velocimetry,[21] high speed photography[22] or laser-flash-photolysis.[23]
Additionally, an opto-isolator is placed between the time control unit of the spectrometer and the LED circuit in order to isolate the two units galvanically and thus to protect the spectrom- eter time control unit from high and rapidly changing currents from the LED circuit.
In the described way the LED light can be controlled by a spare spectrometer time control unit output. However, to implement defined light pulses into pulse sequences for time resolved CIDNP-spectroscopy[12] it is important to know how fast the LEDs respond with respect to the TTL signal from the spectrometer. Additionally to the intrinsic response time of the LEDs the circuit with the opto-isolator causes an delay between the TTL output signal of the spectrom- eter and the LED light. To determine the total delay between the TTL pulse and the response of the LED light a photo resistor was used. The total delay was determined by simultaneously measuring the voltage at the TTL signal input and the voltage across a photo resistor illumi- nated by the LED at the time when the LED was switched on and off, Figure 2.1 b. The upper graph shows the LED response (LED output) for a 10 ms pulse of the spectrometer output on the millisecond time scale. The lower graph reveals on the microsecond time scale that the response time of the LED in this setup is about 3-8 μs. For millisecond time resolved experi- ments this delay is insignificant. However, for time resolved experiments on smaller time scales it has to be considered when the pulse sequences are implemented. The exponentially
increasing light output in the first few μs is most likely due to heating of the LED that increas- es the efficiency. If this variation in illumination power is of concern, it can readily be compen- sated with an improved current control circuit that applies a slightly higher voltage and cur- rent initially and then decreases it over the next few μs.
Figure 2.1 (a) Scheme of the circuit used to control and to pulse the LEDs, consisting of a power sup- ply, a potentiometer to adjust the current through the LED and a transistor controlled by the spectrom- eter. (b) The upper graph shows the response of the LED to a 10 ms pulse from the spectrometer out- put on a milliseconds time scale and the lower graph reveals at microsecond time resolution that the response time of the LED in this setup is about 3-8 μs.
2.3.2 Light source – optical fiber
The light from the high power LEDs is guided into the sample by 14 m of a BFH optical fiber with 1000 m diameter purchased from Thorlabs. Due to the direct switching of the LED by the spectrometer, a shutter in the light path as it is often described in the literature[11,12,14] can be omitted. As a result it is possible to bring the LED in direct contact with the end of the optical fiber, enabling much higher light intensities by avoiding loss due to the strongly di- verging LED output or due to additional optics. The light emitting area of the LED is about the same size as the cross section of the optical fiber core. The silicone lens of the LED is cut off and so the optical active part of the LED is brought in even closer contact with the end of the fiber guaranteeing optimal coupling of the LED to the fiber. As LEDs we found the following models well suited for our application, but other are likely equally suitable: Cree XP-E, Nichia SMD, LUXEON Rebel LXML, LUXEON K2 LXK2.
2.3.3 Optical fiber - sample
The light guided by the optical fiber from the LEDs into the spectrometer has to illuminate the NMR sample in a way that the whole sample inside the measurement coils is illuminated effi- ciently and uniformly.
For this the claddings of the optical fiber tip were stripped off, the main part of the fiber was masked and the 21 mm at the tip of the fiber were sandblasted to roughen its surface and thus make it emit light over this whole range instead of just from its tip. Siliciumcarbid 180
NMR spectrometer time control unit TTL
power supply
potentiometer different
LEDs transistor
0 1 2 3 4 5 6 7 8 0 2 4 6 8 10 12 14 16
time (ms)
time (µs)
voltage (u.a.)voltage (u.a.)
Spec trometer output LED output
Spec trometer output LED output
a) b)
2.3 Materials and Methods
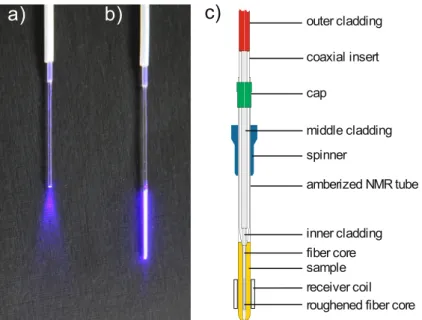
was used as the abrasive mineral. Figure 2.2 a and b show the light emission of the untreated fiber compared to the light emission of the roughened fiber. Whereas the untreated fiber emits light in a cone-shaped manner just from its tip, the roughened fiber emits light over the whole roughened area. Roughening the optical fiber is a remarkable easy, fast and hazard- free method to treat the tip of the optical fiber compared to other reported techniques as the etching with hydrofluoric acid.[13]
Optimal and uniform illumination of the NMR sample in the measuring coils of the spectrome- ter is ensured by aligning the light emitting area of the fiber to the coils, schematically shown in Figure 2.2 c. For this the optical fiber is inserted in a standard Rototec-Spintec stem coaxial insert which is retained in a Rototec-Spintec 5 mm NMR-Tube 7 inch 535-PP-7 similar as in the setup presented by Scheffler et al..[14] The coaxial insert centers the optical fiber in the NMR tube and the shim coils. Moreover the insert prevents direct contact of the fiber with the sample and thus makes it very easy to handle.
Figure 2.2 (a) Picture of an untreated fiber tip emitting light from just its tip in a cone- shaped manner.
(b) Picture of the roughened fiber tip emitting light uniformly over the whole roughened range. (c) Scheme of the optical fiber inserted in a coaxial inlet inside the NMR tube. To guarantee uniform illu- mination along the z-axis the tip of the fiber is roughened over the whole range of the receiver coil.
Optimal and uniform illumination of the NMR sample in the measuring coils of the spectrome- ter is ensured by aligning the light emitting area of the fiber to the coils, schematically shown in Figure 2.2 c. For this the optical fiber is inserted in a standard Rototec-Spintec stem coaxial insert which is retained in a Rototec-Spintec 5 mm NMR-Tube 7 inch 535-PP-7 similar as in the setup presented by Scheffler et al..[14] The coaxial insert centers the optical fiber in the NMR tube and the shim coils. Moreover the insert prevents direct contact of the fiber with the sample and thus makes it very easy to handle.
2.3.4 Sample preparation - measurement
With the described setup all photochemical reactions tested so far can be followed by NMR spectroscopy. In addition, with this setup the identical light sources can be used for synthetic applications and NMR investigations allowing for direct comparisons. No deviations in the
receiver coil fiber core inner cladding outer cladding
roughened fiber core sample
coaxial insert cap
amberized NMR tube middle cladding spinner
a) b) c)
products, reactivities, yields or trends found by the synthetically working chemists were found in the reactions tested so far, like in the flavin catalyzed photo oxidations,[24-26] the ary- lation of heteroarenes with diazonium salts,[27] the photocatalytic coupling of N-arylamines with nucleophiles[28,29] or in spiropyran photochromism.[30]
The most demanding test for the scope and limitations of LEDs used for the illumination of NMR samples and connected mechanistic studies are Photo-CIDNP and especially time re- solved Photo-CIDNP experiments, because there, short light pulses of high intensities are re- quired.[12] The intensity of the CIDNP signals is directly proportional to the photochemical turnover.[12] Therefore the intensity of a Photo-CIDNP signal is used as a direct measure for the amount of light brought into the NMR sample and to test the effect of the three innovations.
As a test reaction the flavin catalyzed photo oxidation of benzyl alcohols to the corresponding aldehydes was used.[24-26,31] The reduced flavin is reoxidized by oxygen. Flavins in general are a common model system for CIDNP studies, because falvin radicals have suitable magnetic properties and are prone to show CIDNP-signals. For this reason flavins are often employed as photosensitizers for CIDNP-studies on proteins.[11,32]
For the measurements 2 mM riboflavin tetra acetate (RFT) and 20 mM methoxybenzyl alcohol (MBA) were dissolved in CD3CN and the sample was purged with argon for 1 h. NMR spectra were recorded on a Bruker Avance 600 spectrometer with a 5 mm broadband triple reso- nance z-gradient probe. The temperature of 300 K was controlled by a Bruker BVTE 3000 unit. As a light source a Cree XP-E high power LED with a center wavelength of 455 nm and 500 mW optical output power was used, according to the absorption maximum of RFT.[26] To determine the current through the LED the voltage on a resistance in series with the LED was measured. As a measure for the light intensity in the sample the Photo-CIDNP signal intensity of the aromatic proton of RFT at 7.89 ppm was chosen (Figure 2.3 a) because this proton shows a well baseline separated and emissive Photo-CIDNP signal. The CIDNP-spectra were taken as the difference spectra between the 1H spectra of the illuminated sample and the dark sample.
2.4 Results and Discussion
In the following the three innovations for the in situ illumination of NMR samples are tested.
This was done by measuring the Photo-CIDNP polarization of the flavin aromatic proton with altered setups. First, the new easy and efficient way to roughen the fiber tip and thus to im- prove illumination uniformity over the whole sample is tested. Second, the effective coupling of the LED with the optical fiber possible through the direct switching of the LED by the spec- trometer was investigated. Third, the pulsed operation of the LEDs to achieve higher short time powers was tested.
The effect of the roughened fiber tip was tested by measuring the Photo-CIDNP polarization of the flavin aromatic proton. For that the light 1H spectra were measured with a 30° rf pulse and 16 scans, while illuminating the sample with a constant LED current of 1 A and with the LED directly coupled to the optical fiber. Alternating dark 1H spectra with a 30° rf pulse and 16 scans were measured and subtracted from the illuminated spectra to yield the Photo- CIDNP spectra.
2.4 Results and Discussion
The 1H spectra with maximum CIDNP-intensity are shown in Figure 2.3 b. With the setup the difference in the CIDNP intensities between the two tips of the optical fiber is pleasantly large.
Using the roughened fiber instead of the untreated one the maximal CIDNP polarization was increased by a factor of about 3. These results are due to the improved uniform illumination by the roughened tip. The untreated fiber emits light in a cone-shaped manner just from its tip, whereas the roughened fiber emits light over the whole roughened range (see Figure 2.3 a and b).
Figure 2.3 (a) Structure of riboflavin tetraacetate. The emissive Photo-CIDNP signal of the encircled aromatic proton appearing at a chemical shift of 7.89 ppm was observed for the Photo-CIDNP experi- ments. (b) 1H Photo-CIDNP intensities of the aromatic RFT proton for the concentration of 2 mM RFT and 20 mM MBA in acetonitrile, measured with the untreated tip (left) and the roughened tip of the optical fiber (right).
So as a first achievement, roughening the optical fiber by sand blasting is a remarkable easy, fast and hazard-free method to treat the tip and make it emit light over the whole area of the receiver coil in a very efficient and uniform manner.
Next the effect of an optimized coupling of the glass fiber with the LEDs was tested. For that purpose (a) a setup leaving 0.5 cm space for a shutter, (b) a setup with direct attachment of the glass fiber to the LED and (c) a setup with direct attachment of the LED with a cut off silicone lens to the optical fiber were compared, see Figure 2.4. For that the Photo-CIDNP polarization of the aromatic proton of RFT are used as the difference spectra of illuminated and dark 1H spectra with a 30° rf pulse and 16 scans each and illumination during the whole measurement. The reduction of the distance between diode and the end of the fiber core leads to a huge increase in light power and thus CIDNP polarization. The setup without the need of a shutter in the light path increases the signal intensity by a factor of about 20 (Figure 2.4 B). Further reduction of the distance between diode and fiber core by cutting off the LED silicone lens leads to a further increase in light intensity and CIDNP polarization (Figure 2.4 C).
In total the signal intensity is increased by a factor of about 30 compared to the setup with space for a shutter. The output power of the optical fiber coupled in the described way was measured to be about 50 mW.
untreated tip roughened tip
N N
NH N
O O OAc
OAc AcO
AcO
a) b)
Figure 2.4 (a) Setup with 0.5 cm space for a shutter between the optical fiber and the LED and the corresponding Photo-CIDNP signal of the aromatic proton of RFT. (b) Setup with the LED in direct con- tact with the optical fiber and the effect on the Photo-CIDNP signal. (c) Setup with the silicone lens of the LED cut off and direct contact to the optical fiber and the effect on the Photo-CIDNP signal.
The described setup provides an extraordinary easy and efficient way to couple the LEDs to the optical fiber without the need of specially designed and cumbersome optics.
Finally the gain in CIDNP-intensity and thus in light intensity by the pulsed operation of the LEDs was investigated. For this purpose the sample was illuminated by a short light pulse of only 1 ms length after a relaxation delay D1 of 120 s. The relaxation delay ensures the com- plete relaxation of all polarization and a sufficiently low duty cycle of the LED. The light pulse was directly followed by a 30° rf pulse on the proton channel and acquisition. Then the same pulse sequence was applied without the light pulse to record the dark spectrum which was then subtracted from the light spectrum to yield the Photo-CIDNP spectrum. Both the light and the dark spectrum were recorded with one single scan only. In this way five different Photo-CIDNP spectra were acquired with rising currents through the LED. Starting with the manufacturer recommended maximum current of 1 A the current was raised in steps of 2 A up to 9 A. Figure 2.5 shows the Photo-CIDNP intensity in dependence on the current through the LED. At a current of 1 A no Photo-CIDNP signal is detectable for the aromatic proton of RFT. A detectable signal with low signal to noise ratio appears at 3 A. Further increase of the current strongly enhances the Photo-CIDNP signal. Figure 2.5 b reveals that the increase of the Photo-CIDNP signal is proportional to the LED current which results in an increase of the signal by a factor of about 9 for the presented measurements. The LED used for the tests broke down at currents higher than 9 A. With shorter light pulses, with other LEDs or with additional cooling of the LEDs a further increase of the light intensities and thus the Photo- CIDNP signals can be expected. This shows that the pulsed operation of the LEDs enables light intensities much higher than at standard operation. Through these high light intensities Pho- to-CIDNP signals can be enhanced tremendously and otherwise not detectable signals be- come detectable even at the millisecond time scale. This paves the way to millisecond time resolved Photo-CIDNP spectroscopy even with this comparativly simple setup.
LED board inner cladding
silicone lens
diode fiber core
heat sink
b) c
a) )
2.5 Conclusions
Figure 2.5: (a) The Photo-CIDNP signal of the RFT aromatic proton for light pulses of 1 ms length and for LED currents of 1 A (maximum current for continuous operation) up to 9 A. (b) The Photo-CIDNP intensity shows a linear dependency on the current through the LED.
2.5 Conclusions
Despite the clear benefits of LEDs compared to other light sources, such as easy handling, low cost, availability in a huge variety of wavelengths and direct comparability with conditions in synthetic chemistry LEDs have not been used as light sources for the systematic illumination of a NMR sample yet. Here an innovative LED based device for the in situ illumination of NMR samples is presented. The combination of an efficient coupling of the LEDs to the optical fi- ber, a specially prepared fiber tip and the high power pulsed operation of the LEDs allows for tremendous increases in the amount of light brought into the NMR sample. The LEDs are di- rectly switched by the NMR spectrometer. This allows for continuous LED operation at stand- ard currents and for pulsed LED operation at much higher currents. By using the LEDs in con- tinuous operation the whole variety of NMR methods can be applied directly to photochemi- cal reactions and the use of LEDs provides direct comparability with conditions in synthetic chemistry. Pulsed operation of the LEDs allows for currents and light intensities well above the maximal currents of continuous operation. This makes time resolved Photo-CIDNP spectros- copy on a millisecond time scale possible even with this simple setup.
Switching the LED directly by the spectrometer makes a shutter that is commonly used to control the illumination redundant. Therefore the light emitting area of the LED can be brought in direct contact with the end of the optical fiber guiding the light from the LED into the NMR sample. This provides a remarkably easy, versatile and efficient coupling without the need of any further optical components.
To provide uniform and efficient illumination of the whole NMR sample along the measuring coils the tip of the optical fiber inserted in the sample was roughened by sand blasting which is an extraordinarily fast, simple and hazard-free preparation method.
0 1 2 3 4 5 6 7 8 9 10
Photo-CIDNPintensity(a.u.)
I (A)
1 A 3 A 5 A 7 A 9 A
a) b)
2.6 Additional Findings
2.6.1 Specification of the LEDs
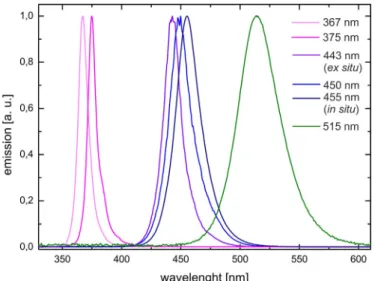
For the illumination setup described above a variety of different LEDs was tested, see Figure 2.6. The application of LEDs offered many advantages, as they are inexpensive, easy to handle in comparison to laser systems and commercially available in a broad spectrum of emission wavelength, ranging from ultraviolet to infrared. However, the application of UV LEDs is lim- ited, as the transmission of the optical fiber (Thorlabs BFH48-1000), between 99.9% and 99%
in the visible range, drastically decreases for wavelength below 400 nm. Thus, the shortest wavelength applied to this setup was 367 nm.
Figure 2.6 Emission spectra of the LEDs applied to the optical fiber. The intensities are normed.
The LEDs shown in Figure 2.6 are: 367 nm (Nichia SMD LED UV NCSU033B, 325 mW); 375 (Conrad P8D237, 230 mW) 443 nm (Osram Oson SSL 80, royal blue, 700 mA), 450 and 455 nm (Cree XP-E, royal blue, 700 mA); 515 nm (Luxeon K2 LXK2-PM14-U00, 130 lm, 100 mA). Additionally a white LED has been applied (Seoul Z-LED P4, 240 lm, spectrum not shown).
2.7 References
2.7 References
[1] M. B. Schmid, K. Zeitler, R. M. Gschwind, Angew. Chemie - Int. Ed. 2010, 49, 4997–
5003.
[2] A. Berkessel, S. Elfert, V.R. Yatham, J. M. Neudörfl, N. E. Schlörer, J. H. Teles, Angew.
Chemie - Int. Ed. 2012, 51, 12370–12374.
[3] B. Böttcher, V. Schmidts, J. A. Raskatov, C. M. Thiele, Angew. Chemie - Int. Ed. 2010, 49, 205–209.
[4] M. Fleischmann, D. Drettwan, E. Sugiono, M. Rueping, R. M. Gschwind, Angew.
Chemie - Int. Ed. 2011, 50, 6364–6369.
[5] G. E. Ball, in Spectrosc. Prop. Inorg. Organomet. Compd. Tech. Mater. Appl., The Roy- al Society of Chemistry, London, 2010, pp. 262–287.
[6] T. Kühn, H. Schwalbe, J. Am. Chem. Soc. 2000, 122, 6169–6174.
[7] J. Wirmer, T. Kühn, H. Schwalbe, Angew. Chemie - Int. Ed. 2001, 40, 4248–4251.
[8] H. R. Ward, R. G. Lawler, J. Am. Chem. Soc. 1967, 89, 5518–5519.
[9] J. Bargon, H. Fischer, Zeitschrift für Naturforsch. 1967, A22, 1556–1562.
[10] J. Bargon, H. Fischer, Zeitschrift für Naturforsch. 1967, A22, 1551–1555.
[11] P. J. Hore, Prog. NMR Spectrosc. 1993, 25, 345–402.
[12] M. Goez, in Annu. Reports NMR Spectrosc. Vol 66 (Ed.: G.A. Webb), Academic Press, 2009, pp. 77–147.
[13] I. Kuprov, P.J. Hore, J. Magn. Reson. 2004, 171, 171–175.
[14] J. E. Scheffler, C. E. Cottrell, L. J. Berliner, J. Magn. Reson. 1985, 63, 199–201.
[15] I. Kuprov, M. Goez, P. A. Abbott, P. J. Hore, Rev. Sci. Instrum. 2005, 76, 84103.
[16] J. W. Tucker, Y. Zhang, T. F. Jamison, C. R. J. Stephenson, Angew. Chemie - Int. Ed.
2012, 51, 4144–4147.
[17] M. Cherevatskaya, M. Neumann, S. Füldner, C. Harlander, S. Kümmel, S. Dankesreiter, A. Pfitzner, K. Zeitler, B. König, Angew. Chemie - Int. Ed. 2012, 51, 4062–4066.
[18] R. Lechner, S. Kümmel, B. König, Photochem. Photobiol. Sci. 2010, 9, 1367–1377.
[19] M. Neumann, S. Füldner, B. König, K. Zeitler, Angew. Chemie - Int. Ed. 2011, 50, 951–954.
[20] U. Megerle, R. Lechner, B. König, E. Riedle, Photochem. Photobiol. Sci. 2010, 9, 1400–1406.
[21] C. Willert, B. Stasicki, J. Klinner, S. Moessner, Meas. Sci. Technol. 2010, 21, 075402 (11pp).
[22] W. Hiller, H. M. Lent, G. E. A. Meier, B. Stasicki, Exp. Fluids 1987, 5, 141–144.
[23] U. Schmidhammer, S. Roth, E. Riedle, A. A. Tishkov, H. Mayr, Rev. Sci. Instrum. 2005, 76, 093111.
[24] H. Schmaderer, P. Hilgers, R. Lechner, B. König, Adv. Synth. Catal. 2009, 351, 163–
174.
[25] J. Svoboda, H. Schmaderer, B. König, Chem. - A Eur. J. 2008, 14, 1854–1865.
[26] U. Megerle, M. Wenninger, R.-J. Kutta, R. Lechner, B. König, B. Dick, E. Riedle, Phys.
Chem. Chem. Phys. 2011, 13, 8869–8880.
[27] D. P. Hari, P. Schroll, B. König, J. Am. Chem. Soc. 2012, 134, 2958–2961.
[28] D. P. Hari, B. König, Org. Lett. 2011, 13, 3852–3855.
[29] A. G. Condie, J. C. González-Gómez, C. R. J. Stephenson, J. Am. Chem. Soc. 2010, 132, 1464–1465.
[30] B. S. Lukyanov, M. B. Lukyanova, Chem. Heterocycl. Compd. 2005, 41, 281–311.
[31] J. Daďová, S. Kümmel, C. Feldmeier, J. Cibulková, R. Pažout, J. Maixner, R. M.
Gschwind, B. König, R. Cibulka, Chem. – A Eur. J. 2013, 19, 1066–1075.
[32] G. Richter, S. Weber, W. Römisch, A. Bacher, M. Fischer, W. Eisenreich, J. Am. Chem.
Soc. 2005, 127, 17245–17252.
Abstraction and Background Reactions
The study of the light-induced background reaction was in main parts performed by A. Eisen- hofer. The study of the photocatalyzed reaction was in main parts performed by H. Bartling.
Investigations on the dimer kinetic, the background reaction in the dark, the ESR and radical trapping experiments were planned and conducted with equal contributions.
A. Eisenhofer and H. Bartling contributed equally to this paper.
Hanna Bartling, Anna Eisenhofer, Burkhard König, Ruth M. Gschwind
submitted
3.1 Abstract
3.1 Abstract
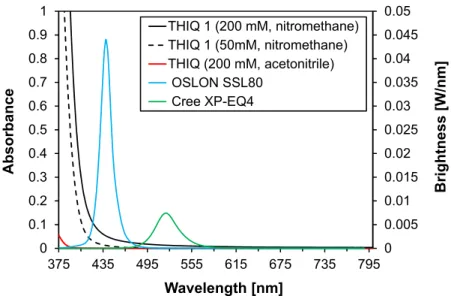
The cross-dehydrogenative coupling (CDC) reaction of N-aryltetrahydroisoquinolines (THIQ) is one of the most exploited photocatalytic transformation and a test reaction for an exceptional variety of catalysts. However, its mechanism remained unclear concerning involved intermedi- ates, reactive pathways of the amine radical cation and the influence of oxygen and the light source. Therefore, NMR-, ESR- and synthetic methods were combined to provide a compre- hensive picture of the reaction mechanism using Ru(bpy)3Cl2 as a photocatalyst under aerobic and anaerobic conditions. The reaction profiles and involved intermediates were monitored and analyzed by NMR spectroscopy. Several intermediates contributing to product formation were identified, the iminium ion, the hydroperoxide and dimer of THIQ, and a new ring opened intermediate, cleaved at the benzylic C-N bond. Mechanistic evidence is given that under anaerobic conditions preferentially the α-amino radical is formed by deprotonation, in contrast to the formation of iminium ions via H•-abstraction in the presence of oxygen. Fur- ther, the light-induced background reaction in the absence of the catalyst was studied in de- tail, revealing that the product formation rate is correlated to the intensity and wavelength of the light source and that oxygen is essential for an efficient conversion. The reaction rate and efficiency is comparable to previously reported photocatalytic systems, performed under aer- obic conditions in combination with intense blue light sources. Thus, the multitude of reaction parameters investigated reveals the preference for hydrogen atom or proton abstraction in photoreactions and allows to assess the influence of experimental conditions on the mecha- nistic pathways.
3.1 Abstract
3.2 Introduction
The direct and efficient transformation of C-H groups into C-C bonds under mild reaction conditions is of high interest in organic synthesis.[1–3] In the last decade, visible-light photore- dox catalysis developed into a powerful method for the activation of C-H bonds under mild conditions.[4–16]In this context, the visible light photocatalytic C-H functionalization of tertiary amines adjacent to nitrogen atoms became a valuable extension of transition-metal- catalyzed,[17] electrochemical[18–20] and DDQ-mediated reactions,[21–24] and for UV-light-induced photochemical approaches.[25–27] Since in 2010 Stephenson et al.[28] published an efficient con- cept for the visible-light mediated photocatalytic aza-Henry reaction of nitromethane with N- aryl-tetrahydroisoquinolines (THIQ) using air as terminal oxidant several synthetic applications emerged. [7,11,15,16] The aza-Henry reaction of THIQ represents one of the most exploited pho- tocatalytic transformations and an exceptional variety of visible-light absorbing photocatalysts has been applied for the CDC of the THIQ substrate with nitromethane: metal complexes con- taining ruthenium,[29,30] iridium,[28,31] palladium,[32] platinum,[33] cobalt[34] or copper,[35] organic dyes,[36–43] and heterogeneous photocatalysts like TiO2,[44] Cu2O,[45] CdS,[46] or mpg-C3N4,[47]
metal-organic frameworks,[48,49] or cross-linked polymers.[50–54]
Despite the plethora of different catalytic systems, a mechanistic overlap exists in the initial electron transfer step from the lone pair of the amine substrate to the photoexcited catalyst generating an amine radical cation.[55] Mechanistic evidence was given by early studies of Whitten et al. by luminescence quenching of the frequently used photocatalyst Ru(bpy)3Cl2
(tris(bipyridine) ruthenium(II)chloride hexahydrate)with triethylamine.[56,57] Recent spectroscop- ic investigations confirmed a reductive quenching of the photoexcited state of the respective catalyst by THIQ substrates for a series of catalytic systems described above.[28,37,38,58,59] In addi- tion, Wu et al. could prove the existence of the THIQ 1+• by transient absorption spectroscopy in combination with the spectroelectrochemical absorption spectrum of THIQ 1+•.[58,60]
The amine radical cation provides unique properties for the α-C-H functionalization. Com- pared with the neutral amine the bond dissociation energy and the pKa value[61] are reduced significantly, which opens different mechanistic pathways dependent on the reaction condi- tions (Scheme 3.1).[11,15]
Oxidative coupling reactions of tertiary amines are generally supposed to proceed via the elec- trophilic iminium ion, which is formed from the amino radical cation and can be intercepted by nucleophiles. The intermediacy of iminium ions was confirmed for transition-metal[62] and DDQ-catalyzed reactions,[22] as well as for photocatalyzed systems using BrCCl3 as terminal oxidant.[29,63]
However, for the photocatalytic aza-Henry reaction mechanistic evidence is missing, if the iminium ion is directly formed via hydrogen atom abstraction from the amine radical cation or by deprotonation generating the α-amino radical followed by a subsequent electron transfer.
Investigations of the influence of the terminal oxidant on those reaction pathways are lacking.
Furthermore, the question remains, whether the iminium species 2 is the only intermediate, which contributes to the product formation or if other mechanistic pathways are operating. In some cases intermediates have been observed, but their role within the catalytic cycle re- mained unclear.[37,41] The existence of the α-amino radical of THIQ 7 was proven by Xiao and
3.2 Introduction
Lu for the α-allylation of amines in a dual catalytic approach, by ESR spectroscopy.[64] Whitten et al. detected the respective α-amino radical of triethylamine with a spin trap by ESR spec- troscopy.[57]
Scheme 3.1 Activation of tertiary amines by photoredox catalysis and amine radical cation modes of reactivity. Values for the bond dissociation energy (BDE) and oxidation potentials (vs. SCE) are given for triethylamine (R1=-CH3, R2=R3= -CH2-CH3). (SET = single electron transfer, BET = back electron transfer)[11,15,56,57,65–69]
The question of reactive key intermediates and the active pathways remains also a topic of debate for the related transition-metal catalyzed reaction. Previous studies of Murahashi, Li, Che, Klussmann and Doyle led to divergent mechanistic models.[70] Mechanistic studies of Klussmann et al. demonstrated that varying the oxidant/catalyst pair from CuCl2·2H2O/O2 to CuBr/tert-butyl hydroperoxide (TBHP) in the oxidative coupling of THIQ 1 lead to major changes in the catalytic cycle (Scheme 3.2).[71–73] For CuCl2·2H2O/O2 the iminium ion 2a was found as the key intermediate, which originate from a direct oxidation of THIQ 1 by the Cu- catalyst. The role of oxygen was limited to the reoxidation of the catalyst. The solvent metha- nol stabilized the iminium ion 2a by formation of stable reservoirs in an off-cycle equilibrium,[74] which provides the active iminium species 2a in a controlled fashion. The roles of the oxidant and the catalyst change for the CuBr/TBHP system. CuBr converts TBHP in a Kharasch type reaction to the tert-butyl peroxy radical and the respective tert-butyloxy radical, which activates THIQ 1 by a hydrogen atom transfer (HAT). Radical recombination formed the THIQ peroxy species 8 as a true intermediate, which is converted to the iminium ion 2b as- sisted by CuBr acting as a Lewis acid.
In light of transition metal-catalyzed studies the question arises, if in the photocatalyzed sys- tem similar off-cycle equilibria are operative and to what extent the terminal oxidant influ-
ences the mechanism. Notwithstanding the variety of elaborated spectroscopic and mechanis- tic studies, that have been performed under different conditions – all dealing with photocata- lyzed CDC reactions of N-arylamines and with the aza-Henry reaction in particular – to the best of our knowledge no comprehensive study regarding the pathways of the amine radical cation and involved intermediate species with respect to the terminal oxidant of the photo- catalyzed reaction of THIQ 1 with nitromethane 5a has been reported so far.
Scheme 3.2 Mechanistic proposals of Klussmann et al. for the Cu-catalyzed oxidative coupling of THIQ 1 using oxygen or tert-butyl hydroperoxide (TBHP) as oxidant.[71–73]
In light of transition metal-catalyzed studies the question arises, if in the photocatalyzed sys- tem similar off-cycle equilibria are operative and to what extent the terminal oxidant influ- ences the mechanism. Notwithstanding the variety of elaborated spectroscopic and mechanis- tic studies, that have been performed under different conditions – all dealing with photocata- lyzed CDC reactions of N-arylamines and with the aza-Henry reaction in particular – to the best of our knowledge no comprehensive study regarding the pathways of the amine radical cation and involved intermediate species with respect to the terminal oxidant of the photo- catalyzed reaction of THIQ 1 with nitromethane 5a has been reported so far.
Herein, we present our mechanistic study of the CDC reaction of THIQ with nitromethane investigating the reaction profiles, (elusive) intermediates and the necessity of the photocata- lyst, together with the role of oxygen and light in different reaction setups by NMR and ESR spectroscopy. Furthermore, the role of the reaction intermediates within the catalytic cycle is discussed and background reactions are investigated. Based on our results we divided the reaction into different pathways, which are presented in detail.
3.3 Results and Discussion
3.3 Results and Discussion
In order to elucidate the reactive pathway (H•- vs. H+-abstraction) of the photocatalytically generated amine radical cation and the involved intermediates dependent on the reaction conditions, we systematically studied different reaction parameters. The aza-Henry reaction stands out from the photocatalyzed CDC reactions as the nucleophile nitromethane itself is feasible of regenerating the catalyst and can act as a terminal oxidant albeit with a reduced reaction rate compared to oxygen. Thus, no external terminal oxidant is required (Scheme 3.1).[28,37,41] This enabled us to investigate the role of oxygen separately with respect to H•- vs.
H+- abstraction pathways. First, the influence of the terminal oxidant – in particular the pres- ence or absence of oxygen – on the catalytic cycle and the correlation to involved intermedi- ate species and the reaction profiles were investigated by NMR spectroscopy.
3.3.1 Setup
The control of the oxygen concentration was accomplished by a variation of the reaction set- ups, which are depicted schematically in Figure 3.1 and are referred to as in situ and ex situ.
Almost anaerobic conditions were achieved with the in situ technique developed by Feldmeier et al.,[75] which allows the illumination of the sample with an LED inside the spectrometer. This setup provides a unique possibility monitoring reaction profiles as well as the detection and characterization of elusive intermediates and products of photochemical reactions. However, due to the conditions of the setup (closed system, no boundary layer to air, only diffusion) the corresponding aerobic sample cannot be monitored with this technique. Therefore, the aero- bic sample was irradiated open to air outside of the spectrometer (ex situ strategy). While the reaction proceeded, aliquot samples were taken and the reaction profile was monitored by NMR spectroscopy.
3.3.2 Aerobic and Anaerobic Reaction Profiles
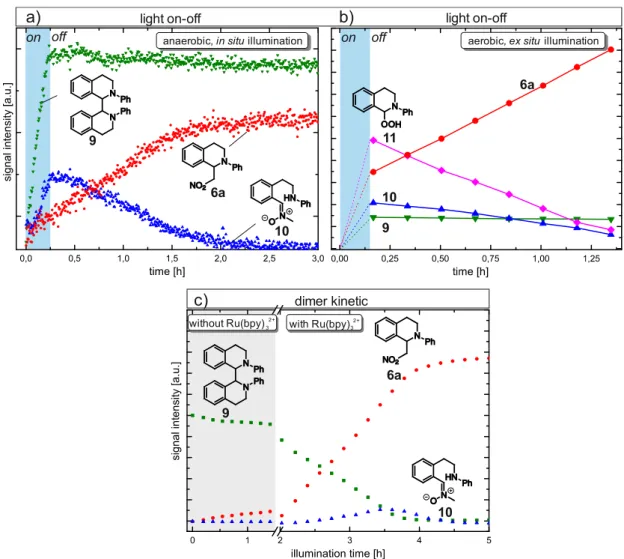
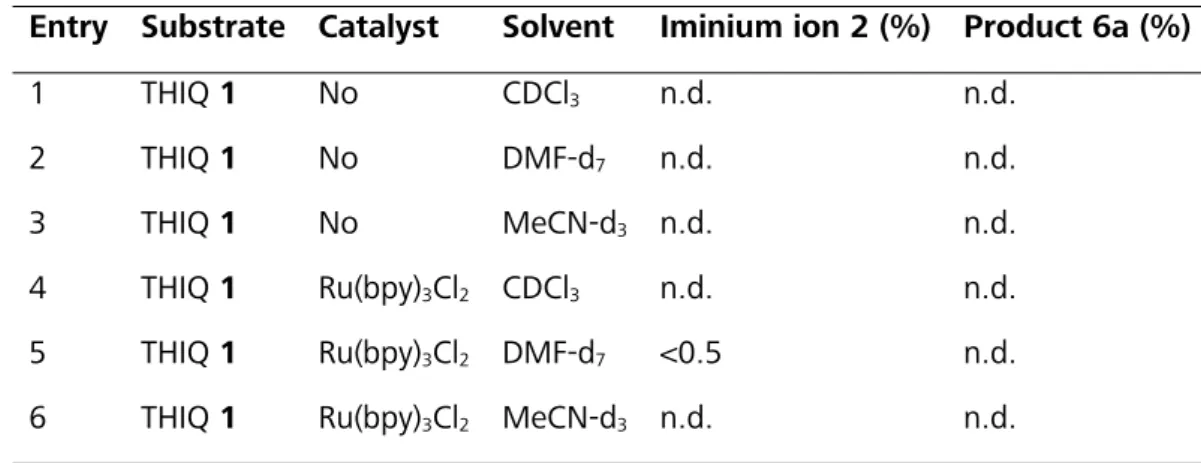
For both kinetics, THIQ 1 (200 mM) and 1 mol% of Ru(bpy)3Cl2 in deuterated nitromethane- d3 5a were irradiated with blue LEDs (for specification see section 3.5.3) at room temperature (Figure 3.1 a,b). The nucleophile nitromethane was used as solvent. The in situ experiment was repeated with 50 mM THIQ 1 and an increased catalyst loading of 10 mol% of Ru(bpy)3Cl2 (Figure 3.1 c). The intermediates THIQ dimer 9 and THIQ nitrone 10 showed the same profiles and relative intermediate ratios, but with 10 mol% of Ru(bpy)3Cl2 a reduced reaction time and an increased absolute amount of intermediates was observed (Figure 3.1 b,c). To facilitate the assignment and to reduce measurement time the following in situ experiments were conducted at these conditions.
Under anaerobic conditions (in situ), two main intermediates were observed, the dimerization product 9 of the THIQ substrate and a ring opened THIQ-nitrone 10 cleaved at the benzylic C- N bond (for NMR data and assignment see 3.5.6.6). The dimer 9 and the ring opened inter- mediate 10 could also be observed as intermediates for the aerobic sample, but the main intermediate constitutes the THIQ hydroperoxide 11, reaching a maximum of 20%. All de- tected THIQ species showed maxima in their reaction profile under photocatalytic conditions, indicating their role as intermediate or as off-cycle resting state in the reaction mechanism.
Figure 3.1 Reaction conditions, setups and 1H NMR kinetics of the photocatalytic coupling reaction of THIQ 1 and nitromethane-d3 5a shown for aerobic ex situ (a) and anaerobic in situ illumination with 1 mol% (b) and 10 mol% (c) catalyst loading.
on off
10 6a 1
9 Ru(bpy) Cl (1mol%)3 2
1
h , r.t.,air,NO Mev 2 5a 1
1
9 10
6a
11
Ru(bpy) Cl (3 2 1mol%)
1
h , r.t.,NO Me v 2 5a 1
Ru(bpy) Cl (3 210mol%)
1
h , r.t.,NO Me v 2 5a
1 1
6a
10 9
10 9
6a
a) aerobic, ex situ illumination
b) anaerobic, in situ illumination
c) anaerobic, in situ illumination
+23°C -
3.3 Results and Discussion
The 1H reaction profiles of the dimer 9 and ring opened intermediate 10 of the ex situ illumi- nated reaction basically follow the same pattern as the reaction under in situ conditions.
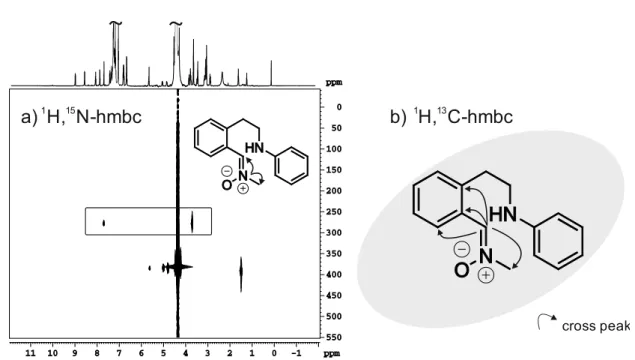
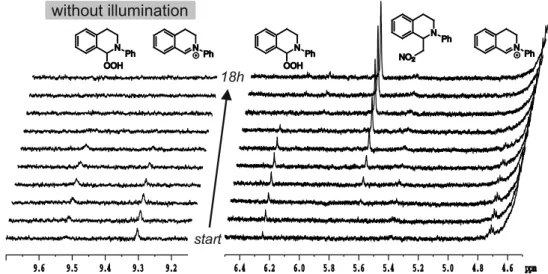
In the initial minutes of the ex situ and in situ reaction THIQ iminium ion 2[76] was detected. In addition, traces of THIQ-OOH 11 were observed in the in situ 1H NMR reaction profile due to residual oxygen. However, these species are not depicted in Figure 3.1 a-3.1 c because of concentrations below 2% and fast decrease within 30 minutes. For NMR spectra under in situ conditions showing all detected THIQ species, please refer to Figure 3.3 and Figure 3.13.
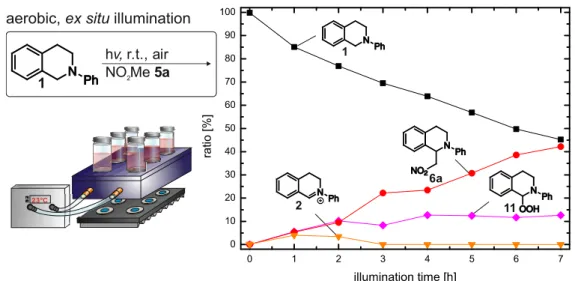
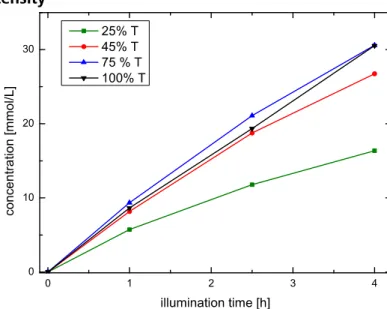
The aerobic reaction proceeds significantly faster, which is in agreement with literature re- ports.[28,37,41] After 3 h, 90% of product 6a were obtained compared to 18 h of reaction time in the in situ system. This indicates that oxygen plays an important role in the reaction pro- cess, either by accelerating the efficiency of the catalyst turnover or by involvement in follow up reactions of the amine radical cation or by a combination of both.
THIQ starting material 1 decreased exponentially under aerobic and anaerobic conditions.
While the product curve showed a linear increase for the aerobic (ex situ) experiment (for additional proof refer to Figure 3.16), a sigmoidal shape was obtained for the in situ meas- urement. The latter indicates the product formation from (transient) species, which are accu- mulated during the reaction. A possible explanation for this sigmoidal reaction progression would be the nitromethane nucleophile requiring activation to a tautomeric, but thermody- namically unfavorable aci-form for the nucleophilic attack.[77–81] Klussmann et al. reported increasing pH values with reaction progress.[72] Higher pH values result in an increased for- mation of the reactive deprotonated aci-form of nitromethane and finally lead to an increased product formation rate. This would be in good accordance with the observed sigmoidal curve of product formation. However, if the delayed product formation can exclusively be ascribed to the activation of nitromethane the aerobic and the dimer 9 kinetic (see Figure 3.2 c and text below) should also exhibit a sigmoidal shape. As for both of them a linear product for- mation rate was observed, we explain the disparity of the curves by different underlying reac- tion mechanisms.
3.3.3 Intermediate Formation Mechanisms 3.3.3.1 THIQ Dimer 9
The intermediate providing the first maximum during the course of the reaction is the dimerization product 9 of THIQ, which is commonly accepted to occur via a radical pathway by homocoupling of two amine radicals 7.[82,83] König et al. developed a method for the radical homocoupling of THIQ on polycrystalline CdS.[46] The formation of the THIQ dimer 9 gives evidence, that the deprotonation pathway proceeds under aerobic and anaerobic conditions (see Scheme 3.1). This is remarkable as amino radicals are very strong reducing agent and are thus prone to oxidation. Even molecular oxygen (Ered(O2/O2∙-) = -0.75 V vs.
SCE)[68] is able to oxidize α-amino radicals (Eox(Et2N-∙CHCH3/ Et2N+=CHCH3) = -1.12 V vs. SCE) thermodynamically.[66] Therefore, synthetic applications of the α-amino radical are conducted under inert atmosphere conditions e.g. the addition to electron-deficient alkenes.[82–84]
However, Jiang and coworkers recently published a radical cascade reaction between the α-
amino radical of THIQ 7 and N-itaconimides under aerobic conditions, which is in line with our observations.[85–88]
3.3.3.2 THIQ-OOH 11
The elucidation of the mechanistic pathway for the formation of THIQ-OOH 11 is more chal- lenging. The intermediate species THIQ-OOH 11 was anticipated by Wu et al., but no full characterization was provided.[37] The formation of the THIQ hydroperoxide species 11 re- quires an incorporation of oxygen. Based on the amine radical cation of THIQ 1+• different mechanistic pathways are possible (see Scheme 3.3). As discussed above, the amine radical cation can undergo hydrogen atom abstraction or deprotonation. Superoxide radical anion O2•–, which is formed after regeneration of the photocatalyst, can initiate both pathways as O2•– is reported in literature as H•- and H+-acceptor.[68,89–98] The intermediate superoxide radical anion was confirmed by ESR spectroscopy after trapping with the radical probe DMPO (see section 3.5.11). The attributed role of the superoxide radical anion varies also within the sug- gested mechanism reported for the aza-Henry reaction.[28,37,99,100] The product of the H•- abstraction pathway is the iminium ion 2, which can be intercepted by the generated OOH– to form THIQ-OOH 11. The hydroperoxide is in a pH-dependent equilibrium with the iminium species 2, which was shown by Klussmann et al. for the THIQ-iminium 2b/THIQ-tert-butyl hydroperoxide 8 couple (Scheme 3.2).[72] Nevertheless, also the amino radical 7, formed via the deprotonation pathway, could deliver the respective amino peroxide 11 by a radical cou- pling with •OOH.[101] Furthermore, it is known that α-amino radicals 7 can react very fast with atmospheric molecular oxygen in an autoxidation type mechanism (see Scheme 3.3 and Scheme 3.9).[73,102–105] The formed oxygen centered peroxyl radical adduct 12 can provide the THIQ-OOH 11 in a chain propagation step together with another amino radical 7.
Scheme 3.3 Possible pathways for the formation of THIQ hydroperoxide 11.
To probe if THIQ-OOH 11 is formed via the iminium 2 (H•-abstraction pathway) or the amino radical 7 (deprotonation pathway) the reaction profiles were investigated in the presence of the radical inhibitor TEMPO.
3.3 Results and Discussion
The addition of TEMPO slowed down the aerobic reaction (for details see 3.5.12). However, due to extensive line broadening – indicating the presence of radical species – no reliable re- action yields could be achieved. The reaction profiles elucidate that the formation of the di- mer 9 and the nitrone 10 are completely suppressed, whereas the THIQ-OOH 11 could be observed throughout the kinetic, increasing within the first hour of the reaction (for details see Figure 3.27). This specific suppression of two intermediates strongly indicates that both the dimer 9 and the open intermediate 10 are formed via a radical pathway. The formation of THIQ-OOH intermediate 11 in the presence of TEMPO also corroborates the existence of an additional productive reaction pathway, not occurring via the amino radical 7. Based on these results we propose that the superoxide radical anion acts preferentially as a hydrogen atom acceptor leading to iminium ion 2c. This hydrogen abstraction pathway was later supported by the detection of both iminium ion 2 and THIQ-OOH 11 in the photocatalyst free studies (see Effective Background Reaction with Light and Figure 3.5). We further suggest that THIQ hydroperoxide 11 is formed in an off-cycle equilibrium from the iminium ion 2c (Scheme 3.3, bold line).
3.3.3.3 Ring opened Intermediate 10
The intermediate 10 is detected for the first time and only one previous publication anticipat- ed a C-N cleavage within the route to product formation.[69] The mechanistic evidence for radical species involved in the formation of the ring opened intermediate 10 under aerobic conditions (see above) was corroborated by the addition of TEMPO under anaerobic condi- tions. Again, the reaction was slowed down and the formation of the dimer 9 and the open intermediate 10 were completely suppressed. Based on this observation in conjunction with the product structure determined by NMR (see 3.5.6.6) we propose a radical coupling be- tween the α-amino radical 7 and a hydroxylamine radical 13 (Scheme 3.4). The formation of the hydroxylamine radical 13 is reported for a stepwise reduction of nitromethane by metal catalysts[106], electrochemically[107] or via dissociation or disproportionation of nitromethane.[108]
Here, the electrons come from the reoxidation of the photocatalyst (see Scheme 3.1 a). The initial strong formation of dimer 9 (see Figure 3.1 c) supports this mechanistic proposal, since three electrons are required for the formation of one hydroxylamine radical 13. Furthermore, we assume that the ring opened intermediate 10 is in a pH-dependent equilibrium with the reactive iminium species 2 and thus constitutes a true, productive intermediate (Scheme 3.5).
This assumption is supported by a formation of N-methylhydroxylamine 14, which was de- tected in the NMR spectra with progressing reaction (Scheme 3.5 and section 3.5.6.7).[109]
Scheme 3.4 Proposed radical mechanism for the formation of the ring opened intermediate 10.