www.SustainableValue.com
Sustainable Value Creation
by Chemical Companies
Authors
Andrea Liesen Frank Müller Frank Figge Tobias Hahn
The authors work as researchers for the following institutions:
Queen’s University Management School
IZT – Institute for Futures Studies and Technology Assessment
Schopenhauerstr. 26 14129 Berlin
Germany
Queen's University Belfast Queen's University
Management School 25 University Square Belfast BT7 1NN Northern Ireland, UK
Euromed Management School
Domaine de Luminy - BP 921
13 288 Marseille cedex 9 France
Contact: chemical@sustainablevalue.com
This study is published by Sustainable Value Research Ltd. Belfast.
© Belfast 2009. All rights reserved. Dissemination of this document is free as long as full reference to the authors is made.
Title art work: © iStockphoto.com/ Paul IJsendoorn
1 Table of Contents
Table of Contents... 1
List of Figures and Tables ... 3
Foreword ... 4
Executive Summary ... 5
1 Introduction ... 7
2 Method for Calculating Sustainable Value... 8
2.1 The Sustainable Value Approach in Brief ... 8
2.2 The Valuation Logic of Sustainable Value ... 9
2.3 Calculating Sustainable Value ... 10
2.4 Making Allowances for Company Size: Return to Cost Ratio ... 13
2.5 Explanatory Power of Sustainable Value ... 14
2.6 Sustainable Value and Resource Use ... 15
3 Scope of the Study... 18
3.1 Companies Studied ... 18
3.2 Indicators Assessed ... 18
3.3 Review Period ... 21
3.4 Data Sources and Data Collection ... 22
3.5 Data Coverage, Treatment of Missing Data and Data Problems ... 22
3.5.1 Data Coverage ... 23
3.5.2 Treatment of Missing Data ... 23
3.5.3 Different Scopes of Data ... 23
3.5.4 Calculating and Estimating Performance Data ... 24
3.5.5 Dealing with Data Corrections ... 24
4 Results: Overview ... 25
4.1 Sustainable Value ... 25
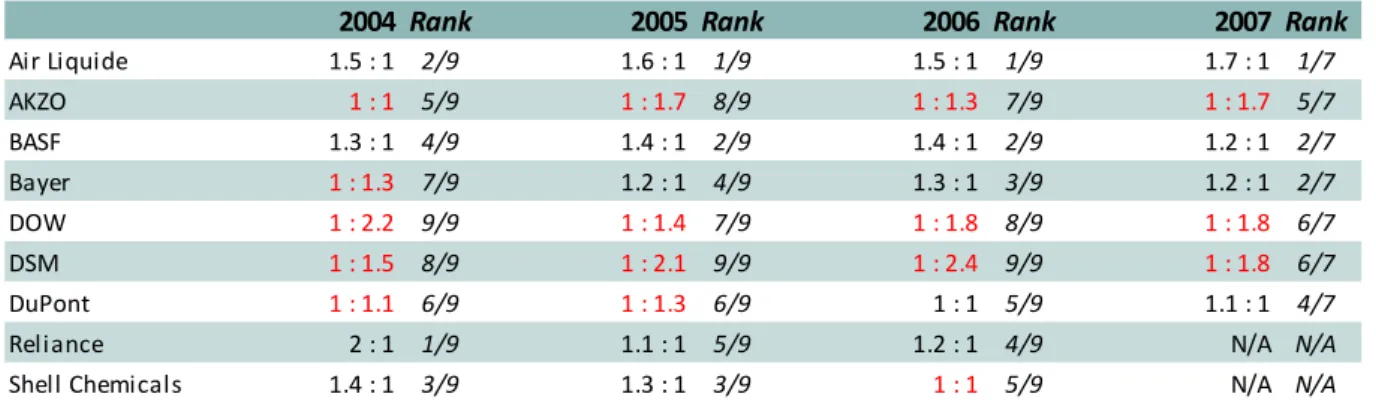
4.2 Return to Cost Ratio ... 26
5 Results per Company ... 29
5.1 BASF ... 29
In-depth analysis of performance trends: Effect Analysis ... 31
5.2 Air Liquide ... 35
Table of Contents
2
5.3 AKZO ... 38
5.4 Bayer ... 40
5.5 DOW ... 42
5.6 DSM ... 44
5.7 DuPont ... 45
5.8 Reliance ... 47
5.9 Shell Chemicals ... 50
6 Conclusions and Outlook ... 52
References ... 55
Annex I: Notes on Data of the Companies under Analysis ... 57
3 List of Figures and Tables
Figure 1: Value-oriented analysis of resource use ... 8
Figure 2: Calculation of the Value Contribution of BASF’s GHG-emissions in 2007 ... 12
Figure 3: Sustainable Value of BASF in 2007 ... 13
Figure 4: Calculation of the Return to Cost Ratio of BASF in 2007 ... 14
Figure 5: Sustainable Value and resource use ... 16
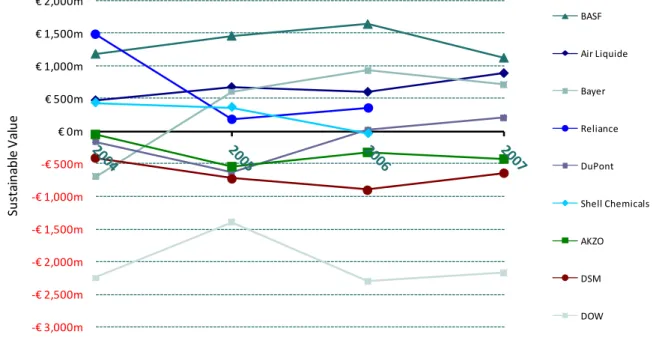
Figure 6: Absolute Sustainable Value of chemical companies ... 26
Figure 7: Return to Cost Ratio of chemical companies ... 28
Figure 8: Development of GHG-RCR of BASF 2004 vs. 2007 ... 32
Figure 9: Development of VOC-RCR of BASF 2004 vs. 2007 ... 33
Figure 10: Development of energy-use-RCR of BASF 2004 vs. 2007 ... 34
Figure 11: Development of COD-RCR of BASF 2004 vs. 2007 ... 35
Table 1: Economic, environmental and social indicators examined in the study ... 18
Table 2: Data coverage ... 23
Table 3: Absolute Sustainable Value and ranking of companies ... 25
Table 4: Return to Cost Ratio and ranking of companies ... 27
Table 5: Value Contributions and Sustainable Value of BASF ... 29
Table 6: Return to Cost Ratios of BASF ... 30
Table 7: Value Contributions and Sustainable Value of Air Liquide ... 36
Table 8: Return to Cost Ratios of Air Liquide ... 37
Table 9: Value Contributions and Sustainable Value of AKZO ... 38
Table 10: Return to Cost Ratios of AKZO ... 39
Table 11: Value Contributions and Sustainable Value of Bayer ... 40
Table 12: Return to Cost Ratios of Bayer ... 41
Table 13: Value Contributions and Sustainable Value of DOW ... 42
Table 14: Return to Cost Ratios of DOW ... 43
Table 15: Value Contributions and Sustainable Value of DSM ... 44
Table 16: Return to Cost Ratios of DSM ... 45
Table 17: Value Contributions and Sustainable Value of DuPont ... 46
Table 18: Return to Cost Ratios of DuPont ... 47
Table 19: Value Contributions and Sustainable Value of Reliance ... 48
Table 20: Return to Cost Ratios of Reliance ... 49
Table 21: Value Contributions and Sustainable Value of Shell Chemicals ... 50
Table 22: Return to Cost Ratios of Shell Chemicals ... 51
Foreword
4 Foreword
Purpose and scope of this study
This study assesses the sustainability performance of nine chemical companies using the Sustainable Value approach. The Sustainable Value approach extends the concept of oppor- tunity costs that is well established on financial markets to include environmental and social aspects. This allows for the fact that companies not only require economic capital for their business activities, but also environmental and social resources. To create positive Sustain- able Value, a company must use its economic, environmental and social resources more efficiently than its market peers. This study therefore combines the concept of sustainability with the valuation methodology applied to investment and financial market decisions.
Purpose of this study is to demonstrate how efficiently various chemical companies used 13 different economic, environmental and social resources compared to their industry peers in the years 2004 to 2007. Although in theory the Sustainable Value approach could be exten- ded to the entire life-cycle of chemical products, due to the lack of suitable environmental and social performance data this study analyses the use of different resources within the production process of the respective chemical companies. The study therefore follows the model of the financial markets that concentrate their performance assessment on the use of economic capital by the company rather than by the entire life-cycle.
Funding from BASF SE
BASF SE has kindly provided financial support for this study. At the same time it must be stressed that the researchers at the Institute for Futures Studies and Technology Assessment, Queen’s University Management School, Euromed Management and Sustain- able Value Research Ltd. take full and sole responsibility for this study and its conclusions. At no time has BASF SE had any influence on the content or findings of this publication.
5 Executive Summary
This study reports the findings of a research project that analysed the sustainability perfor- mance of nine chemical companies using the Sustainable Value approach. The research was conducted by researchers working at IZT – Institute for Futures Studies and Technology Assessment in Berlin, Queen’s University Management School in Belfast, Euromed Manage- ment in Marseille and Sustainable Value Research Ltd.
The Sustainable Value approach is the first method that assesses corporate sustainability performance based on the value created with the resources used. By extending a traditional valuation method applied in financial analysis, it assesses not just the use of economic capi- tal, but also environmental and social resources. A chemical company thus creates positive (or negative) Sustainable Value if it earns a higher (or lower) return than its peers with the economic, environmental and social resources used. An analysis based on the Sustainable Value approach therefore establishes whether a company is successfully using its resources to create value in comparison to its industry peers. In doing so, the Sustainable Value approach measures corporate sustainability performance in monetary terms. It establishes a link between sustainability and the value-based approach that is traditionally used in ma- nagement practice and financial analysis.
This study assess the sustainability performance of Air Liquide S.A. (Air Liquide), Akzo Nobel N.V. (AKZO), BASF SE (BASF), Bayer AG (Bayer), The Dow Chemical Company (DOW), Konink- lijke DSM N.V (DSM), E. I. du Pont de Nemours and Company (DuPont), Reliance Industries Limited (Reliance) and Shell Chemicals (Shell Chemicals) over a four-year period, i.e. from 2004 to 2007. The use of 13 different economic, environmental and social resources, based on the financial, environmental and social data reported and published by the companies themselves, is evaluated. Two assessments were carried out in the process of this research:
The first assessment focuses on the creation of absolute Sustainable Value. A chemical company creates positive or negative Sustainable Value if it earns a higher (or lower) return than its industry peers with its economic, environmental and social resources. The second assessment takes into account company size and is a measure of the relative sustainability performance of companies. To compare companies of different size, the return of a compa- ny using a specific bundle of resources is compared to the return that the peer group would have generated with the exact same amount of resources.
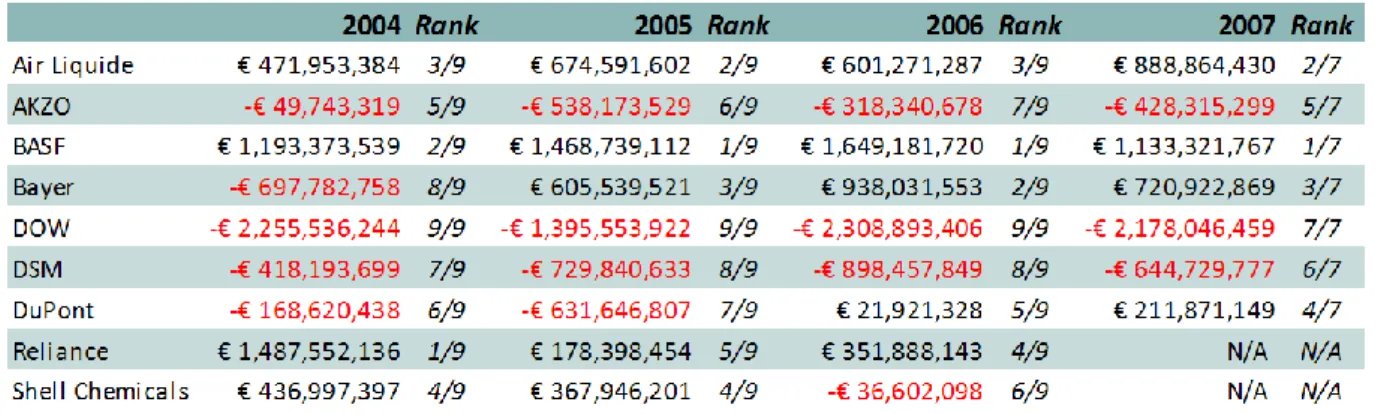
The results of the calculation of absolute Sustainable Value creation show considerable differences in sustainability performance between the companies assessed. Air Liquide and BASF not only create the highest Sustainable Value but also represent the only two compa- nies consistently creating positive Sustainable Value over the entire review period. That is, in each of the years assessed, Air Liquide and BASF created more cash flow with their econo- mic, social and environmental resources than their industry peers. Reliance also managed to consistently create a positive Sustainable Value for the years 2004 to 2006, however, no en- vironmental performance data for the year 2007 were available from Reliance on comple- tion of this study. The strongest positive performance trend among the companies assessed is shown by Bayer. While Bayer created a negative Sustainable Value in the first year asses-
Executive Summary
6
sed, in the following two years Bayer made significant efficiency improvements. DuPont also managed to improve its Sustainable Value performance. While destroying Sustainable Value in 2004 and 2005, the resource bundle considered in this study was used in a value creating way in 2006 and 2007. In contrast, the performance of Shell Chemicals shows a clear down- ward trend. Still creating positive Sustainable value in 2004 and 2005, Shell Chemicals’ re- source efficiency was clearly below the peer group average in 2006. AKZO’s sustainability performance assessed with the Sustainable Value approach ranges in the lower mid-field of its peer group and is subject to a fluctuant development. DOW is bringing up the rear in terms of absolute Sustainable Value creation. Just like DSM and AKZO, Dow Chemicals achieved no positive Sustainable Value during the entire review period.
The second assessment carried out in this research takes into account company size. In this assessment, Air Liquide ranks first among the companies assessed. In 2006, Air Liquide used its resources almost twice as efficiently as the peer group on average, i.e. Air Liquide created almost twice as much cash flow with its resources than the peer group on average would have generated with the same amount of resources. At the bottom of this ranking are DOW and DSM. Both companies are using their resources only nearly half as efficiently as the peer group on average.
This study provides a detailed description of the Sustainable Value approach, the methodo- logy used to analyse the sustainability performance of nine chemical companies, and the subsequent findings, including a ranking of these chemical companies. The study closes with a detailed discussion of the results of each of the companies investigated. While the differences in sustainability performance between the companies can be partially attributed to differences in their product portfolios as well as to financial and structural effects, the individual results also reflect the effects of good environmental and social management practices. It should be noted, however, that the Sustainable Value does not attempt to ex- press a company’s entire commitment to sustainability in a single ratio. Qualitative sustain- ability aspects should be managed with qualitative instruments. Rather, the Sustainable Value approach provides a link between sustainability and the value-oriented approach that is common in management practice. Taken as a whole, the results of this study provide a transparent and meaningful overview of sustainability performance trends among the che- mical companies assessed. The study also shows that the Sustainable Value approach is a practical tool for producing an in-depth and integrative assessment of corporate sustainabi- lity performance.
7 1 Introduction
Measuring corporate sustainability performance is a complex undertaking. This is not only due to the fact that economic, environmental and social information need to be considered simultaneously, but also due to problems concerning the quality and availability of the necessary data. Nevertheless, measuring corporate sustainability performance is extremely important: unless it can be measured, it cannot be managed. Traditional instruments are not capable of combining the environmental, social and economic parameters of sustainability and reporting them in a standardised form that is readily understood throughout an organi- sation.
The Sustainable Value approach was developed specifically to solve this problem (see for example Figge, 2001; Figge & Hahn, 2004a, 2005). Sustainable Value measures the efficient use of economic, environmental and social resources and expresses the result in a single integrated monetary figure. Sustainable Value measures the use of environmental and social resources exactly in the same way as companies currently assess the return on capital em- ployed: In the value-oriented approach to management, it is assumed that the use of capital creates value when it earns a higher return than if the capital had been employed else- where. The Sustainable Value approach therefore moves away from traditional logic based on impacts and instead treats environmental and social assets as scarce resources that have to be used in a value-creating way.
The Sustainable Value approach was developed by researchers who currently work at Queen’s University Belfast and Euromed Management School Marseille. It was subsequently tested in a series of research projects and case studies (Figge & Hahn, 2004b; Hahn, Figge, &
Barkemeyer, 2007, 2008; Hahn, Liesen, Figge, & Barkemeyer, 2007). This report represents the first comprehensive study of the chemical sector based on the Sustainable Value approach.
The remainder of this study is structured as follows: In the next chapter we present the logic of the Sustainable Value approach and explain how it was applied for the purposes of this study. The third chapter describes the scope of the assessment in this study. We then take a look at the aggregated results (chapter 4) and discuss the results on the individual company level in chapter five. In chapter six we present our conclusions.
2 Method for Calculating Sustainable Value
8 2 Method for Calculating Sustainable Value
2.1 The Sustainable Value Approach in Brief
Companies not only use economic capital but also environmental and social resources to create value. To determine a company’s sustainability performance, the entire bundle of different resources used must be taken into consideration. The Sustainable Value approach measures corporate sustainability performance in monetary terms. In this sense the approach is based on a fundamental principle of financial economics: companies create value whenever they use a resource more efficiently than their peers. In the financial mar- ket, this valuation methodology has long been practised under the banner of opportunity costs.
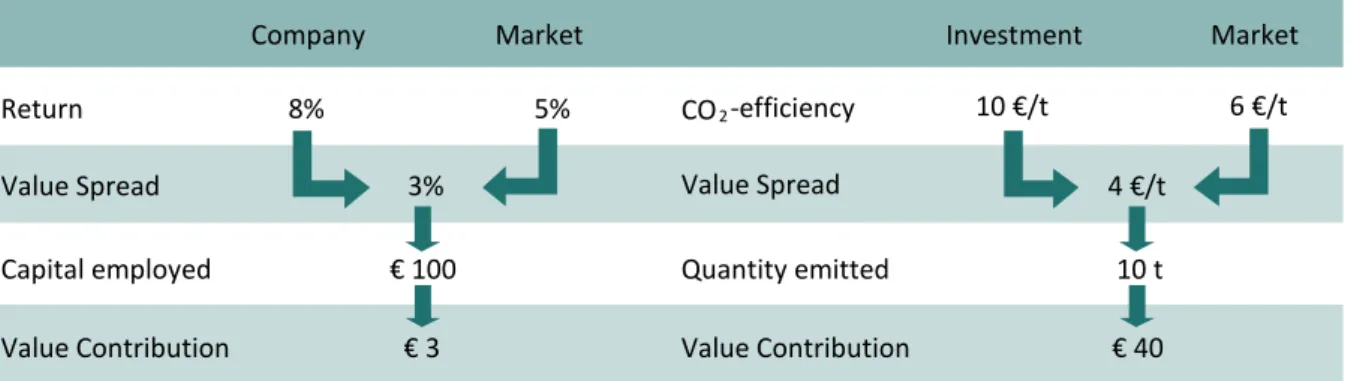
The example illustrated below (Figure 1) explains the underlying notion of opportunity costs.
Let’s assume an investment, such as a share, yields an annual return of 8%. To assess whether this was a good performance, we need to compare it with a benchmark – generally the market average. Assuming that the market (e.g. the shares represented by the DAX in- dex) has only produced an annual return of 5%, the investment has outperformed this index by 3%. This is also known as the value spread. To determine how much value has been gene- rated by the investment, this value spread simply needs to be multiplied by the capital em- ployed. Assuming an investment of € 100, the value spread comes to € 3 (see Figure 1).
Figure 1: Value-oriented analysis of resource use
The Sustainable Value approach extends this methodology, which is firmly established in financial markets and company valuation practices, to the use of environmental and social resources by companies. Sustainable Value is created whenever a company uses its eco- nomic, environmental and social resources more efficiently than the benchmark. To calcu- late Sustainable Value, a company’s resource efficiency is subsequently compared with that of the benchmark. A company which emits 10 t of CO2 in order to generate a return of € 100, has a CO2-efficiency of € 10 per ton of CO2. If the sector average for other companies is only
€ 6 return per ton of CO2, for example, the company earns € 4 more return per ton of CO2
than the benchmark (i.e. its industry peers). With a total emission of 10 tons of CO2, a company therefore generates € 40 value (see Figure 1).
Sustainable Value is the first approach to use the opportunity costs method to value the use of economic, environmental and social resources by a company. It is therefore an extension of the method generally used for performance assessments in financial markets, where ana-
Company Market Investment Market
Return 8% 5% CO 2 -efficiency 10 €/t 6 €/t
Value Spread 3% Value Spread 4 €/t
Capital employed € 100 Quantity emitted 10 t
Value Contribution € 3 Value Contribution € 40
9
lysis is limited to economic capital. At the same time the Sustainable Value approach is compatible with the decision-making and valuation tools used by investors and managers.
2.2 The Valuation Logic of Sustainable Value
From a sustainability perspective, the valuation of the company’s performance must not only take into consideration the use of economic resources, but also environmental and social resources. In this context, the following rule of thumb usually applies when assessing resource use: a resource should only be used if the return generated is higher than the costs incurred. The costs of resource use therefore need to be determined.
Unfortunately, this is not a straightforward task, whether it be for economic capital or for environmental and social resources. In traditional financial economics, this problem is re- solved for economic capital by using the opportunity costs approach (Bastiat, 1870; Green, 1894; Haney, 1912). Since their capital is limited, investors cannot exploit all the investment opportunities available to them at the same time. The earnings foregone from these investment alternatives are costs as far as the investor is concerned, and are referred to as opportunity costs. An investment is successful when the return of the actual investment ex- ceeds its opportunity costs. Opportunity costs therefore represent the cost of using econo- mic assets, such as capital.
As already mentioned, on financial markets it is generally assumed that an investment creates value whenever it is more profitable than the average rate of return available on the market. In practice in financial analysis, a stock index is commonly used as benchmark. In other words, an investment creates value whenever its return is higher than the stock index used as a benchmark. The success of investment funds is for example typically assessed like this. A fund that fails to beat the typical return of the market does not cover its cost of capital and therefore does not create, but rather destroys value.
As already emphasised, companies do not use economic capital alone, but also consume en- vironmental and social resources. The Sustainable Value approach therefore extends beyond the financial market’s one-dimensional focus on purely economic capital and also takes into account other resources when assessing company performance. At the same time, it adopts the tried and tested concept of opportunity costs. It is interesting to note that prior to the Sustainable Value approach, no other method had attempted to assess the use of environ- mental and social resources by applying the opportunity costs approach (Figge, 2001; Figge et al., 2004b, 2004a), even though this had first been suggested in principle more than 100 years ago (Green, 1894).
To determine the sustainability performance of companies, the costs of the economic, envi- ronmental and social resources used have to be deducted from the return earned by the company. This approach has already been followed for some time (Atkinson, 2000; Huizing &
Dekker, 1992). However, the costs have traditionally been determined using methods that focus primarily on burdens (Figge & Hahn, 2004c). The key assumption here is that the costs of a resource depend on the burden that arises through the use of the resource. Despite a plethora of different approaches, putting a monetary value on these burdens is still extreme-
2 Method for Calculating Sustainable Value
10
ly difficult (Carlsson Reich, 2005; Sonnemann, Schuhmacher, & Castells, 2000; Westman, 1977) and tends to produce not just inconsistent, but even conflicting results (Tol, 2005).
The Sustainable Value approach is the first value-based method for assessing corporate sustainability performance. This means that the costs of the use of resources are not deter- mined on the basis of the potential damage inflicted by these resources, but on the contri- bution they make to creating value. The costs of resources are determined using opportunity cost thinking: i.e. the return that could have been generated from an alternative use of these environmental and social resources. The Sustainable Value approach thus applies the oppor- tunity cost logic used in financial management to environmental and social resources. This value-oriented approach makes it far simpler to determine the costs of resource use.
2.3 Calculating Sustainable Value
Sustainable Value represents the value that a company creates through the use of a bundle of economic, environmental and social resources. Sustainable Value is calculated in five steps, described in detail in this section. It becomes clear that the assessment of corporate sustainability performance using the opportunity costs method is straightforward and does not involve complex mathematics.
The following five steps are necessary to calculate Sustainable Value. Each step provides the answer to a specific question that is relevant for the assessment of a company’s sustainabi- lity performance.
(1) How efficiently does a company use its resources?
In this step, the efficiency of the use of various resources in the company is calculated.
(2) How efficiently does the benchmark use the resources?
In this step the benchmark is established and the efficiency of its resource use is assessed.
(3) Does the company use its resources more efficiently than the benchmark?
In this step the resource efficiency of the company is compared with that of the benchmark.
(4) Which resources are used by the company in a value-creating way?
In this step the value contribution of the various resources is determined.
(5) How much Sustainable Value does a company create?
In the final step, the task is to assess whether the company used the given set of eco- nomic, environmental and social resources to create value.
These five steps are now explained using the example of the sustainability performance of BASF in 2007.
Step 1: How efficiently does a company use its resources?
The purpose of the first step is to establish how efficiently the company uses its various eco- nomic, environmental and social resources. To this end, the quantity of resources used is compared with the return generated by the company. First, we need to establish which
11
parameter to use for measuring the company’s profitability. To determine the sustainability performance of globally operating companies in the chemical sector, this study uses the net operating cash flow from ordinary business activities (in the following: “cash flow”). The calculation of resource efficiency is based on the cash flow generated by the company per unit of resource employed. To this end, the cash flow is divided by the quantity of resources used in each case.1 In 2007, BASF generated a cash flow of € 5.8 billion while emitting 28.8 million metric tons of greenhouse gas (GHG) emissions. Consequently, BASF showed a GHG- efficiency of € 202 cash flow per ton of GHG emitted. When calculating the company’s re- source efficiency, it has to be ensured that the data on resource use are based on the same scope of consolidation as the earnings figures.
Step 2: How efficiently does the benchmark use the resources?
The second step of the analysis calculates how efficiently the benchmark uses the relevant economic, environmental and social resources. First of all the benchmark has to be defined.
The benchmark for this study is constructed from the average cash flow produced per unit of resource of all companies assessed in this survey.2 Since figures on average industry efficien- cy are generally not published or reported, they have to be determined based on the data available from the reports and publications of the individual companies within the sector.
There are basically two ways to calculate peer group efficiency: on the one hand, it can be determined as an unweighted average. To this end, the mean value for the relevant resource efficiencies is determined for all the chemical companies studied. But this approach fails to take into consideration the difference between large companies, which consume far greater quantities of resources, and small companies. Alternatively, a weighted average can be cal- culated for peer group efficiency. To do this, the total cash flow generated by all companies studied is divided by the total amount of resources they have used. This approach takes into account the size differential between the companies, and is intended to replicate the peer group performance as accurately as possible. Bigger companies which also consume more resources therefore have a heavier weighting in the benchmark. This study on the Sustain- able Value of companies in the chemical sector uses the second approach, i.e. a weighted peer group average. The benchmark in this study is thus the weighted average resource effi- ciency of all the chemical companies assessed in this survey. Consequently, the average net operating cash flow that these companies earn per unit of resource used is calculated for all resources considered. For example, the GHG-efficiency of the peer group amounts to € 154 cash flow per t of GHG-emissions in 2007.
Step 3: Does the company use its resources more efficiently than the benchmark?
This step compares the efficiency of the company to the efficiency of the peer group (bench- mark). To this end, the peer group efficiency is deducted from the company efficiency. This results in the so-called value spread and describes how much more (or less) cash flow per unit of resource the company produces compared to the peer group. The value spread is cal- culated for each resource examined. This establishes whether the company uses the various
1 See 3.2 for details on the economic, environmental and social resources examined in this study.
2 See 3.1 for a list of companies examined in this study.
2 Method for Calculating Sustainable Value
12
resources more efficiently than the peer group. The concept of opportunity costs therefore plays a pivotal role here.
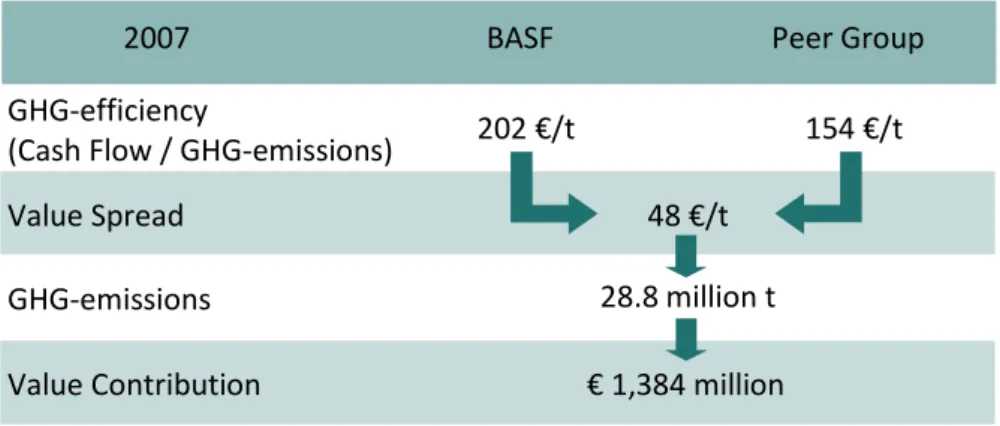
Figure 2: Calculation of the Value Contribution of BASF’s GHG-emissions in 2007
The comparison of the GHG-efficiency of BASF with the benchmark shows that BASF uses this resource more efficiently than the peer group on average. BASF has a positive value spread of roughly € 48 per t of GHG-emission. In other words, BASF generates € 48 more cash flow per ton GHG emitted than the peer group average (see Figure 2). In other words, BASF exceeds the opportunity costs of its GHG-emissions by € 48 per t.
Step 4: Which resources are used by the company in a value-creating way (and which are used in a value-destroying way)?
In this step the value contribution of the various resources consumed is determined. The value spread calculated in the previous step identifies how much more (or less) cash flow per unit of resource the company generates compared to the benchmark. In this fourth step, the value contribution generated by the total resource use within the company is calculated. To this end, the relevant quantity of resources used is multiplied by the respective value spread.
The result shows how much excess return the company creates with the quantity of re- source used compared to the benchmark. In 2007, for example, BASF emitted 28.8 million tons of GHG. Having calculated the value spread in step three, we know that BASF creates roughly € 48 more cash flow per t of GHG than the peer group on average. If we multiply the value spread with the total quantity of GHG emitted by BASF, the resulting value contribu- tion comes to approximately € 1.4 billion. This represents the value that is created due to that fact that BASF is emitting this quantity of GHG instead of other chemical companies (see Figure 2).
Step 5: How much Sustainable Value does a company create?
Companies do not use just one resource, but a bundle of different economic, environmental and social resources. In the previous step the value contribution of each resource was estab- lished. In this last step, we now determine how much value is being created in using the entire bundle of economic, environmental and social resources. In the previous steps, the company’s entire cash flow was attributed to the use of a single resource. Obviously, this does not reflect the real situation, since the return is only produced once, through the use of
2007 BASF Peer Group
GHG-efficiency
(Cash Flow / GHG-emissions) 154 €/t
Value Spread 48 €/t
GHG-emissions 28.8 million t
Value Contribution
202 €/t
€ 1,384 million
13
the entire resource bundle. If we were to simply add up the value contributions from the different resources, it would mean incorrectly counting a resource more than once. To be specific, if there were n resources the cash flow would be counted n times. When calculating the Sustainable Value, the sum of the value contributions is thus divided by the number of resources considered.
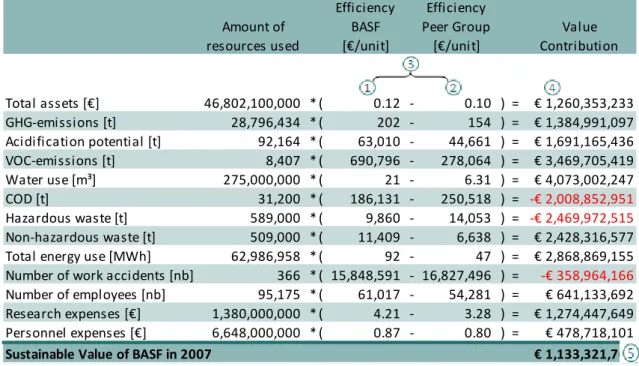
Figure 3 illustrates all five calculation steps. It also shows that BASF generated a Sustainable Value of roughly € 1.13 billion in 2007. The Sustainable Value expresses how much value has been created as a result of BASF using the resources in question in 2007, as opposed to other industry peers.
Amount of resources used
Efficiency BASF
*€/unit+
Efficiency Peer Group
*€/unit+
Value Contribution
Total assets *€+ 46,802,100,000 * ( 0.12 - 0.10 ) = € 1,260,353,233
GHG-emissions [t] 28,796,434 * ( 202 - 154 ) = € 1,384,991,097
Acidification potential [t] 92,164 * ( 63,010 - 44,661 ) = € 1,691,165,436 VOC-emissions [t] 8,407 * ( 690,796 - 278,064 ) = € 3,469,705,419
Water use [m³] 275,000,000 * ( 21 - 6.31 ) = € 4,073,002,247
COD [t] 31,200 * ( 186,131 - 250,518 ) = -€ 2,008,852,951
Hazardous waste [t] 589,000 * ( 9,860 - 14,053 ) = -€ 2,469,972,515 Non-hazardous waste [t] 509,000 * ( 11,409 - 6,638 ) = € 2,428,316,577 Total energy use [MWh] 62,986,958 * ( 92 - 47 ) = € 2,868,869,155 Number of work accidents [nb] 366 * ( 15,848,591 - 16,827,496 ) = -€ 358,964,166 Number of employees [nb] 95,175 * ( 61,017 - 54,281 ) = € 641,133,692 Research expenses *€+ 1,380,000,000 * ( 4.21 - 3.28 ) = € 1,274,447,649 Personnel expenses *€+ 6,648,000,000 * ( 0.87 - 0.80 ) = € 478,718,101
Sustainable Value of BASF in 2007 € 1,133,321,767
Figure 3: Sustainable Value of BASF in 2007
2.4 Making Allowances for Company Size: Return to Cost Ratio
In financial analysis, larger companies are generally expected to generate higher profits, sales and cash flows. This size effect complicates matters when attempting to compare the performance of different companies. Financial analysis therefore compares performance parameters, such as profit or cash flow, with other indicators that reflect the size of the com- pany. Profit, for example, is frequently assessed in relation to capital employed or sales.
Meaningful analyses of companies are thus possible using key ratios such as return on capital or net profit margin.
The Sustainable Value shows, in absolute terms, how much excess return is created by a company using its resources more efficiently than the benchmark. As in traditional financial analysis, a size problem arises when attempting to compare different companies: Bigger companies generally use greater quantities of resources and therefore tend to create a big- ger (positive or negative) Sustainable Value. As in financial analysis, we tackle this problem by relating the return of a company to another indicator representing the size of that com- pany. The resulting indicator is called the Return to Cost Ratio (RCR). The Return to Cost Ratio puts the return of a company in relation to the opportunity costs of that company. It is
2 Method for Calculating Sustainable Value
14
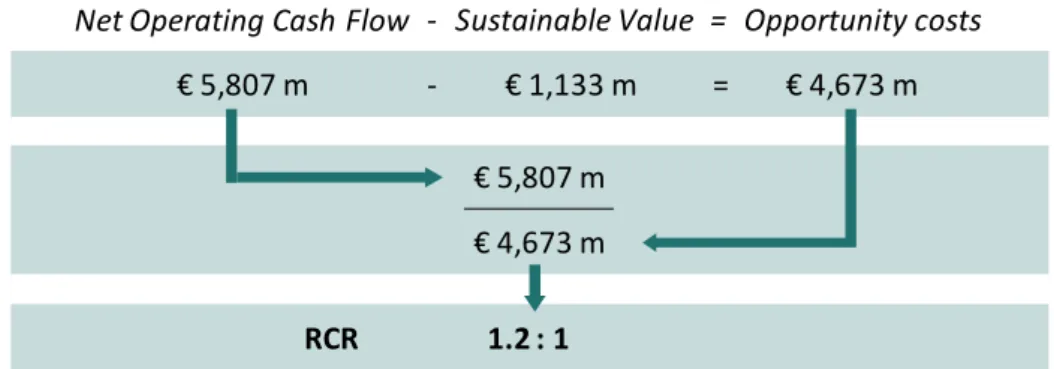
thus a typical benefit-cost-ratio. The opportunity costs reflect how much return could have been created, if the resources had been used in a different place. The opportunity costs of an entire bundle of resources can easily be calculated by deducting the Sustainable Value created by the company from the return generated by the company (see Figure 4).
To calculate the Return to Cost Ratio, we compare the cash flow of the company to the opportunity costs, i.e. to the cash flow the peer group would have created with the re- sources of the company. More precisely, we determine by which factor the cash flow of the company exceeds the opportunity costs and vice versa. Hence, the Return to Cost Ratio shows the factor by which a company uses its resources more or less efficiently than the benchmark. A RCR > 1 thus reflects that a company is using its resources more efficiently than the benchmark. A RCR < 1 shows that a company is using its resources less efficiently than the benchmark. A RCR of 1 : 2 hence shows that a company is using its resources only half as efficiently as the benchmark. Generally speaking the RCR represents a relative mea- sure of corporate sustainability performance in relation to a benchmark.
Net Operating Cash Flow - Sustainable Value = Opportunity costs
€ 5,807 m - € 1,133 m = € 4,673 m
€ 5,807 m
€ 4,673 m
RCR 1.2 : 1
BASF 2007
Figure 4: Calculation of the Return to Cost Ratio of BASF in 2007
Figure 4 shows that in 2007, BASF generated a cash flow that was 1.2 times higher than its opportunity costs, i.e. the cash flow that the peer group would have created with the resour- ces used by BASF. This means that BASF used its resources 1.2 times more efficiently than the peer group on average. By comparing Return to Cost Ratios we can thus find out how much more (or less) efficiently a company uses its resources compared to other companies.
2.5 Explanatory Power of Sustainable Value
The Sustainable Value and the Return to Cost Ratio show how effectively a company balances profit-seeking with its environmental and social responsibilities in production. They measure how much excess return is created by a company by using a set of resources more (or less) efficiently than the benchmark. The explanatory power of the analysis depends on the choice of the benchmark. In this study, the companies assessed constitute the bench- mark. The Sustainable Value therefore shows which of the companies within the set of chemical companies under analysis creates the most value using the respective economic, environmental and social resources. It provides a monetary measure of how efficiently an individual company does business compared with its peer group. The study consequently provides an analysis of selected companies within the chemical sector (best in class). It does
15
not provide any conclusions about the sustainability of resource use in the chemical sector compared with other industries. Therefore, the results do not allow any conclusions on whether the industry as a whole makes a contribution to a sustainable use of resources and promotes sustainable development.
Sustainable Value provides an indication of which economic, environmental and social re- sources are used by a company in a value-creating way, and which are not. This study does not deal with aspects outside the company. The calculation of Sustainable Value therefore does not take into consideration factors such as the performance of suppliers or product features. It also has limitations when it comes to sustainability aspects that cannot be reaso- nably quantified. This applies, for example, to corporate contributions to social and cultural projects. Sustainable Value calculations can only take into consideration those sustainability aspects that can be effectively quantified. The Sustainable Value does not attempt to ex- press a company’s entire commitment to sustainability in a single ratio. Qualitative sustain- ability aspects should be managed with qualitative instruments. Rather, the Sustainable Value approach provides a link between sustainability and the value-oriented approach that is common in management practice. The biggest advantage of Sustainable Value is therefore that it allows (a) to assess the use of environmental and social resources in the same way as the use of economic resources which (b) results in a comprehensive appraisal of sustainabili- ty performance. Company valuation and financial analysis, as well as management thinking, have traditionally focused exclusively on optimising the use of economic capital. The Sustain- able Value approach extends this one-dimensional focus and applies the value-oriented approach to the assessment of the use of environmental and social resources. Sustainable Value is therefore a practical tool for measuring – and ultimately managing – a company’s sustainability performance in the same way as its economic performance.
2.6 Sustainable Value and Resource Use
The use of resources plays a key role in sustainable development. By using environmental, social and economic resources companies have a negative impact on sustainable develop- ment. At the same time, companies require these resources to create a return and to pro- vide goods or services to society. There is therefore a trade-off between the need to create a return and the desire to reduce the use of economic, environmental and social resources.
Sustainable development is a societal concept. Sustainable Value therefore assesses the con- tribution of companies to sustainable development on this higher level. To do this, Sustain- able Value follows the example of the financial markets. In the financial markets the oppor- tunity cost of capital is defined from the perspective of the providers of capital who can spread their investments across many different companies. A company creates shareholder value, i.e. value from the perspective of the investors, when it uses economic capital more efficiently than other companies. By aiming to maximise their return on investment, share- holders contribute to a more efficient use of economic capital on a higher level. Analogously, a company contributes to Sustainable Value generation when it uses resources more effi- ciently than other companies.
2 Method for Calculating Sustainable Value
16
It is interesting to note that the Sustainable Value approach takes a differentiated view on the use of resources. For most other approaches in corporate sustainability assessment all resource use is considered to be negative. From the perspective of Sustainable Value it is the inefficient use of resources that is negative. An efficient use of a resource is even considered to be positive. In this context it should be kept in mind that Sustainable Value leaves the resource use on the benchmark level constant. However, Sustainable Value analyses show the potential for overall improvement by shifting resources from less efficient users to more efficient users (Figge et al., 2004c). From this perspective, it is desirable that companies with an above average resource efficiency use more resources at the expense of companies with a below average resource efficiency.
Interestingly, this also results in a differentiated view on the assessment of an increase or decrease of the use of resources. Standard management theory can once again help to ex- plain this. It is assumed that in a market economy investors will give more capital to compa- nies that are successful and will withdraw capital from companies that fail. This leads to an overall higher efficiency of the capital stock. Successful companies are therefore likely to use more rather than less capital in the future.
From the perspective of Sustainable Value an analogous rationale applies. Companies that use for example CO2 more efficiently than other companies should be allocated more CO2 in the future as this will result in a more efficient use of CO2 on the societal level. It is impor- tant to note that the same caveat as in the financial markets applies. This increased resource use must come at the expense of a decreased resource use of less efficient resource users. In the same way in which every unit of capital can only be invested once every ton of CO2 can also only be used once.
As Figure 5 shows, it is useful to distinguish between four cases when analysing the use of resources in the Sustainable Value approach. Both, the increase and the decrease of re- source use can have a positive and negative impact on Sustainable Value.
E f f i c i e n c y
Below average Above average
Resource use DecreaseIncrease
Value creating
Value creating
Value destroying
Value destroying
Figure 5: Sustainable Value and resource use
17
A higher Sustainable Value is attained by an increased resource use of a company with a higher resource efficiency than the benchmark or by a decreased resource use of a company with a resource efficiency that is below the benchmark. The latter case results in a reduction of a Sustainable Value loss. Accordingly, Sustainable Value is destroyed when inefficient companies are allocated more resources or efficient companies are allocated less resources.
This also applies to social resources. Labour is a good example in this context. From the perspective of Sustainable Value a more efficient use of labour is preferable to a less effi- cient use. Companies that use labour more efficiently than the benchmark can increase their Sustainable Value by increasing the amount of labour they use. A reduction of employment would lead to a loss of Sustainable Value in this situation. The use of less labour will only re- sult in a higher Sustainable Value when a company uses labour less efficiently than the benchmark. The underlying rationale is that the use of labour by efficient companies is preferable to the use of labour by companies that are less labour-efficient. The Sustainable Value therefore takes a differentiated view on the use of economic, environmental and social resources. It does not consider resource use as “bad” or “good” per se but assesses re- source use based on the contribution it makes to reconciling value creation, which is desirable, to the use of scarce resources, which is undesirable.
3 Scope of the Study
18 3 Scope of the Study
This chapter describes the scope of the study. In addition to the companies studied and the indicators assessed we also take a brief look at the review period. Finally, the chapter looks at data sources used, data coverage and the treatment of missing data.
3.1 Companies Studied
This study examines the Sustainable Value of nine chemical companies, reflecting a portfolio of a broad range of activities within the chemical sector. These companies are Air Liquide S.A. (Air Liquide), Akzo Nobel N.V. (AKZO), BASF SE (BASF), Bayer AG (Bayer), The DOW Company (DOW), Koninklijke DSM N.V (DSM), E. I. Du Pont de Nemours and Company (DuPont), Reliance Industries Limited (Reliance) and Shell Chemicals (Shell Chemicals).
3.2 Indicators Assessed
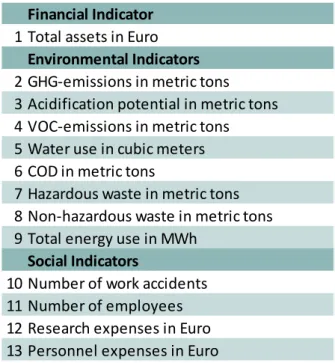
One of the great strengths of the Sustainable Value approach is that it allows an integrated assessmentof the use of economic, environmental and social resources by a company. For this to be possible, meaningful and quantifiable indicators need to be available on resource consumption. Thirteen different resource indicators were used in this study. These resources can be subdivided into one economic, eight environmental and four social indicators (see Table 1).
Financial Indicator 1 Total assets in Euro
Environmental Indicators 2 GHG-emissions in metric tons 3 Acidification potential in metric tons 4 VOC-emissions in metric tons 5 Water use in cubic meters 6 COD in metric tons
7 Hazardous waste in metric tons 8 Non-hazardous waste in metric tons 9 Total energy use in MWh
Social Indicators
10 Number of work accidents 11 Number of employees 12 Research expenses in Euro 13 Personnel expenses in Euro
Table 1: Economic, environmental and social indicators examined in the study
We were unable to incorporate additional environmental and social aspects due to a lack of available data (e.g. the indicators particulate emissions, nitrate emissions and phosphor emissions could not be included in view of the small number of companies reporting on these indicators or the unsatisfactory quality of the data reported), or due to the difficulty in
19
quantifying them (e.g. social issues such as employee satisfaction, which are usually mea- sured and managed with qualitative instruments).
As already mentioned, the return figure used for measuring profitability in this study is cash flow. We now take a brief look at the return figure and the indicators analysed in this study.
Return figure: net operating cash flow from ordinary business activities
Different return figures can be used to calculate Sustainable Value. The choice of the return figure impacts the explanatory power of the results of the assessment. This study uses the net operating cash flow from ordinary business activities as the return figure. Results con- sequently show how much value is created with the resources used for the owners and ex- ternal lenders of capital. Compared to measures based on accounting profits, the net opera- ting cash flow from ordinary business activities has the advantage of reflecting the business performance of the respective financial year in a very transparent way. Whereas this mea- sure of return is not suitable for industries in which profits are made across periods, as the cash flow shows returns on an accrual basis, suitability is given in the chemical sector were barely any returns are based on cross-period activities. To calculate Sustainable Value, we therefore look at the net operating cash flow from ordinary business activities (“cash flow”).
The financial performance data of the companies assessed in this survey have been mainly extracted from the data base “Bureau von Dijk”. Data have been cross-checked with annual reports to make sure financial figures do not include returns from extraordinary business activities. Foreign currency figures were converted into Euros on the basis of the average annual exchange rate of the underlying financial year using www.oanda.com.
Total assets
Capital use is at the centre of traditional financial analysis. The use of capital is included in this assessment to account for the economic pillar of sustainability. The use of capital must be matched to the measure of profitability applied. Return is measured in terms of cash flow for the purposes of this study. Therefore, a corresponding broad capital figure can be chosen, i.e. it can include both on loan capital and equity capital. The use of capital in this survey is thus approximated with total assets measured in Euro.
Greenhouse gas (GHG) emissions
Greenhouse gases contribute to global warming. In this survey, we look at both, direct and indirect GHG-emissions of companies, i.e. we look at GHG-emissions that occur within the production processes and at those from the combustion of fossil fuels for the production of the electricity that is consumed during the production processes. It is possible to argue that indirect emissions occur during the production of electricity and not directly during the pro- duction processes of chemicals. For the purposes of this study, however, we decided to in- clude indirect emissions in order to avoid any bias regarding own generation or purchase of electricity. GHG-emissions from transportation were not considered on the grounds of data availability. GHG-emission figures are given in CO2-equivalents, measured in metric tons and comprise all kinds of greenhouse gases.
3 Scope of the Study
20
Acidification potential
Certain combustion and production processes produce sulphur oxide (SOx) as well as nitro- gen oxide (NOx), both causing acidification of the soil and damaging forests. Along with other pollutants, NOx and SOx also encourage the formation of ozone at ground level (Beckert, 1999). The analysis of NOx- and SOx-emissions in this survey includes emissions from statio- nary sources, as well as emissions from own electricity generation. Transport-related emis- sions were not recorded. NOx- and SOx-emissions are summarized and expressed in equiva- lents of acidification potential. The acidification potential has been calculated using the factors 1.2 for SOx and 5 for NOx (Institute of Environmental Sciences, 2002).
Volatile organic compounds (VOC) emissions
Emissions of volatile organic compounds mainly occur during combustion processes, during production of varnishes and cleaning agents and through the use of solvents. VOC-emissions are causing smog and ground-level ozone (Beckert, 1999). We analyse direct VOC-emissions from stationary sources and did not include indirect and transport-related emissions. VOC- emissions are measured in metric tons.
Water use
Water scarcity is increasingly perceived to be an environmental and social problem through- out the world. We therefore include every type of water input, excluding the use of cooling water and water that is operated in closed-loop-cycles, in our analysis. Water use is mea- sured in cubic meters.
Chemical oxygen demand (COD)
The removal of oxygen from water reduces its ability to sustain life. The chemical oxygen de- mand reflects the degree of pollution of industrial waste water with organic compounds. It describes how much oxygen is required for oxidising all organic compounds within waste water. COD is measured in metric tons in this survey.
Hazardous Waste
In this study, waste is taken into account differentiated as non-hazardous and hazardous waste. Hazardous waste in this survey covers non-reusable waste for disposal on a dry basis which is labelled as hazardous by the reporting companies. There is no harmonised legal de- finition of hazardous waste among different countries. We therefore cannot assure that the definitions of what is considered hazardous waste are 100% identical among the companies assessed in this survey. Hazardous waste is measured in metric tons.
Non-hazardous waste
Non-hazardous waste covers any output that is non-hazardous and goes to landfill or incine- ration. Waste in this survey thus does not include any outputs created during manufacturing that are to be reused or sold. In addition, we only consider non-hazardous waste from the company’s ordinary business activities. This means, for example, that building rubble created
21
during (exceptional) remodelling of production facilities is not considered as non-hazardous waste. Non-hazardous waste is measured in metric tons on a dry basis.
Total energy use
Depending on the source of energy, energy use contributes to global warming and the de- pletion of natural resources. The total energy use in this survey is defined by the net energy consumption of a company, i.e. self-produced energy minus energy sold to third parties plus purchased energy from third parties. It contains energy from renewable sources and is mea- sured in Megawatt hours (MWh).
Number of work accidents
Work place safety is an important social corporate sustainability criterion. In this survey, we assess work place safety by considering the absolute annual number of work accidents in a company. The “one-day rule” applies, i.e. every accident is counted that leads to an absence of at least one working day. The analysis covers both blue-collar and white-collar workers, but does not include accidents while commuting to or from work. As some companies only report relative figures, such as the Lost Time Injury Frequency Rate, we calculated the absolute numbers of work accidents, which are necessary for calculating Sustainable Value (see chapter 3.5.4 for more details).
Number of employees
An important part of corporate sustainability is the creation of employment. As a social indi- cator, this survey assesses the head count for each company based on all employees, inclu- ding trainees and part-time employees. The analysis is based on annual full-time equivalents as of 31 December of each year.
Research expenses
Research is an important indicator for the persistence of corporate success in the chemical sector. The efficiency of the research expenses assessed in this survey includes all expenses for research and development and is measured in Euro.
Personnel expenses
Personnel expenses constitute a second social indicator reflecting the input of human re- sources in this study. It covers salaries, wages, bonus payments, social security contributions and costs for pensions. From the point of view of traditional economics labour is a (scarce) production factor. It is for this reason that we have included this indicator expressed as personnel expenses, measured in Euro.
3.3 Review Period
This study looks at the Sustainable Value of the nine chemicals companies over a four-year period from 2004 to 2007. The year 2003 had to be excluded from this assessment, as the quality of environmental performance data from the majority of the companies was insuffi- cient.
3 Scope of the Study
22
3.4 Data Sources and Data Collection
The data used to assess the utilization of the different resources examined in the study were taken from the reports published by the individual companies. These included environmen- tal, sustainability, CSR and integrated reports. We also referred to publications available on the companies’ websites. Financial performance data were taken from the Bureau van Dijk data base and verified by examining the companies’ annual reports to exclude exceptional business activities.
These data sources were used to assess the performance of the nine chemical companies over the review period. We checked and where necessary adjusted the collected data to ensure its quality, integrity and comparability (see 3.5 and Annex I: Notes on Data of the Companies under Analysis). The relevant companies were contacted directly if any ambi- guities or questions arose. At this point, the companies had the opportunity to comment on the data and provide corrected or missing data. After this feedback round, the data sets for each company were prepared. These data sets were then used to calculate the Sustainable Value of the respective companies. At the same time, these data were used to calculate the average efficiency of resource use in the peer group as a whole, which then served as a benchmark for the assessment (see step 2 in chapter 2.3).
3.5 Data Coverage, Treatment of Missing Data and Data Problems
Despite intense data collection efforts, we were unable to prepare a full data set for all com- panies for every year of the review period. This is mainly due to the different reporting stan- dards for environmental and social data among companies. One general point that comes to light here is that the area of environmental and social reporting, unlike traditional accoun- ting, is still a long way from being standardised when it comes to the scope and quality of data. This section looks at data coverage for the different resource indicators (3.5.1). We then give some examples how data gaps and data problems were dealt with for the purpose of this study. More specifically, this refers to the problem of missing data (3.5.2), dealing with different scopes of consolidation (3.5.3), calculating and extrapolating data (3.5.4) and dealing with corrected data (3.5.5). A complete summary with detailed information on dea- ling with different scopes, assumptions, calculations and estimations made with regard to missing or incomplete data of the individual companies is attached in Annex I: Notes on Data of the Companies under Analysis.
23
3.5.1 Data Coverage
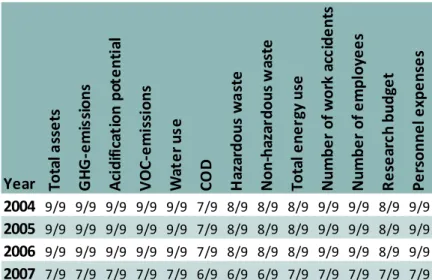
The following Table 2 provides an overview on the data coverage for the thirteen resources examined over the entire assessment period of this survey. It becomes evident that data coverage varies particularly in 2007. This is mainly due to Reliance and Shell Chemicals, who had not yet published their environmental performance data for that financial period at the time that the data for this assessment were gathered.
Year Total assets GHG-emissions Acidification potential VOC-emissions Water use COD Hazardous waste Non-hazardous waste Total energy use Number of work accidents Number of employees Research budget Personnel expenses 2004 9/9 9/9 9/9 9/9 9/9 7/9 8/9 8/9 8/9 9/9 9/9 8/9 9/9 2005 9/9 9/9 9/9 9/9 9/9 7/9 8/9 8/9 8/9 9/9 9/9 8/9 9/9 2006 9/9 9/9 9/9 9/9 9/9 7/9 8/9 8/9 8/9 9/9 9/9 8/9 9/9 2007 7/9 7/9 7/9 7/9 7/9 6/9 6/9 6/9 7/9 7/9 7/9 7/9 7/9
Table 2: Data coverage
3.5.2 Treatment of Missing Data
As becomes evident in Table 2, there were no data available for some of the resources for several of the companies assessed – either for the entire review period or for specific years.
If a company does not report on an indicator included in this assessment the performance of that company was set to the average performance of the companies included in this assess- ment, i.e. on benchmark level. In other words, it is assumed that the company does not use this resource in a value-creating way.
The missing environmental data for 2007 of Reliance and Shell Chemicals have been approxi- mated based on the ratio of sales per resources of the year 2006. However, this estimation has only been used for constructing the benchmark and not for the company-level assess- ment of the respective companies. For the year 2007, accidents with more than one day sick leave have been calculated using the ratio of accidents with more than one day sick leave per employee of Reliance and Shell Chemicals in 2006 respectively.
3.5.3 Different Scopes of Data
One important step in determining Sustainable Value is the comparison of corporate re- source efficiency with the benchmark efficiency (see step 3 in chapter 2.3). The calculation of these efficiencies therefore plays a central role. They are obtained by dividing the compa- ny’s cash flow by the quantity of the respective resources used. In order to produce mea- ningful results, it is vitally important that the same system boundaries (scope) apply to the return figures and the data on resource use (United Nations Conference on Trade and De- velopment, 2003). No meaningful comparison can be made, for example, between a cash
3 Scope of the Study
24
flow figure that applies to the entire group and a figure for water consumption that only co- vers part of the company (e.g. a specific division or region). Unfortunately in some cases, the environmental and social data reported by companies tend to have different system boun- daries than the published financial figures.
In such cases there are two possible ways of matching up the scope for the figures available on corporate cash flow and resource use:
One way is to reduce the scope of the financial data to match the scope of the envi- ronmental or social indicator. We can illustrate this using the example of Reliance, whose oil-exploration activities are not included in the environmental data of the company. Therefore, the business unit “oil and gas separation” (in 2006 and 2007) and “other businesses” (in 2004 and 2005) have been excluded from the financial data.
Another way is to extrapolate the reported environmental and social data to match the scope of the companies. To do so, however, we have to assume that those divi- sions for which no data are available use resources with the same efficiency as those divisions for which data are reported. When compiling the study, extrapolations were undertaken on the basis of different allocation keys. One possibility is to extrapolate with the help of the company’s production or sales figures. The scope of the environ- mental data of Air Liquide for example was stated by the company in 2004 as 89% of total sales (94% in 2005, 98% in 2006 and 2007). In consultation with Air Liquide, we extrapolated all environmental data to 100% in all years accordingly.
3.5.4 Calculating and Estimating Performance Data
In many cases companies report relative figures on the use of various resources rather than absolute figures. In such cases, the absolute performance figures have to be determined based on various estimates and assumptions. For example, a popular form of reporting of work accidents is the number of work accidents per one million hours worked (e.g. BASF, Bayer, Shell Chemicals). To come up with the absolute number of accidents, which are necessary to calculate the Sustainable Value, estimates need to be made of the average annual working hours in these companies. For the purposes of this study, we referred to the official labour market statistics published by the OECD (OECD, 2007). The projections made are based in each case on the average number of hours worked in the company’s home country.
3.5.5 Dealing with Data Corrections
In one case (DOW) environmental data have been consolidated backwards to correspond to the structure of the company in 2007. Unfortunately, there are no financially backwards con- solidated data available. We have decided against re-calculating any environmental or finan- cial data, due to the fact that changes in company structure in 2007 were not significant. We acknowledge the fact that there is a slight mismatch of scopes of consolidation in this speci- fic case.