ANALYSIS
Poverty, Social Security and Civil Society in South Africa
Triangulating Transformation
Stafflenbergstraße 76 D-70184 Stuttgart Phone: ++49 (711) 2159-0 Fax: ++49 (711) 2159-288
E-Mail: info@brot-fuer-die-welt.de www.brot-fuer-die-welt.de
Author: Isobel Frye, Studies in Poverty and Inequality Institute, 108 Fox Street, Johannesburg, South Africa
Editorial Staff: Mechthild Schirmer, Sabine Schlecht, Dr. Klaus Seitz Layout: Jörg Jenrich
Responsible: Thomas Sandner
Cover Photo: Gerd-Matthias Hoeffchen Printing:
Art. Nr.: 121 319 010
Printed on recycled paper
Stuttgart, December 2008
Triangulating Transformation
Isobel Frye
(Studies in Poverty and Inequality Institute)
Tables and Overviews Terms
Abbreviations
Preface 11
1 Introduction 12
2 Setting the scene – levels of poverty, inequality and
unemployment in South Africa 14
2.1 Access to income 15
2.2 Inequality 16
2.3 Life expectancy 17
2.4 Access to housing 17
2.5 Access to water 18
2.6 Access to sanitation 18
2.7 Literacy and matric pass rates 19
2.8 Health 19
2.8.1 Malnutrition 19
2.8.2 HIV/AIDS 19
2.8.3 TB 20
2.8.4 Malaria 20
2.9 Unemployment 20
2.9.1 Number of unemployed people in South Africa 21
2.9.2 Length of unemployment 22
2.9.3 The face of unemployment 22
2.9.4 Provincial overview 22
2.9.5 Are jobs decent jobs? 23
2.9.6 Formal/informal sector jobs 23
2.10 Salaries/wages 23
2.11 Conditions of employment 23
2.12 Concluding remarks 24
3 Social security policy 25
3.1 Nature of social security 25
3.2 South African social security policy and legislative framework 25
3.2.1 Social security policy 25
3.2.2 Main legislative instruments 26
3.3 Social Insurance and Social Assistance schemes in South Africa 26
3.3.1 Public Social Insurance 26
3.3.2 Private contributory schemes 27
3.4 Social assistance – non-contributory social grants: contextual analysis 27
3.4.1 Available grants 28
3.4.2 Gaps in coverage including those caused by targeting and conditionalities 31 3.4.3 Institutional arrangements, applications and appeals 33
3.4.4 Value of grants 34
3.5 Minimum wages 34
3.6 Summary 34
3.7 Recommendations 34
4 Civil society views and position on social security 36 4.1 Analysis of social, political and economic threats to peace, freedom
and development in South Africa 36
4.1.1 Political threats 36
4.1.2 Social threats 37
4.1.3 Economical threats 37
4.1.4 Vulnerable groups 37
4.1.5 Social security 38
4.1.6 Patterns of inequality 39
4.1.7 Traditional forms of social security 39
4.1.8 Current social security reforms 39
4.1.9 Civil society’s role in addressing social security reforms 40
5 Introduction to retirement reforms 42
5.1 Background 42
5.2 Involvement of NEDLAC 43
5.3 Issues for further deliberation 43
6 Conclusions and recommendations 45
Annex 46
Thanks and Acknowledgements 55
References 56
Tables
Table 1: Percentage of people living below a poverty line of R3000
per annum from 1993 to 2006 15
Table 2: Total number of people living beneath a poverty line of R3 252
per annum in 1997, 1999 and 2002 (in 2002 prices) 15 Table 3: Number and proportion of people in South Africa living on
less than 1US$ per day from 1996 to 2005 in 2000 constant prices 16 Table 4: Gini coefficient by population group, 1991 to 2001 17 Table 5: Life expectancy in years, South Africa 2001 to 2007 17 Table 6: Number of households, and access to housing by household,
various years between 1996 to 2005 18
Table 7: The number and rate of estimated AIDS deaths per province
in 2006, ranked ordinaly from highest 19
Table 8: Average household income by main income group and
population group of household head 20
Table 9: International comparisons, labour force and unemployment rates 21 Table 10: Official unemployment rate as percentiles by population group
and sex, September 2001 and September 2007 22
Table 11: Rates of unemployment per province in September 2007 23 Table 12: Projected number of beneficiaries per grant for 2007/2008 28
Table 13: Targeting and the means test 31
Overviews
Overview 1: Main principles and recommendations of the Department of
Social Development 46
Overview 2: Main principles and recommendations of the Department of Finance 48
Cash transfers social assistance grants Grants
social assistance cash transfers
Retirement Fund Defined Benefit arrangement
The benefit received by participants is based on a formula related to earnings – usually earnings towards the end of a career progression. This is fixed according to a formula which should be based on inflation-adjusted career-average earnings (Rusconi 2007, 21).
Retirement Fund Defined Contribution arrangement
The benefit received by participants is based on the contributions paid and any in- vestment returns gained on these contributions. Benefits are not guaranteed. Annuity payments are assumed to increase at the rate of inflation (Rusconi 2007, 21).
Social assistance
used to refer to revenue funded non-contributory social cash transfers/grants to indivi- duals in South Africa. Social assistance in South Africa has a redistributive effect given the progressive structuring of the Income Tax system.
Social insurance
refers to state regulated insurance funds including unemployment insurance schemes.
Private insurance schemes include medical aids, disability provision, and retirement and life insurance schemes.
Social security
used to refer collectively to social insurance and social assistance programmes.
ACESS Alliance for Children’s Entitlement to Social Security
BIG Basic Income Grant. Civil society launched a campaign in South Africa in 2001 calling for the introduction of a universal basic income grant to be paid by the state to all South Africans of R100 (in 2000 prices) to address the high levels of poverty experienced throughout the country given the high levels of unemployment.
CICLASS Centre for International and Comparative Labour and Social Security Law COSATU Congress of South African Trade Unions. The largest federation of trade
unions in South Africa, formed in 1985.
CSG Child Support Grant (South Africa social assistance grant for children under 15 years of age)
DSD Department of Social Development EPRI Economic Policy Research Institute HSRC Human Sciences Research Council
IES Income and Expenditure Survey. A five yearly household survey under- taken by Statistics South Africa of about 21 000 households across the country.
ILO International Labour Organization
NEDLAC National Economic Development and Labour Council. A statutory social dialogue chamber with representatives from government, formal business, organized labour and community constituency (civil society organsiations).
It is mandatory for all new policies that will affect either workers’ rights or socio-economic rights to be negotiated in this chamber before legislation goes to Parliament.
OAP Old Age Pension (South African social assistance grant to older people).
PBC People’s Budget Campaign. A civil society coalition formed to present pro- gressive pro-poor policy alternatives made up of the South African Council of Churches, the Congress of South African Trade Unions and the South African NGO Coalition.
RDP Reconstruction and Development Programme SACC South African Council of Churches
SASSA South African Social Security Agency TAC Treatment Action Campaign
ANAL
ANAL Preface
For many years now the work of „Brot für die Welt“
(Bread for the World) and its partners has focused on the poor, with the aim to do them justice and to spur self- improvement. A series of so-called „Hunger Studies“ in various countries and world regions proved the need for specific strategies to reach the poorest of the poor. For these communities existential security has become the prerequisite for income-generating measures and thus for forms of help towards self-help. Hence within the framework of the „Global Poverty“ project „Brot für die Welt“ and its partners want to enhance their engage- ment on the issue of social security, in particular by ap- proaches to basic social protection aimed at the poorest of the poor. Guidance by human rights is the foundation for that.
A first study in this context, elaborated on behalf of
„Brot für die Welt“, called „Basic Social Protection – positions of key development actors“ (author: Markus Loewe) specified the meaning of „social basic protec- tion“ and the positions significant development actors have adopted in connection with fighting poverty. This study provided an important educational basis for our own position finding and concept development process.
Furthermore, it was meant to importantly contribute to current debates in Germany, triggered by resolutions of the German Parliament regarding future weighty deal- ings of public development cooperation with social pro- tection.
With the present study of „Poverty, Social Security and Civil Society in South Africa“ worked out by the Studies in Poverty and Inequality Institute in Johannesburg on behalf of „Brot für die Welt“ we like to make a further contribution to the current debate and present out- comes from the South African discussion about „basic social security“ to a wider audience. Also referred to the South African year of election in 2009 there is a strong engagement within civil society organizations on social security issues. We are discerning promising activities of our partners whose support and expertise is of value for our own position finding and concept development.
Especially the challenge of the HIV/Aids pandemic be- comes apparent in that context. Thus, the study delivers notable starting points for the future cooperation work of „Brot für die Welt“ with our partners in South Africa and it is essentially of use for our advocacy work in Germany and worldwide.
Stuttgart, November 2008 Mechthild Schirmer Sabine Schlecht
„Global Poverty“ Project Brot für die Welt
ANAL1 Introduction
How best can policy makers make an impact on improving the lives of people living in poverty and destitution? That is the question that seizes gov- ernments across the world, both in developing and industrialized nations. Identifying the right policies to ensure sustained economic growth is not sufficient to ensure that the benefits of that growth do in fact benefit all. Inequality in income, assets and opportunities are increasing in all countries as top earners name their salaries and benefits, and low skilled workers are moved out of secure, decent jobs.
In a country such as South Africa, as a result of deliber- ate policies designed and pursued under Apartheid and previous colonial policies, many millions of people were sentenced to pursue lives linked to low skilled and low paid jobs. Education, access to land, to credit and the ability to operate any form or business or to accumulate assets and reserves against a rainy day were determined crudely and cruelly along basic racial lines. Political free- dom could not be expected to invert that overnight.
Patterns of exclusion and marginalization are repro- duced across generations. The legacy of a large low- skilled workforce also came into direct crisis towards the end of the previous century with the demise of the demand for low skilled workers as a result of the move away from primary extraction and agriculture in the South African economy and towards secondary and ter- tiary sectors, requiring higher and better skills.
Poverty, unemployment and inequality are reaching crisis levels. The added impact of HIV/AIDS can often prove to be a tipping point for already vulnerable house- holds, threatening household disintegration and the de- mise of any forms of coping or survival strategies that had been employed before.
Most people do not want to see themselves as grant recipients all of their lives, but from qualitative evidence it is clear that while people are unemployed, the income
from social grants into households provides a very nec- essary – although never adequate – temporary relief.
Section 27(1)(c) of the South African Constitution guar- antees to everybody in South Africa a right to social se- curity and the right to social assistance is further guaran- teed to those that are not able to look after themselves and their dependents. This right is however tempered by an internal limitation in Section 27(2) that places on the state the obligation to progressively realize this universal right subject to the state’s available resources.
And that is exactly where policy makers in South Africa are now – trying to work what constitutes a reasonable allocation of state revenue to expanding the social secu- rity net into a comprehensive, system adequate to the challenges at hand.
While South African social security provisioning is cor- rectly hailed as being more extensive than in most de- veloping nations, there are many millions of poor and unemployed people who have no direct cover under this system.
Social transfers (grants) are targeted to non-working age people (children and the elderly) and people living with disabilities. This design makes no acknowledgement of the fact that more than a third of working age people are unemployed, or that the majority of employed people are paid such low wages as to constitute the working poor.
Activists for social justice in South African civil society range in their responses to this social, economic and political crisis. Those who view poverty as being linked in some way to a lack of self-agency would advocate for self-help schemes such as food gardens, whilst those who viewed the failure of the system to provide for eve- rybody’s needs would state that the structural nature of poverty and inequality and unemployment called for an equally structural reform of the distribution hereof.
In this paper we present a case study of South Africa, looking at three main areas, namely an overview of pov- erty within the country, a review of the social security policies that exist and a review of the positions held
ANAL
by various NGOs and membership-based organizations within South Africa on the role and their relationship with social security.
The speed of the announcement of the reforms by the Department of Social Development is staggering. From an abolishment of the need for certain identification documents which have always acted as an obstacle to accessing social grants, to a radical reform of the means test, to equalizing pensionable ages for men and women – all within three weeks. Yet there is still a lot to be done, and civil society should be engaging with seeing the formulation of the policies and enacting legislation as well as a subsequent monitoring of the implementa- tion of these reforms.
This paper ends with an overview of certain more fun- damental social security reforms that are being mooted within government, with an explanation of their differ- ences in the positions which the authors trust will make the debate more accessible to South African advocates for justice and transformation, and concludes with a recommendation on how civil society’s engagement in this field could be strengthened.
This paper was commissioned by „Brot für die Welt“ as part of a six country study on social security and civil society internationally.
ANAL2 Setting the scene – levels of poverty, inequality and unemployment in South Africa
Poverty is an internationally contested issue and the way a country defines the concept of poverty depends largely on the commitment of societies to address the causes and effects thereof. In addition, poverty is multifaceted, reflecting unmet needs and exclusions across complex and often mutually reinforcing dimensions.
The wealth of studies undertaken on poverty have also thrown up a confusing and often conflicting range of theories and definitions, from subjective analyses of poverty as experienced by real people, to „scientific“
and so-called „objective“ statistical analyses and econo- metric extrapolations; from absolute definitions to rela- tive definitions to definitions of relative poverty with an absolute core.
The school of work that measures poverty is equally ob- scure to the average person on the street. These arcane trappings of thinking provide many hurdles for policy makers wishing to develop appropriate and effective poverty eradication or alleviation programmes; these trappings can also alienate civil society organizations and alliances wishing to work for the end to poverty.
In all of this, the voices, experiences and opinions of poor people often do not even cause a ripple on the surface of the debates.
The above holds true for South Africa as a country too.
2008 will be dominated to some extent on debates about the design and development of a national com- prehensive anti-poverty strategy; who is involved in this debate, what the policy is meant to achieve and how various actors will be involved in the implementation of this strategy once it is adopted.
Concurrently, but as a parallel initiative, there is a na- tional debate about the design and adoption of national poverty measures. This latter debate is dominated by a departure between some government policy makers
who believe on the one hand that a poverty measure is a merely technical exercise and should be left to the experts, and on the other hand, a growing number of civil society organizations are demanding that the very definition and subsequent design of measures of poverty must be opened up for national debate, with specific processes designed to obtain input from poor people.
In the interim, statistics on poverty abound, and again, many of the conclusions on poverty levels reached by diverse academics and research institutions appear to be mutually incompatible. In South Africa, the context of poverty analysis for historical reasons is also located primarily in the post-1994 era, as few surveys included people who had been declared to be citizens of the former Bantustans.
This time lens can be used or interpreted given the polit- ical change of government in 1994 as constituting an a historic criticism of the influence or impact of the ANC government, which again can be extremely unhelpful and alienating of effective solution seeking.
What no-one can deny however is that poverty in South Africa has reached crisis proportions. The triangula- tion between poverty, unemployment and inequality is seldom as starkly visible in other countries, and the reach of apartheid racist policies continues to be repro- duced within these domains, despite the South African constitutional guarantees of the right to life, to dignity and equality, and the guarantees of the justiciable socio- economic rights contained in Chapter Two of the South African Constitution. The scale of the problem some- times seems to paralyse the search for solutions and re- lief programmes.
In this analysis we shall examine the main domains of poverty, inequality and unemployment. The question of access to social security, as a policy intervention that could focus income directly to the poor, and also ad- dress income inequality to some extent through a redis- tributive financing system has to be considered against the trends win employment and unemployment given the usual methods of enrolment in social security sys- tems to date.
ANAL
2.1 Access to income
A headcount analysis of people living in poverty (below a poverty line) depends of course on where that line is drawn, and the data source used. South Africa has no official definition of poverty, nor any official meas- urements of poverty. The result of this is that various researchers and analysts use diverse measures, which makes inter-study comparison very difficult. In addition, given concerns about the reliability of survey data sets, the various poverty measures are applied to a variety of data sets. There is currently a policy initiative afoot to adopt an official poverty measure which will hopefully bring an end to debates about poverty levels and enable further and better engagement with what is to be done about the poverty levels.
Using a poverty line of R3000 per person per annum (R250 per person per year) in 2000 constant Rand,
Stellenbosch University academic Servaas van der Berg has plotted the poverty headcount trend since 1993 to 2006 (see Table 1).
The total percentage of people living below this poverty line appears to be dropping. This trend has been ascribed to the large increase in the availability of social grants, particularly since 2000. This suggests that the apparent decrease in poverty is not a structural decrease, but re- flects that people are better off on a monthly basis as a result of receiving a social grant.
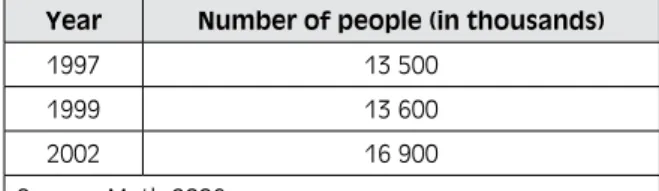
There is a difference however between increases or decreases in rates of people living in poverty and the actual number of people in poverty. Thus if we look at a table of figures used by Dr Charles Meth that records the number of people living in poverty between 1997 and 2002, we can see that this number has in fact risen by 3.4 million people. Meth uses a poverty line of R271 per person per month in 2002 prices, which would be R3 252 per person per annum.
Year Percentage of people living below the poverty line
1993 50.1
1994 50.5
1995 50.75
1996 53.1
1997 51.2
1998 51.0
1999 52.1
2000 50.8
2001 51.4
2002 49.0
2003 47.6
2004 46.9
2005 44.5
2006 43.2
Source: The Presidency 2006, using figures from S. van der Berg, 2006 and AMPS data. AMPS figures are based on a private sector survey, and the sample methodology used for this survey has been questioned for a possible bias towards the middle and higher income bands.
Table 1: Percentage of people living below a pov- erty line of R3000 per annum from 1993 to 2006
Table 2: Total number of people living beneath a poverty line of R3 252 per annum in 1997, 1999 and 2002 (in 2002 prices)
Year Number of people (in thousands)
1997 13 500
1999 13 600
2002 16 900
Source: Meth 2006
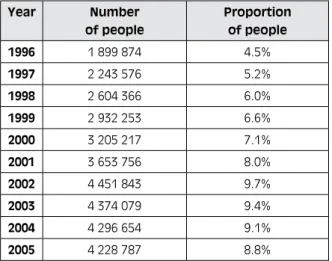
According to the South African Institute for Race Relations 2006/07 South African Survey using data from Global Insight Southern Africa’s 2006 Regional Economic Focus, the total number of people living on less than US1$ per day in constant 2000 prices in 2005 was just over 4 million, or 8.8% of the population.
According to their data, this rate has increased signifi- cantly since 1996, but has fallen steadily since a peaking in 2002 as set out in the following table.
ANAL
Headcount figures are unable to provide any real insight into poverty trends an a distributional basis, whether between income deciles, or between population groups etc.
According to work by Leibbrandt et al. (Leibbrandt et al. 2006, 47), whilst real incomes improved at the top end of the income distribution, there was a pronounced decline for middle and lower income people using the 1996 and 2001 Census figures.
Between 1996 and 2001, whites as a total share of the population fell from 11% to 9%, but their share of the total income increased from 47% to 48%. During this same period, the share of Black Africans as a total share of the population rose from 78% to 80%, however the total share of income to Black Africans remained at 38%
of total income. This rate has been growing steadily since 1970, albeit from a very low base line.
It is thus significant that this rate did not increase be- tween 1996 and 2001 for the first time since 1970, despite the concerted policy and legal instruments that were being rolled out to ensure greater access to income and assets for Black African South Africans.
2.2 Inequality
Based on this information, it is not surprising that study after study shows that inequality, especially income in- equality, has risen steadily since 1994.
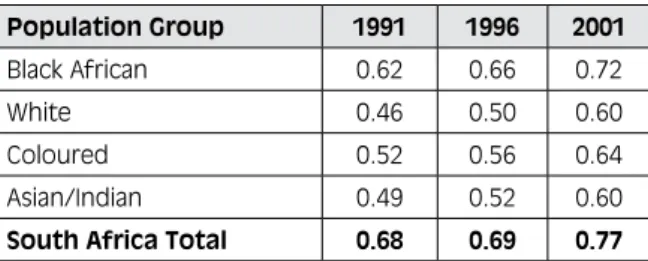
Leibbrandt et al. find that income inequality has risen from 0.68 on the Gini Coefficient (0 being total equality, 1 being absolute inequality) to 0.73 in 2001 (Leibbrandt et al. 2006, 101).
A Fact Sheet on Poverty brought out by the Human Sciences Research Council (HSRC) reflected that ac- cording to their data, income inequality had grown from a higher baseline, 0.69, in 1996 to a higher rate of 0.77 in 2001 (Human Sciences Research Council 2004).
Mean per capita income has grown in all deciles be- tween 2000 and 2005/06, but the distribution of the growth has been very different across income deciles.
According to the 2005/05 Income and Expenditure Survey, above – average increases in the distribution of the growth occurred in income deciles 1, 2, 3, and 10, and below – average increases in the remaining deciles.
The above-average increase in the lowest income decile has been attributed directly to the impact of the in- creased access to social grants (Statistics South Africa 2008, 2 and 35).
According to this analysis, the top ten% of the South African earns 50% of the income, while the lowest two deciles access 1.5% of the total national income (Statistics South Africa 2008, 2). The top decile’s mean income was 94 times that of the lowest decile (Statistics South Africa 2008, 31).
The income of social grants into poor households has been found by Statistics South Africa to lower the Gini coefficient in terms of income inequality from 0.80 to 0.73, which is significant.
As a social policy tool to address inequality in South Africa, the payment of social grants has significance, but the intentional progressive nature of the income tax system has been shown in this IES to have no statistical
Year Number
of people
Proportion of people
1996 1 899 874 4.5%
1997 2 243 576 5.2%
1998 2 604 366 6.0%
1999 2 932 253 6.6%
2000 3 205 217 7.1%
2001 3 653 756 8.0%
2002 4 451 843 9.7%
2003 4 374 079 9.4%
2004 4 296 654 9.1%
2005 4 228 787 8.8%
Source: South African Survey 2006/07 2007, 202
Table 3: Number and proportion of people in South Africa living on less than 1US$ per day from 1996 to 2005 in 2000 constant prices
ANAL
significance as far as inequality reduction goes (beyond being the source of the revenue for the grants) (Statistics South Africa 2008, 35).
This is a powerful argument in favour of extending cov- erage to social grants to currently excluded poor people should the state be concerned at the apparent unstoppa- ble increase in income inequality within South Africa.
Inequality between population groups has also grown quite phenomenally. Interestingly, while the media and analysts frequently make reference to the growth in income inequality amongst Black Africans, the follow- ing table from the Human Sciences Research Council shows that the population group with the highest rate of increase in income inequality between 1996 and 2001 were Whites, followed closely by Asian/Indian, then Coloured and lastly black African.
Mainstream fixation with the growth of the black middle class – or ‘black diamonds’ – might tend to obscure the real concern – namely the large increase in difference between those who have adequate resources and those who do not, by suggesting that if the trend is affecting all population groups equally, then we are witnessing a
‘normalisation’ of a racially divided state.
Income figures are at best one indication of people’s well-being. Life expectancy figures are another proxy for indicating well-being, and trends in this regard are useful.
Population Group 1991 1996 2001
Black African 0.62 0.66 0.72
White 0.46 0.50 0.60
Coloured 0.52 0.56 0.64
Asian/Indian 0.49 0.52 0.60
South Africa Total 0.68 0.69 0.77 Source: Human Sciences Research Council 2004
Table 4: Gini coefficient by population group, 1991 to 2001
2.4 Access to housing
According to section 26(1) and (2), everyone in South Africa has the right to adequate housing, and the state is obliged to take reasonable legislative and other meas- ures within its available resources, to progressively real- ize this right.
Table 6 indicates that access to both formal and infor- mal dwellings has increased steadily since 1996. The total number of households has also increased from 9 059 606 in 1996 to 12 726 000 in 2005. According to statistics of The Presidency, the total number of hous- es completed since 1994 is 2.3 million till March 2006, although it is not clear whether these only refer to all houses built, to only state provided houses including both houses of the Reconstruction and Development Programme (RDP), subsidized houses and rental stock (The Presidency 2006, 28).
Access to formal housing is significantly determined by race or population group. Based on their analysis of the 2001 national Census, in 2001, 59.7% of black Africans Table 5: Life expectancy in years, South Africa 2001 to 2007
Year 2001 2002 2003 2004 2005 2006 2007 Life expect-
ancy in years 54.6 53.8 53.0 52.3 51.9 50.7 50.0 Source: The Presidency 2006, 26
2.3 Life expectancy
Life expectancy in South Africa has been steadily declin- ing. The impact of AIDS, exacerbated by poverty, clearly has had an impact on life expectancy as set out in the following table.
Other indicators of well-being include access to housing, land, sanitation, land, education and health indicators.
In this regard we include statistics on infection levels of Malaria and HIV/AIDS.
ANAL
By 2006, 84.7% of the 12.8 million households enjoyed access as defined by the DRP standards, but 6% (namely 765 176 households) had no access to any water in- frastructure. According to the Presidency, by 2006, 9.5 million households had access to government’s Free Basic Water programme (The Presidency 2006, 29).
11.9% of Black Africans however still had to source wa- ter from a stream/dam/river or spring in 2001, com- pared to 0.8% of Coloured people and 0.1% of Indians/
Asians and Whites respectively (Leibbrandt et al. 2006, 118).
2.6 Access to sanitation
By 2006, 70.75% of households in South Africa had ac- cess to basic acceptable sanitation (defined as a venti- lated improved pit latrine), leaving a backlog of more than 3.7 million households (The Presidency 2006, 30).
While over 97% of Whites and Indian/Asian people in South Africa had access to a flush or a chemical toilet in the 2001 Census, only 41.6% of Black African people did.
By contract, more than a third (36.2%) of Black Africans still had to use a pit latrine in 2001, compared to just under 55 of Coloured people, 1% of Indian/Asian peo- ple and 0.4% of White people (Leibbrandt et al. 2006, 125).
had access to formal dwellings, 88.5% of Coloured peo- ple had access to formal dwellings (Leibbrandt et al.
2006, 115), while the rates amongst Indians/Asians and Whites were 96.6% and 97% respectively.
Access to land was hailed as a priority for the post- 1994 government. Millions of people were systemati- cally robbed of their land under the former colonial and Apartheid governments. Government’s target is to redis- tribute 30% of the total agricultural land between 2000 and 2015.
Progress in meeting this target has however been very slow, and as at 2005/06, only 1 486 399 of the sequen- tially targeted 13 563 000 hectares had in fact been redistributed (The Presidency 2006, 33).
2.5 Access to water
Access to water is a fundamental human right and is guar- anteed in section 27(1)(b) of the Constitution of South Africa. According to the South African Reconstruction and Development Programme, the standard of access to water was a minimum quantity of 25 litres of pota- ble water per person per day within 200 metres of a household, and a minimum flow of 10 litres per minute for communal water points. This is higher than the Millennium Development Goal standard of 20 litres per person per day within 1000 metres of a household.
Table 6: Number of households, and access to housing by household, various years between 1996 to 2005
Type and Number of Houses 1996 2001 2002 2003 2004 2005
Total number of households 9 059 606 11 205 705 11 479 000 12 0200 221 12 194 000 12 726 000 Total number of households in formal
dwellings
5 794 386 7 680 422 8 349 000 8 865 000 8 974 000 8 878 000
Total number of households in infor- mal dwellings
1 435 015 1 836 232 1 462 000 1 506 000 1 377 000 2 026 000
Total number of households in tradi- tional dwellings
1 812 205 1 689 051 1 668 000 1 649 221 1 843 000 1 822 000
Source: The Presidency 2006, 28
ANAL
2.7 Literacy and matric pass rates
Adult literacy is defined as the total number of people older than 20 who have had seven or more years of edu- cation. By 2005, total adult literacy in South Africa was 74.2%, with 72.1% of adult females being literate (The Presidency 2006, 45).
The matric pass rate in 2005 was 68.3% of those who write the exam. While this represents an increase from 58% in 1994, there has been a year on year decrease from the 73.2% pass rate of 2003 (The Presidency 2006, 43).
2.8 Health
2.8.1 Malnutrition
Malnutrition is a stark indicator of poverty and the ef- fects of infant malnutrition impacts the developmental ability of the child for the rest of his or her life.
The number of children under five presenting sever malnutrition has fallen according to statistics from the Presidency, from a total of 88 971 cases in 2001, to 30 082 cases in 2005 (The Presidency 2006, 35).
2.8.2 HIV/AIDS
The prevalence of infection to HIV and related oppor- tunistic diseases has crippled many communities in South Africa. The incidence of this prevalence has af- fected poor people and communities disproportionably.
According to Statistics South Africa data sources reported in the Presidency’s Mid-Term Development Indicators, HIV prevalence amongst the entire population progres- sively increased from 8.5% of the entire population in 2001, to 11.1% in 2007 (The Presidency 2006, 38).
The South African Institute for Race Relation’s figure of HIV prevalence for 2006 was 11.2% (South African Survey 2006/07 2007, 34).
The highest HIV prevalence per age and gender cohort was an alarming 20.45% infection rate amongst women aged 15 to 49 in 2007. The infection rate amongst adult women aged 20 to 64 was 18.1% in 2007, compared to a rate of 17.7% for men in the same age cohort. All of these rates have been increasing year on year (The Presidency 2006, 38).
According to the South African Survey 2006/07 brought out by the South Africa Institute for Race Relations Table 7: The number and rate of estimated AIDS deaths per province in 2006, ranked ordinaly from highest
Province Number Percentage of total AIDS deaths
KwaZulu Natal 113 082 32%
Gauteng 89 309 25%
Eastern Cape 39 987 11%
Mpumalanga 33 392 9%
North West 32 077 9%
Free State 27 207 8%
Western Cape 11 922 3%
Northern Cape 3 326 1%
Total 354 379 100%
Source: South African Survey 2006/07, 34
ANAL
(ASSA 2003), of a total population of 47 866 985 people in 2006, a total of 5 372 474 people were infected with HIV. Of the total number of deaths in the same year of 746 432, 354 379 or 47% of the total deaths were at- tributable to AIDS. In 2000, 147 525 out of a total of 524 638, or 28% of total deaths were due to AIDS.
Regionally, KwaZulu-Natal had the highest percentage of estimated AIDS deaths in 2006, while the Northern Cape had the lowest.
2.8.3 TB
Tuberculosis (TB) is one of the most fatal infectious dis- eases that infects people with compromised immune systems. Between 1994 and 2006, the prevalence of TB case notification had increased from 90 292 cases to 315 315 cases according to the Department of Health’s National TB Control Programme (The Presidency 2006, 39). The rate of successful treatment in 2005 was 69%, while the cure rate was 56%.
2.8.4 Malaria
Malaria has been hailed by government as being a sig- nificant health danger. In 2000, there were 64 622 re- ported cases, causing 458 reported deaths. By 2006, the total number of reported cases had fallen to 12 322, but the fatality rate had increased from 71% in 2000 to 845 in 2006 (The Presidency 2006, 40). Since 2000, South Africa, Swaziland and Mozambique have collaborated in a cross border treatment of malaria through the use of DDT (Dichloro-Diphenyl Trichloroethane).
2.9 Unemployment
Poverty in South Africa is inextricably linked to employ- ment both in regard to the existence of an income or not, and in regard to the value of that income (Department of Social Development 2002a, 139). If one examines the main sources of income for households, income from salaries and wages far exceeds that from any other
Table 8: Average household income by main income group and population group of household head
Source of income Black African Coloured Indian/Asian White Total1 Income from work
Salaries and wages 24 666 59 037 91 197 174 171 48 152
Self-employment and business 2 893 2 968 19 200 33701 7 300
Income from capital 201 670 944 4 870 865
Private pensions 386 1 056 1 559 9 152 1 590
State Old age Pensions 1 972 1 988 2 291 2 391 2 033
Disability Grant 863 1 369 1 030 308 834
Workmen’s Compensation 53 113 86 262 85
Income from individuals – alimony,
palimony etc 756 683 693 1 846 888
Other income from individuals 305 301 160 408 314
Other income, including benefits and gifts 1 518 2 995 2 326 15 735 3 477
Imputed rent on owned dwelling 2 272 7 080 14 243 34 525 7 081
Total average household income by
population group of head of household 37 711 79 423 134 543 280 780 74 589
Source: Statistics South Africa 2008, Table 3.3.
1 Unspecified totals have not been included in this table
ANAL
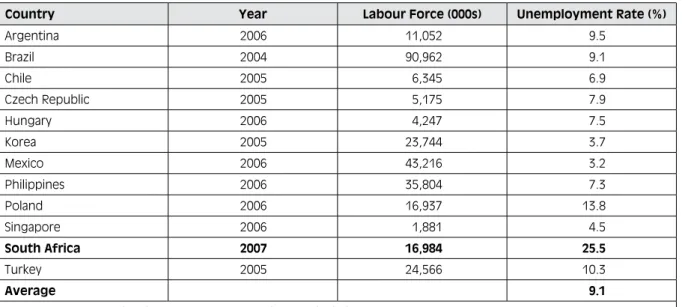
Table 9: International comparisons, labour force and unemployment rates
Country Year Labour Force (000s) Unemployment Rate (%)
Argentina 2006 11,052 9.5
Brazil 2004 90,962 9.1
Chile 2005 6,345 6.9
Czech Republic 2005 5,175 7.9
Hungary 2006 4,247 7.5
Korea 2005 23,744 3.7
Mexico 2006 43,216 3.2
Philippines 2006 35,804 7.3
Poland 2006 16,937 13.8
Singapore 2006 1,881 4.5
South Africa 2007 16,984 25.5
Turkey 2005 24,566 10.3
Average 9.1
Source: ILO 2007, National Treasury 2007c, 4 and own calculations
30 413 000. Of this number, 17 178 000 people were considered to be part of the active labour force, namely those that were either employed, or looking for jobs.
While the labour force participation rate for this period was 56.5%, the percentage of working age people withy jobs was 43.5% (Statistics South Africa 2007, v.).
Of this labour force, 13 234 000 people were not em- ployed. The total number of unemployed persons how- ever (including discouraged work seekers) was 7 370 000. The difference between the official definition of unemployment and discouraged work seekers is that to be officially unemployed a person must had no job in the 7 days prior to the interview, but have taken active steps to start a business or looked for a work in the pre- vious four weeks and be available to start a job in the next to weeks should one be available.
The official rate of unemployment for this period was 23%, while the broader definition was 43%. These fig- ures are remarkably high even for a developing country.
The following table provides a comparative overview of unemployment rates in developing and transitional economies recently undertaken by the International Labour Organization (ILO).
source. The following table sets out the various sources of income broken down by population group for 2005.
The average income for a Black African household is thus just 13% of the total average income for a White household. Workerless households with no grant recipi- ents are in extremely precarious situations. Similarly the death of an old age pensioner can see a household mov- ing from poverty into dire destitution (Department of Social Development 2002a, 151 and 153).
Income from wages and self-employment clearly con- stitutes the largest single source of income into house- holds across all population groups. Accordingly, in order to better understand levels of well-being or destitution, it is important to understand levels of employment and unemployment, as well as levels of wages that accrue to workers.
2.9.1 Number of unemployed people in South Africa
According to the September 2007 Labour Force Survey conducted by Statistics South Africa, the total number of working age people in September 2007 was
ANAL
The number of unemployed people fell from 4 391 000 people in September 2006 to 3 945 000 people in September 2007; however, over the same pe- riod the number of discouraged work seekers grew from 3 217 000 to 3 425 000, which suggests that just under half of the number of people who were no longer offi- cially unemployed in September 2007 must have joined the ranks of discouraged work seekers (Statistics South Africa 2007, iv).
2.9.2 Length of unemployment
Statistics on the length of time that people spend seek- ing jobs, whether these be first jobs or subsequent ones, suggest starkly why unemployed poor people end up becoming discouraged work seekers.
Of the total number of the 3 945 000 officially unem- ployed (i.e. excluding officially discouraged work seek- ers) in 2005, 55%, or 2 170 000 people had never worked before (Statistics South Africa 2008, Table 5.2) This rate rose significantly for the youth (between the ages of 15 and 30 years). Sixty three percent of this age group were unemployed, and of these, 66% (1 641 000) people had never worked before (ibid.).
Finally, of the total number of unemployed people in this survey, more than one quarter (26%) of people had been looking for work for a period of longer than 3 years.
2.9.3 The face of unemployment
Unemployment is most severe amongst the youth, and black African youth in particular. Of the total number of officially unemployed people in the Income and Expenditure Survey 2005/06, people in the age groups of 15 to 34 constituted 74% (or 2 932 000) of the total (Statistics South Africa 2008, Table 5.1). Of the total of 3 945 000 officially unemployed, 3 461 000 or 88%
were Black African people. 2 593 000 Black African youth between the ages of 15 and 34 were unem- ployed.
According to a report for the Taylor Committee (Depar- tment of Social Development 2002a, 166), there is cur-
rently little interplay between active labour market po- lices (enabling people to find work) and social security policies for three reasons.
Firstly, the number of unemployed relative to the number of employed people is too high. Secondly, there are not sufficient job opportunities to justify withholding ben- efits from people not actively seeking work. The third reason is that South Africa does not currently have the administrative capacity to administer and manage such a system (Department of Social Development 2002a, 166). As the third section of this report will cover, ac- tive job search assistance is one of the proposals being considered as part of social security reforms to address this lack of potential benefit multiplier effect.
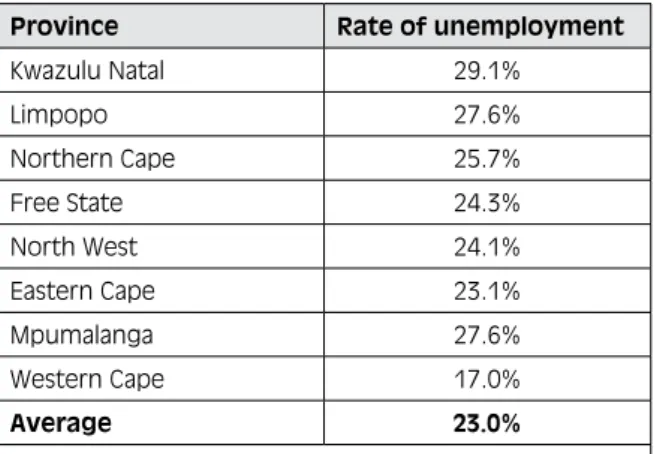
2.9.4 Provincial overview
Unemployment is highest in KwaZulu Natal, and low- est in the Western Cape. The following table ranks the provinces in accordance with their rates of unemploy- ment, from highest to lowest.
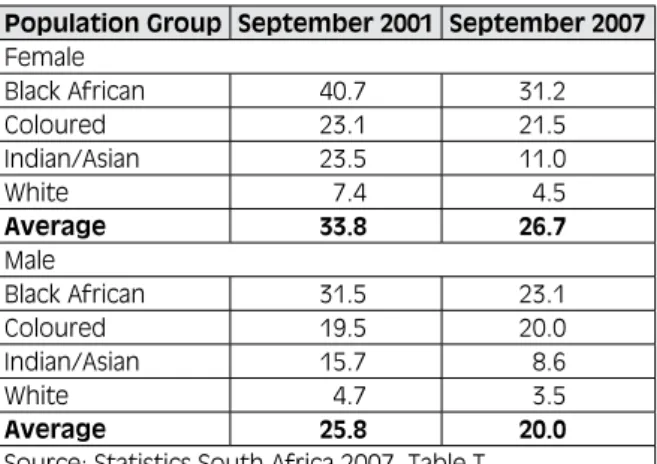
Every two out of three (64%) of discouraged work seek- ers in September 2007 was female, and the percentage of discouraged working-age persons was highest in the 20-24 year age range.
Table 10: Official unemployment rate as percen- tiles by population group and sex, September 2001 and September 2007
Population Group September 2001 September 2007 Female
Black African 40.7 31.2
Coloured 23.1 21.5
Indian/Asian 23.5 11.0
White 7.4 4.5
Average 33.8 26.7
Male
Black African 31.5 23.1
Coloured 19.5 20.0
Indian/Asian 15.7 8.6
White 4.7 3.5
Average 25.8 20.0
Source: Statistics South Africa 2007, Table T
ANAL
2.9.5 Are jobs decent jobs?
Proxy indicators for whether jobs qualify as being de- cent work (whether in the formal or informal economy) include salaries/wages, as well as indicators such as whether the job is permanent or casual, whether the employer pays contributions to social insurance, pro- vides written contracts etc.
2.9.6 Formal/informal sector jobs
The figure for total employment includes both formal and informal sector jobs. In September 2007, formal sector jobs (excluding agriculture) accounted for two thirds or 66.4% of all jobs, while 16.0% of jobs were in the informal sector with a further 16.8% of total jobs be- ing made up from agricultural jobs and domestic work (Statistics South Africa 2007, Table K).
According to Report Five of the Taylor Committee, the absence of decent jobs forces many millions of poor people into adopting survivalist activities, working in poor conditions for long hours for very little income (Department of Social Development 2002a, 157). But formal sector employment does not provide a guaran-
tee of decent work. For both formal and informal sector jobs, the majority of people tend to work for very little pay.
2.10 Salaries/wages
Seventy-six percent of all employees in both the formal and informal economies earn R2 500 per month or less.
Ninety-five percent of workers in the informal economy and ninety-nine percent of domestic workers earn less than R2 500 per month.
A staggering sixty-six percent of workers in the formal economy however also earn less than R2 500 per month (Statistics South Africa 2007, Table 3.5).
2.11 Conditions of employment
Out of a total workforce of 10 902 000 workers in September 20072, 7 706 000 (71%) considered them- selves to be permanent employees, 13% were tempo- rary staff, 9% considered themselves to be casual em- ployees, 6 % on a fixed term contract and 1% seasonal workers. Seventy-four percent (74%) of this workforce had a written contract of employment (Statistics South Africa 2007, Table 4.1.1).
Fifty-four percent (54%) of the total workforce of 13 234 000 (including employers, self employed and those working for no pay) contributed to the unemploy- ment Insurance Fund (Statistics South Africa 2007, Table 3.15).
70% of workers had no medical aid coverage (Statistics South Africa 2007, Table 4.1.5), compared with 64% of formal sector workers who had no provision for medical aid or a health insurance fund (Statistics South Africa 2007, Table 3.12.1), and 97% of informal sector work- ers made no contribution to medical aid or insurance of any kind (Statistics South Africa 2007, Table 3.12.2).
Table 11: Rates of unemployment per province in September 2007
Province Rate of unemployment
Kwazulu Natal 29.1%
Limpopo 27.6%
Northern Cape 25.7%
Free State 24.3%
North West 24.1%
Eastern Cape 23.1%
Mpumalanga 27.6%
Western Cape 17.0%
Average 23.0%
Source: Statistics South Africa 2007, Table S
2 This excludes employers, the self-employed and those working without pay.
ANAL 2.12 Concluding remarks
Given the high levels of un- and under-employment, lev- els of poverty whilst alarmingly high, cannot be surpris- ing. The depth of poverty in South Africa is further ag- gravated by the highly unequal distribution of resources, including the distribution of income.
There are many domains of poverty. In the absence of an official South African definition and measurements of poverty this report focused on the following domains;
life expectancy, access to housing, access to water, sani- tation, levels of literacy and certain aspects of infectious diseases including HIV/AIDS prevalence.
Whilst some of these indicators suggest welcome im- provements in terms of access, it is clear that there are still millions of poor people who are exceedingly vulnerable and at risk. In the absence of other safety nets, access to social security can mean the difference between poverty and destitution for many people and households. The weave of the safety security net how- ever as we shall see in the next section is still too loose, allowing too many vulnerable people to fall through.