This content has been downloaded from IOPscience. Please scroll down to see the full text.
Download details:
IP Address: 98.206.160.128
This content was downloaded on 14/02/2017 at 14:10 Please note that terms and conditions apply.
Characteristics of Kelvin waves and Mixed Rossby-Gravity waves in opposite QBO phases
View the table of contents for this issue, or go to the journal homepage for more 2017 IOP Conf. Ser.: Earth Environ. Sci. 54 012032
(http://iopscience.iop.org/1755-1315/54/1/012032)
You may also be interested in:
Impact of ENSO on seasonal variations of Kelvin Waves and mixed Rossby-Gravity Waves Saeful Rakhman, Sandro W Lubis and Sonni Setiawan
Effects of stratospheric variability on El Niño teleconnections J H Richter, C Deser and L Sun
Meteorology: The outlook looks good for weather forecasters Edwin Cartlidge
The relative impacts of El Niño Modoki, canonical El Niño, and QBO on tropical ozone changes since the 1980s
Fei Xie, Jianping Li, Wenshou Tian et al.
Seasonal forecasts of northern hemisphere winter 2009/10 D R Fereday, A Maidens, A Arribas et al.
Low solar activity is blamed for winter chill over Europe Rasmus E Benestad
The physics and dynamics of the stratosphere and mesosphere R J Murgatroyd
Turbulent cascade of Kelvin waves on vortex filaments Andrew W Baggaley and Carlo F Barenghi
Climate science in the tropics: waves, vortices and PDEs Boualem Khouider, Andrew J Majda and Samuel N Stechmann
Characteristics of Kelvin waves and Mixed Rossby-Gravity waves in opposite QBO phases
Nur Zaman Fathullah1*, Sandro W. Lubis2 and Sonni Setiawan1
1 Department of Geophysics and Meteorology, Bogor Agricultural University (IPB), Indonesia
2 Physics of the Atmoshpere, GEOMAR Helmholtz Centre for Ocean Research Kiel, Germany
E-mail: zamanchaniago@gmail.com
Abstract. A 35-year ERA-Interim dataset from the European Center for Medium-Range Weather Forecasts (ECMWF) was used to study the characteristics of Kelvin waves and Mixed Rossby-gravity waves based on a Space-Time Spectral Analysis (STSA). The results show that Kelvin wave activity is stronger during easterly QBO phases, while Mixed Rossby-gravity waves are stronger during westerly QBO phases. Analysis on seasonal variations indicates that the Kelvin waves and Mixed Rossby-Gravity wave activities increase in JJA and SON, respectively. This is associated with a variation of basic mean flow in the lower stratosphere. In addition, the variations of Kelvin and Mixed Rossby-Gravity waves in the troposphere are not significantly affected by the QBO phases. In the troposphere, both Kelvin waves and Mixed Rossby-Gravity waves propagate with a lower phase speed compared to those observed in the stratosphere. This behavior is to be likely due to large.
1. Introduction
Equatorial Planetary Waves (EPWs) is an important class of tropical atmospheric disturbances. EPWs are generated by diabatic heating due to organized tropical large-scale convective heating in the equatorial belt, where their signatures are clearly evident between 20° N and 20° S [1]. Two examples of prominent EPWs are Kelvin waves and Mixed Rossby-Gravity (MRG) waves. These waves are generated in the troposphere by large-scale convective system in the equator [2]. Kelvin waves have a period of approximately 12 to 20 days, and propagate eastward with a vertical wavelength of about 6 - 10 km. On the other hand, MRG waves have a period of about 4 to 5 days, and propagate westward with a vertical wavelength of about 4 - 8 km [2]. These waves play pivotal role in controlling disturbances in the equatorial stratospheric (e.g., QBO) and tropospheric circulation and precipitation [3, 4].
The quasi-biennial oscillation (QBO) is the primary mode of variability of the equatorial mean wind in the stratosphere (~16-50 km), which is characterized by downward propagating easterly and westerly wind regimes, with a variable period averaging approximately 28 months [5]. The maximum amplitude is observed in the middle and lower tropical stratosphere, with the easterly phase having larger amplitudes compared to the westerly phase. The twofold-structure of QBO descends downward at rate of ~1 km/month. QBO is forced by the interaction of long-period vertically propagating tropical atmospheric waves (e.g., inertia gravity waves, Kelvin waves and mixed Rossby-gravity waves) with the zonal mean flow [1].
The focus of this study is to examine the characteristics of Kelvin and MRG waves in different QBO phases, including their horizontal structures in the stratosphere and troposphere, by using the Space-Time Spectral Analysis (STSA) technique. Since the Kelvin waves and MRG waves effectively modulate the temperature anomalies in the tropics [2, 3], we therefore used temperature fields as a proxy to isolate the Kelvin wave and MRG wave activities.
2. Methods
We used both daily and monthly averaged temperature, zonal wind, and sea surface temperature datasets obtained from the ERA-Interim reanalysis from January 1979 to December 2013 (35 years).
Our study focused on the latitudinal bands between 20° N - 20° S (with a spatial resolution 2.5°x 2.5°) and altitudes between 100 hPa and 1 hPa. In addition, we also used outgoing long wave radiation (OLR) from NOAA with the same spatial and temporal resolutions.
2.1. Composite Analysis
Composite analysis is used to determine the distribution of atmospheric basic state at the same conditions. In this study, analysis of composites is used to analyze the variations of zonal mean wind in the stratosphere in opposite QBO phases.
2.2. Space-Time Spectral Analysis (STSA)
STSA is used to analyze the propagation properties of atmospheric disturbances in the zonal direction.
This method decomposes the anomalous field in space and time as a function of wavenumber (k) and frequency (ω) [6]. A brief formulation can be expressed as follow:
( ) ∑ ( )
( ) ∑ ( ) ( )
( ) ∑ ∑ ( )
The sign (-) and (+) correspond to retrogressive and progressive components refer to eastward and westward mowing waves. Wk±ω and φk±ω are amplitude and phase angle of progressive and retrogressive waves with various wavenumber and frequency. The decomposition is conducted based on 2D Fourier transformation (in space and time domains). STSA procedure was performed with NCAR Command Language (NCL). The output is the power spectrum atmospheric disturbances as a function of frequency and zonal in the symmetric and asymmetric components.
3. Results
3.1. Equatorial QBO Profile
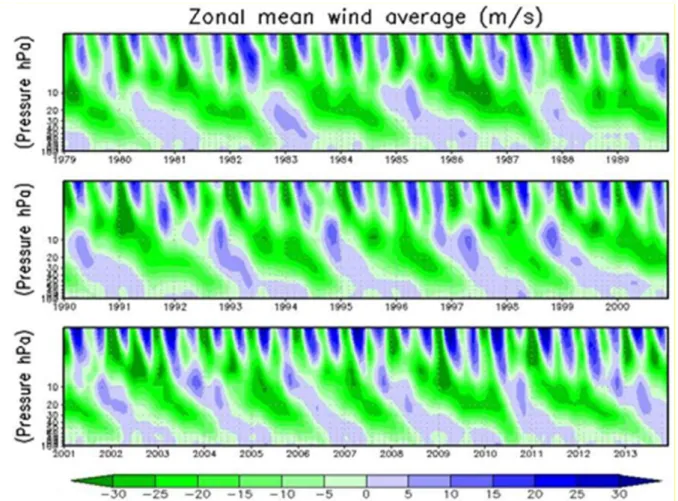
Figure 1 shows a time-height section of monthly mean zonal mean wind as a function of height (100 to 1 hPa) and time. We show that the signature of QBO charactherized by a reversal of the westerly to easterly wind in time is dominant in the lower-stratosphere at ~100 - 5 hPa (~16 - 35 km). Above 5 hPa (> 35 km), Semiannual Oscillation (SAO) dominates the variability of the tropical zonal wind.
The oscillation peaks around the stratopause with amplitudes of around 45 m/s in the zonal wind speed. In general, the magnitude of easterly phase of QBO is stronger than the magnitude of westerly phase of QBO. The signature of QBO is not visible below 100 hPa and above a height of 5 hPa. Below 100 hPa, the amplitude of QBO decays as a result of fewer waves breaking that drives such oscillation, whereas above 1 hPa the oscillation was strongly influenced by the SAO in upper stratosphere [7].
(1) (2) (3)
2
Figure 1. Monthly mean zonal mean wind between 100 and 1 hPa from 1979 to 2013 obtained from ERA-Interim dataset. Blue (green) color indicates easterly (westerly) wind.
3.2. Definition of QBO Phases
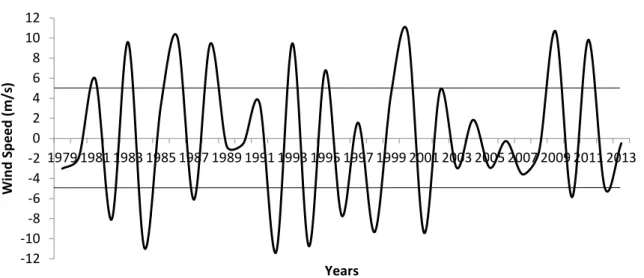
Different studies use different definitions for the QBO. Baldwin and Dunkerton [8] defined the QBO index as a zonal mean wind averaged over 40 hPa and between 5°N to 5°S. Gray [9] used QBO index as a zonal mean wind averaged at 44 hPa, while Yamashita [10] used QBO index as zonal wind oscillation averaged at 50 hPa between 10°N and 10°S. In this study, we used a similar definition of QBO as in Yamashita [10]. We define a QBO time series as the zonal mean zonal wind averaged between 10°N and 10°S at 50 hPa. We label a time step as QBO west phase (QBOW) when the average exceeds 5 m/s and QBO east phase (QBOE) when it falls below -5 m/s (figure 2). Using this definition, we obtained in total 9 years for each QBO phase. In particular, the WQBO occurred in 1981, 1983, 1986, 1988, 1993, 1995, 2000, 2009, 2011 and the EQBO occurred in 1982, 1984, 1987, 1992, 1994, 1996, 1998, 2001, 2010.
Figure 2. Time series of zonal mean zonal wind averaged between 10°N and 10°S at 50 hPa for 35 years (1979-2013).
3.3. STSA of stratospheric temperature field
As we mentioned earlier, the STSA technique is used to analyze the signals of planetary scale equatorial wave based on 2D Fast Fourier Transformation (FFT) into wave activity (spectrum) as a function of wavenumber and frequency. We used daily temperature anomalies by removing seasonal climatology in the data. To avoid any aliasing in the data, the linear trend has been removed by using linear regression curve fit. The results of the analysis in principle indicate the wave activity as a function of their propagation structure (symmetric and asymmetric component).
Figure 3. (a) Symmetric component of STSA temperature for EQBO at 50 hPa and (b) asymmetric component of STSA temperature for WQBO at 50 hPa for (left to the right) DJF, MAM, JJA, and SON.
Figure 3 shows a symmetric (asymmetric) component of STSA temperature for EQBO (WQBO) composite. In general, we can see that Kelvin waves (symmetric component) are stronger during the
-12 -10 -8 -6 -4 -2 0 2 4 6 8 10 12
1979 1981 1983 1985 1987 1989 1991 1993 1995 1997 1999 2001 2003 2005 2007 2009 2011 2013
Wind Speed (m/s)
Years
4
easterly phase of the QBO with a frequency of 0.063 to 0.313 cycles/day (3-16 days) and the zonal wavenumber 1 to 6, whereas MRG waves (asymmetric component) are stronger during the westerly phase of the QBO with a frequency of 0.188 to 0.313 cycles/day (3-5 days) and the zonal wavenumber -1 to -7. These results are consistent with propagation theory and the zonal wind distribution [11, 12], that in the easterly phase year (easterly basic flow) there will be more eastward-moving Kelvin waves propagating upward into the lower stratosphere and in the westerly phase year (westerly basic flow) there will be more westward-moving waves propagating upward. We also note that there is a seasonal change in the magnitude of the power spectrum of tropical wave for EQBO and WQBO, indicating that Kelvin waves and MRG wave activities are varied in season for different phase of the QBO. We thus proceed to examine this behavior in the following section.
3.4. Seasonal variation of Kelvin waves and MRG waves
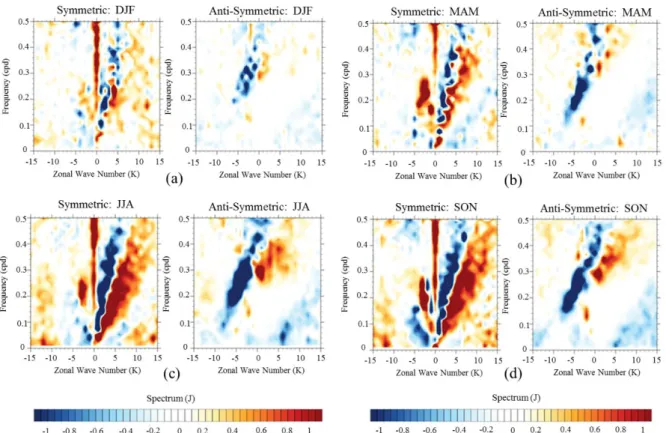
Figure 4 shows differences in wave power spectrum between EQBO and WQBO for both symmetric and asymmetric components in each season. The positive values in symmetric component indicates that Kelvin waves are stronger in EQBO than in QBO, on the other way around the negative values in asymmetric component means the MRG waves are stronger in WQBO than in EQBO.
Figure 4. Differences in wave power spectrum between EQBO and WQBO for (a) DJF, (b) MAM, (c) JJA, and (d) SON at 50 hPa.
The results show that there are prominent differences in wave power spectrum in JJA and SON for both symmetric and asymmetric components at 50 hPa. In particular, positive spectrum anomalies in symmetric component are observed in JJA and SON for zonal wavenumber 1 to 10. This indicates that Kelvin wave activity is strongly observed in JJA and SON during EQBO. On the other hand, we also see that there is large negative value of wave spectrum in the asymmetric component for the same season. This indicates that MRG wave activity is enhanced in JJA and SON during WQBO.
3.5. Mechanisms for changes in the seasonality of Kelvin waves and MRG waves
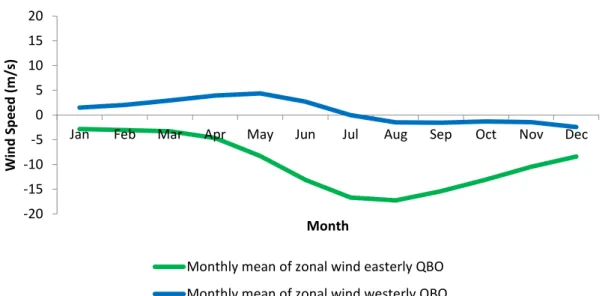
To understand what causes increased Kelvin wave and MRG wave activities during particular season, we first analyze the zonal mean wind profile at 50 hPa for both EQBO and WQBO (figure 5). We show that enhanced Kelvin wave activity in JJA and SON during EQBO is consistent with the basic- state flow in the stratosphere. In particular, the basic mean flow in the stratosphere during this season is strongly easterly. Thus, this provides a favorable condition for more upward propagating Kelvin waves to the stratosphere. This is consistent with a upward propagating wave theory associated with the QBO from Plumb [12], showing that easterlies basic-state flow strengthens the Kelvin wave activity and allows these waves to propagate and penetrate at a higher level in the stratosphere.
Increased MRG wave activity in JJA and SON during WQBO is also consistent with the zonal mean flow in the stratosphere. In particular, in JJA the zonal mean flow is strongly easterly during EQBO, while during the WQBO the zonal mean flow is westerly. The easterlies prevent upward propagation of MRG wave to the mid/upper stratosphere, resulting weaker MRG wave activity in JJA during EQBO. Likewise, in SON the zonal mean flow during WQBO is more favorable for upward propagating MRG waves.
Figure 5. Zonal mean wind profile at 50 hPa during WQBO (blue) and EQBO (green).
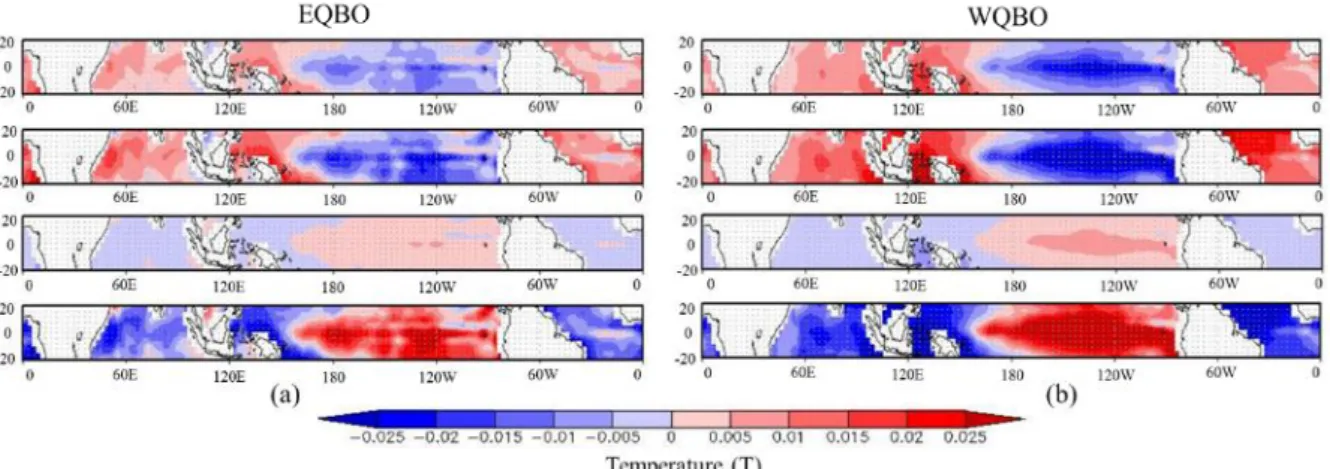
Another possible mechanism leading to increased upward Kelvin waves and MRG waves in opposite QBO phase is the variation in lower tropospheric wave forcing. To investigate this, we composite sea surface temperature (SST) anomalies over the tropics for WQBO and EQBO phase as shown in Fig. 6. Positive sea surface temperature anomalies are indicated by red shading, while blue shading indicates the negative values. We see that there is increased SST variation over the tropical eastern Pacific in JJA and SON during both EQBO and WQBO phases. Increased SST leads to more evaporation and thus formation of convective clouds. This tropospheric forcing may cause an increased upward propagating Kelvin waves and MRG waves in the lower stratosphere.
These results confirm a previous study conducted by Yang [11], showing a possible influence of area of warm pool in the eastern Pacific on the upward propagation of Kelvin waves and MRG waves in the lower stratosphere during QBO event. Further studies are required to understand this mechanism in more detail.
-20 -15 -10 -5 0 5 10 15 20
Jan Feb Mar Apr May Jun Jul Aug Sep Oct Nov Dec
Wind Speed (m/s)
Month
Monthly mean of zonal wind easterly QBO Monthly mean of zonal wind westerly QBO
6
Figure 6. Composite of SST in (top to bottom) DJF, MAM, JJA, and SON for (a) WQBO and (b) EQBO.
3.6. Impact of QBO on Kelvin waves and MRG waves in the troposphere
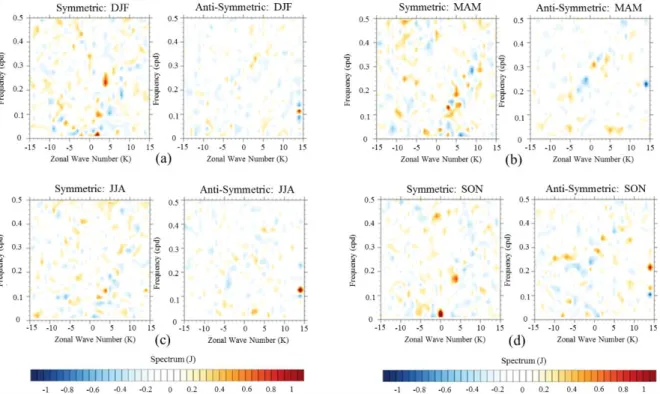
To investigate if the opposite QBO phase has an implication for Kelvin wave and MRG wave activities in the troposphere, we repeat the STSA diagnostic for analyzing tropical wave in the troposphere that is coupled with convection. We used outgoing longwave radiation (OLR) as a proxy of convectively coupled equatorial wave (CCEWs) as in Lubis and Jacobi [4].
Figure 7. (a) Symmetric component of STSA OLR for EQBO and (b) asymmetric component of STSA OLR for WQBO in (left to the right) DJF, MAM, JJA, and SON.
Figure 7 shows seasonal variation of wave spectrum diagram obtained from OLR data. In general, the phase speed of Kelvin and MRG waves in troposphere is lower than in the stratosphere, because they are coupled with the convection [4]. General characteristics of the Kelvin wave in the troposphere have a frequency of approximately 0.0625 to 0.4375 cycles per day (a period of about 2 – 16 days) and zonal wavenumber approximately 1 - 15. On the other hand, MRG wave in the troposphere have a
frequency of approximately 0.1875 to 0.3125 cycles per day (a period of about 3 - 5) and zonal wavenumber approximately -1 - (-5).
To understand if the seasonal variation of Kelvin wave and MRG wave activities in the troposphere is affected by different QBO phases, we calculated the differences (EQBO-WQBO) in wave spectrum diagram for both symmetric and asymmetric components (Fig. 8). We can see that there is no pronounced difference in the wave spectrum for both components. The results indicate that seasonal variation in Kelvin waves and MRG waves is not significantly influence by the QBO.
Figure 8. Differences in wave power spectrum in OLR between EQBO and WQBO for (a) DJF, (b) MAM, (c) JJA, and (d) SON. (a) Symmetric component of STSA OLR for EQBO and (b) asymmetric component of STSA OLR for WQBO in (left to the right) DJF, MAM, JJA, and SON.
4. Summary
We have studied the characteristics of Kelvin waves and Mixed Rossby-gravity waves in opposite QBO phases using the ERA-Interim reanalysis dataset from 1979-2013. The wave properties were analyzed by using space-time spectral analysis (STSA). The key results of the current study are summarized as follow:
(1) Kelvin waves are stronger during the easterly phase of the QBO with a frequency of 0.063 to 0.313 cycles/day (3-16 days) and the zonal wavenumber 1 to 6, whereas MRG waves are stronger during the westerly phase of the QBO with a frequency of 0.188 to 0.313 cycles/day (3-5 days) and the zonal wavenumber -1 to -7.
(2) Seasonal variations of Kelvin waves are significantly influenced by the QBO phases. Kelvin waves are stronger in JJA and SON during EQBO, while the MRG waves are stronger in JJA and SON during WQBO. This variation is significantly controlled by the variation in zonal mean flow in the lower stratosphere.
(3) Seasonal variations of Kelvin waves and MRG waves in the troposphere are not significantly affected by the QBO variations, which are to be likely due to a weaker variation in basic mean flow.
8
We also showed that Kelvin waves and MRG waves in the troposphere have a lower phase speed than in the stratosphere, which is consistent with equatorial waves in the troposphere being coupled with large-scale convective processes that dampen the phase velocity of the waves. Further studies are required to understand variations of Kelvin and MRG waves during other tropical atmospheric phenomena such as MJO, SAO etc.
Acknowledgment
We thank ECMWF for providing the ERA-Interim reanalysis dataset. The authors are grateful to Givo Alsepan from the laboratory of the Physical Oceanography and Climate, Hokkaido University, Japan, for his helpful comments and discussion.
5. References
[1] Holton JR and Lindzen RS 1968 A note on Kelvin Waves in the atmosphere Monthly Weather Rev. 96 385-386
[2] Holton JR 2004 An Introduction to Dynamics Meteorology 4th Ed (Burlington: Elsevier)
[3] Setiawan S 2010 Perumusan Struktur Horizontal Gelombang Atmosfer Ekuatorial Departemen Geofisika Meteorologi IPB (Bogor: IPB)
[4] Lubis W S and Jacobi C 2015 The modulating influence of Convectively Coupled Equatorial Waves (CCEWs) on the variability of tropical precipitation. Int. J. Climatol.
[5] Baldwin MP 2001 The Quasi-biennial Oscillation Geophys. Rev. 39 179 – 229
[6] Wheeler M and Kiladis GN 1999 Convectively coupled equatorial waves: Analysis of clouds and temperature in the wavenumber-frequency domain J Atmos Sci. 56 374-39
[7] Pascoe C L 2005 The Quassi-biennial Oscillation: Analysis using ERA-40 data J. Geophys. Res.
110
[8] Baldwin MP and Dunkerton TJ 1998 Biennial, Quasi-biennial, and Decadal Oscillations of potential vorticity in the Northern Stratosphere J. Geophysics. 103 3919 – 3928
[9] Gray 2004 Solar and QBO influences on the timing of Stratospheric sudden warnings J. Atmos.
Sci. 61 2777 – 2796
[10] Yamashita 2011 Dynamical response in the Northern Hemisphere Midlatitude and High- Latitude Winter to the QBO simulated by CCSR/NIES CCM J. Geophysics. 116
[11] Yang 2011 Equatorial waves in opposite QBO phases J. Atmos. Sci. 68 839–862
[12] Plumb RA 1997 The interaction of two internal waves with the mean flow: Implications for the theory of the Quasi-Biennial Oscillation J. Atmos. Sci. 35 1827-1839
