Feed and fly
A model study about the relationship between coastal birds and intertidal food webs
Dissertation
Sabine Horn
�-��'V-��----� �)' .} J;- � II __
;,,,,.;,,...-� .._ :X: - �
- --=-�- =-= -�---�··-- -- -.
A model study about the relationship between coastal birds and intertidal food webs
Dissertation
zur Erlangung des Doktorgrades an der Mathematisch
Naturwissenschaftlichen Fakultät der Christian-Albrechts-Universität zu Kiel
Vorgelegt von
Sabine Horn
Angefertigt am Alfred-Wegener-lnstitut, Helmholtz-Zentrum für Polar- und Meeresforschung
Wattenmeerstation Sylt
Kiel, 2016
Cover photos
Flying oystercatchers: Robert Waleczek Curlew sandpipers: Anna Schareck
PD Dr. Harald Asmus (Erster Gutachter)
Alfred-Wegener-lnstitut, Helmholtz-Zentrum fur Polar- und Meeresforschung, List
Prof. Dr. Stefanie M. H. lsmar (Zweite Gutachterin)
GEOMAR, Helmholtz-Zentrum fur Ozeanforschung Kiel Prof. Dr. Mojib Latif (Vorsitz)
GEOMAR, Helmholtz-Zentrum fur Ozeanforschung Kiel Prof. Dr. Stefan Garthe
Forschungs- und Technologiezentrum Westkunste der Christian- Albrechts-Universitat zu Kiel
Verteidigt am: ?.-1- lf2. 20.16
1) o-uc~-e-vce__~vvr~ ~ ·. 2A. Ac.. 20.,(.£
Das Wattenmeer ist ein einzigartiger Lebensraum und von essentieller Bedeutung fur Millionen von Kustenvogeln, die das Wattenmeer als Hauptnahrungsquelle nutzen. Dennoch ist Beziehung zwischen nahrungssuchenden Vogeln und intertidalen Lebensraumen wenig untersucht und wurde in dieser Arbeit mit Hilfe der Okologischen Netzwerkanalyse naher betrachtet.
Zunachst wurde die Nahrungsnetzstruktur von sechs eulitoralen Habitaten (i.e.
Herzmuschelfeld, Schwertmuschelfeld, Schlickwatt, Miesmuschelbank, Sandwatt, Seegraswiese) analysiert und miteinander verglichen. Alie Habitate besitzen eine ausgeglichene Systemstruktur, was auf die Fahigkeit hindeutet, Belastungen standhalten zu konnen. Die Habitate unterscheiden sich jedoch in ihrem detaillierten Aufbau. Das Herzmuschelfeld und die Miesmuschelbank weisen eine sehr komplexe Flussstruktur, sowie eine starke Abhangigkeit von Phytoplankton-lmporten auf. Das Schwertmuschelfeld ist ein einfach aufgebautes System mit einem effizienten Energietransport. Das Schlickwatt ist aufgrund der einfachen und kurzen Energiekreislaufen und des geringen Recycling anfallig fur Storungen. Das Sandwatt und die Seegraswiese sind gepragt durch eine sehr komplexe und redundante Flussstruktur und ein hohes MaB an Recycling. Die Vielfalt unterschiedlicher Habitate im Wattenmeer scheint demnach von groBer Bedeutung zu sein, da jeder Lebensraum eine andere Rolle einnimmt und zur Funktion des gesamten Okosystems beitragt. AuBerdem werden die Habitate in unterschiedlicher lntensitat von nahrungssuchenden Vogeln genutzt.
Vogel sind ein wichtiger Bestandteil des Wattenmeer-Nahrungsnetzes. Aufgrund der vielfaltigen direkten und indirekten Verbindungen ziehen Veranderungen in der Vogelpopulation Folgen fur das gesamte Nahrungsnetz nach sich. Mit einer Abnahme in der Vogelpopulation verkurzen sich die Energietransportwege im Nahrungsnetz und die Energieflusse sind weniger divers und redundant. Vogel tragen somit maBgeblich zur Stabilisierung des Wattenmeer-Nahrungsnetzes bei. Holistische Studien wie diese konnen als Grundlage dienen, Bewertungsinstrumente fur die Beschreibung des okologischen Zustandes des Wattenmeer-Nahrungsnetzes zu entwickeln.
The Wadden Sea.is a unique coastal ecosystem and of outstanding importance for millions of coastal birds which use the intertidal area as a major food source. In this study the importance of habitat diversity and the influence of avian predators on the intertidal food web was determined using Ecological Network Analysis.
Similarities and differences of the food web structure were analyzed for six different intertidal habitats (i.e. cockle field, razor clam field, mud flat, mussel bank, sand flat, seagrass meadow). All systems were in a good trade-off between their degree of order and their redundancy implying a sustainable system structure and resistance in front of perturbations. But the habitats differed in their detailed features. The cockle field and the mussel bank were characterized by a complex and diverse flow structure while being simultaneously strongly dependent on external phytoplankton imports. Razor clam fields were revealed to be simple but very efficient systems. The studied mud flat appeared to be vulnerable to perturbations due to short and simple pathways and little recycling. The sand flat and the seagrass meadow showed a complex and redundant flow structure and a high recycling indicating independence and resistance. Habitat diversity appears to be an important trait for the Wadden Sea food web as each habitat has a distinct role in the whole ecosystem functioning. Furthermore, the diverse habitats are of great importance for foraging bird which might be specialized to one of the habitats.
Birds induce a large impact on the Wadden Sea food web. Due to their various direct and indirect influences, it is likely that changes in the bird population also cause changes in the whole system functioning. A decline in birds results in a decrease of pathway length and a less redundant and diverse flow structure. Birds therefore play an important role in stabilizing the intertidal food web.
The holistic approach of Ecological Network Analysis provides fundamental insight in the Wadden Sea food web structure. Results of this thesis are a useful basis to develop management tools and strategies for assessing the ecological state and the health of this unique ecosystem.
Contents
Zusammenfassung ...
9
Abstract...
11
General introduction ...
33
1. The Wadden Sea ... 33
1.1. General description... 33
1.2. Habitat diversity... 35
2. Birds in the Wadden Sea... 36
3. Management strategies ... 40
3.1. Impacts on the Wadden Sea... 40
3.2. Ecosystem-based management... 40
4. Ecological Network Analysis... 42
4.1. The theory of Ecological Network Analysis ... 42
4.2. ENA output ... 43
5. Focus of the thesis ... 44
5.1. Study site... 44
5.2. Objectives... 46
6. References ... 4 7
Chapter 1: The diversity of benthos and birds in intertidal habitats..53
1. Introduction... 55
Contents
2. Material and Methods... 55
2.1. Study site... 55
2.2. Sampling... 57
2.3. Data analysis... 58
3. Results and discussion ... 58
3.1. Primary producers... 58
3.1.1. Microphytobenthos ... 58
3.1.2. Macrophytes ... 60
3.2. Dominant species of the benthic community... 60
3.2.1. Cockle field ... 60
3.2.2. Razor clam field ... 61
3.2.3. Mud flat... 61
3.2.4. Mussel bank... 61
3.2.5. Sand flat ... 61
3.2.6. Seagrass meadow ... 62
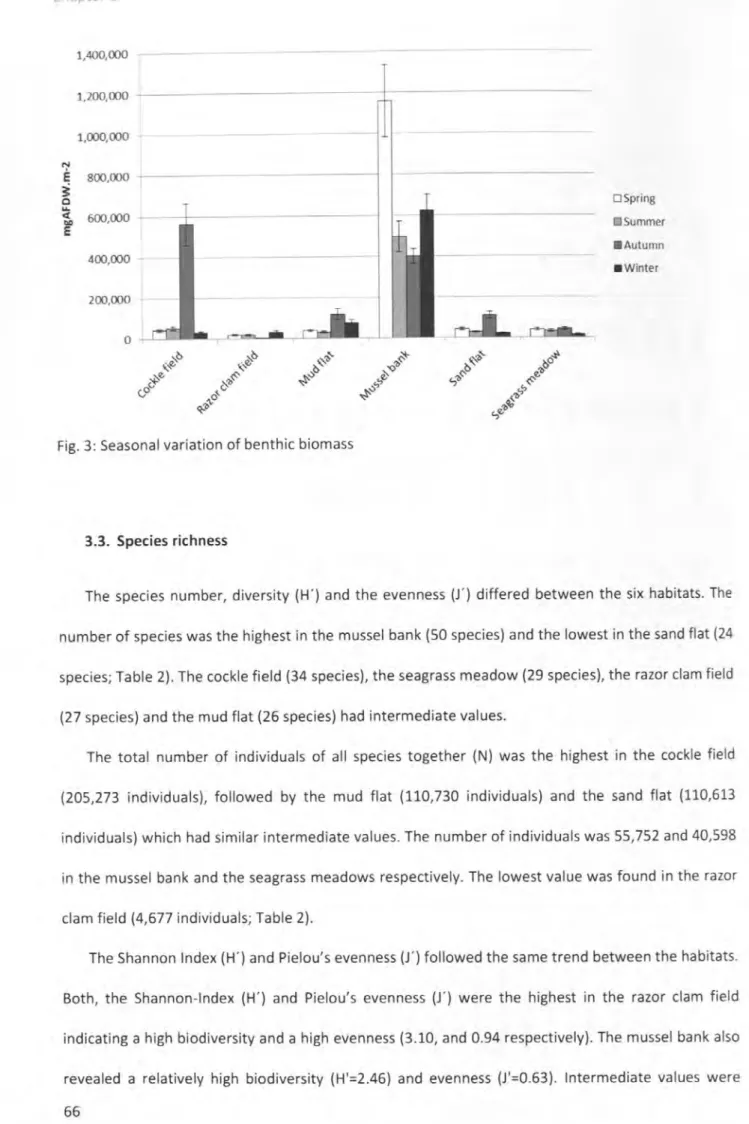
3.2.7. Seasonal variation of the benthic biomass... 62
3.3. Species richness ... 66
3.4. Birds ... 68
3.4.1. Cockle field ... 68
3.4.2. Razor clam field ... 68
3.4.3. Mud flat... 69
3.4.4. Mussel bank ... 69
3.4.S. Sand flat... 71
3.4.6. Seagrass meadow ... 71
14
3.4.7. Seasonal variation of bird abundances... 71
4. Conclusion ... 73
5. Acknowledgements ... 73
6. References... 74
Chapter 2: Relationships between fresh weight, dry weight, ash free dry weight, carbon and nitrogen content for selected vertebrates ...
81
1. Introduction ... 83
2. Material and Methods... 84
3. Results and discussion ... 88
3.1. Birds... 88
3.1.1. Relationships among biomass measures... 88
3.1.2. Homogeneity of replicates in bird individuals... 90
3.1.3. Conversion factors of bird species... 91
3.2. Seals... 93
3.2.1. Body composition... 93
3.2.2. Relationships among biomass measures in seal tissues... 93
3.2.3. Conversion factors of seal tissues... 94
3.2.4. Conversion factor for entire seals ... 96
3.3. Comparison with other taxa ... 98
4. Conclusion... 99
5. Acknowledgements ... 100
6. References... 101
Contents
Chapter 3: Diversity of intertidal food webs - functions and features...
109
1. Introduction... 111
2. Material and Methods... 113
2.1. Study site... 113
2.2. Sampling... 114
2.2.1. Macrobenthos ... 114
2.2.2. Microphytobenthos ... 114
2.2.3. Phytoplankton... 115
2.2.4. Birds ... 115
2.2.5. Additional data... 115
2.3. Network construction ... 116
2.4. Network analysis... 123
2.5. Uncertainty analysis... 125
3. Results... 126
3.1. Size and activity... 126
3.2. System structure... 127
3.3. Organization of flows ... 128
3.4. Recycling... 128
3.5. Trophic structure... 128
3.6. Uncertainty analysis... 130
4. Discussion ... 132
16 4.1. Similarities in system structure... 132
4.2. Mussel bank and cockle field: Similar roles but different features... 132
4.3. The razor clam field: Simple but efficient... 134
4.4. Mud flats show high variability... 135
4.5. Sand flat and seagrass meadow are bird hotspots ... 136
4.6. Birds in food web studies... 138
4.7. Comparison with previous studies... 139
5. Conclusion... 141
6. Acknowledgements... 141
7. References... 143
Chapter 4: Impact of birds on the intertidal food web - assessed with Ecological Network Analysis...
151
1. Introduction... 153
2. Material and Methods... 155
2.1. Study site... 155
2.2. Data base... 155
2.3. Network construction ... 156
2.4. Network analysis... 161
2.4.1. System attributes... 161
2.4.2. Lindeman spine... 163
2.4.3. Mixed trophic impact analysis... 163
2.4.4. Bird uncertainty analysis... 164
3. Results... 164
3.1. System description ... 164
3.1.1. Production and size... 164
Contents
3.2. Impact analysis... 167
3.3. Bird uncertainty analysis ... 169
4. Discussion... 170
4.1. System description... 170
4.2. Impact analysis... 171
4.3. Influence of birds on system attributes... 172
4.4. Birds in the Wadden Sea... 173
5. Conclusion... 174
6. Acknowledgements... 174
7. References ... 176
General discussion ...
183
1. The food web of the Wadden Sea ... 183
1.1. The influence of different habitat types on the whole ecosystem ... 183
1.2. Sustainability of the systems... 185
1.3. How healthy is the Wadden Sea food web?... 186
2. The importance of birds for the Wadden Sea food web... 189
2.1. Challenges to include birds in food web studies... 189
2.2. Habitat choice of foraging birds ... 190
2.3. The influence of birds on the intertidal food web... 192
3. Including ENA in ecosystem-based management... 193
3.1. Advantage of studies on ecosystem-level ... 193
3.2. ENA as a management tool ... 195
4. Conclusion ... 197
18
5. References ... 198
Appendix...
211
Acknowledgements ...
249
List of figures
General introduction
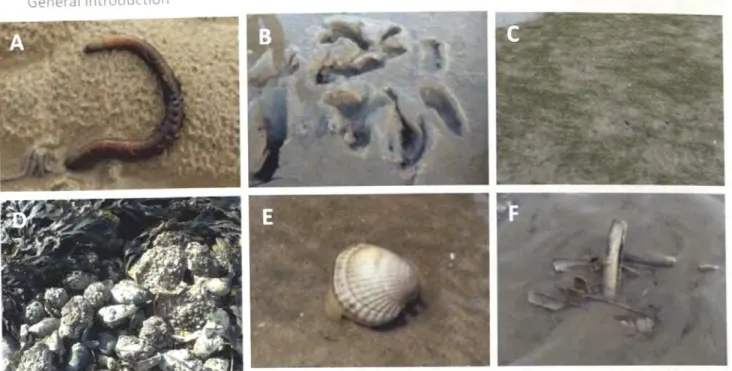
Fig. 1: Satellite picture of the Wadden Sea, source: www.waddensea-secretariat.org ... 34 Fig. 2: Different habitat types in the Wadden Sea; A) Sand flat dominated by Arenicola
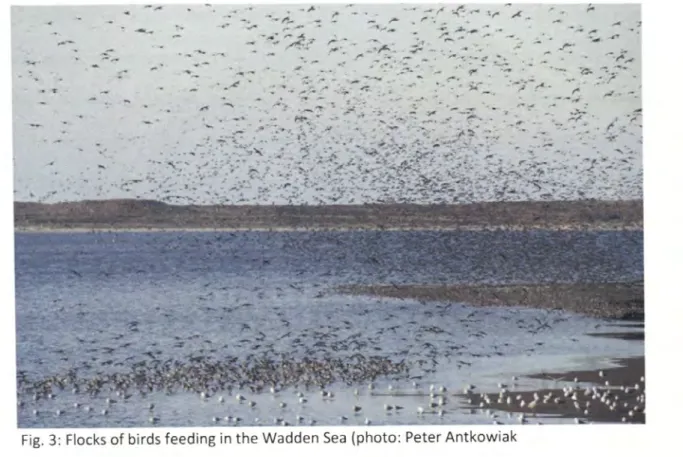
marina (Photo: Mike Kuschereitz}, B} Mud flat (photo: Sabine Horn}, C} Seagrass meadow (photo: Sabine Horn), D) Mussel bank characterized by Mytilus edulis and Crassostrea gigas (photo: Sabine Horn}, E) Cockle field dominated by Cerastoderma edule (photo: Mike Kuschereitz), F) Razor clam field dominated by Ensis directus (photo: Sabine Horn)... 36 Fig. 3: Flocks of birds feeding in the Wadden Sea (photo: Peter Antkowiak) ... 37 Fig. 4: Schematic illustration of the East Atlantic Flyway, the Wadden Sea (red dot) is like
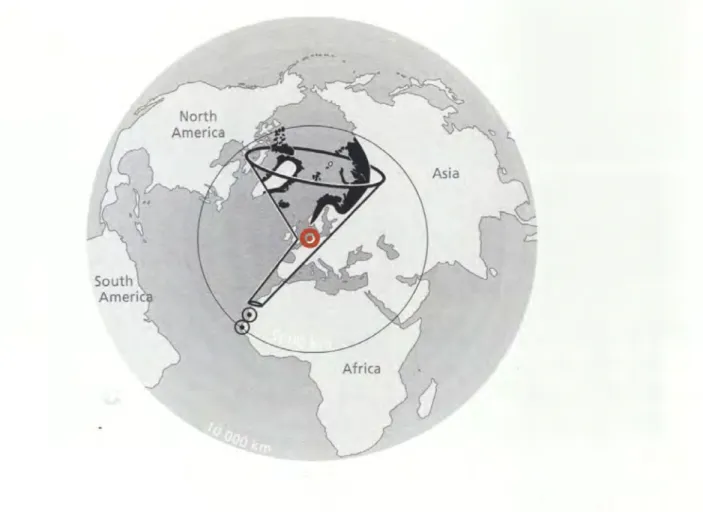
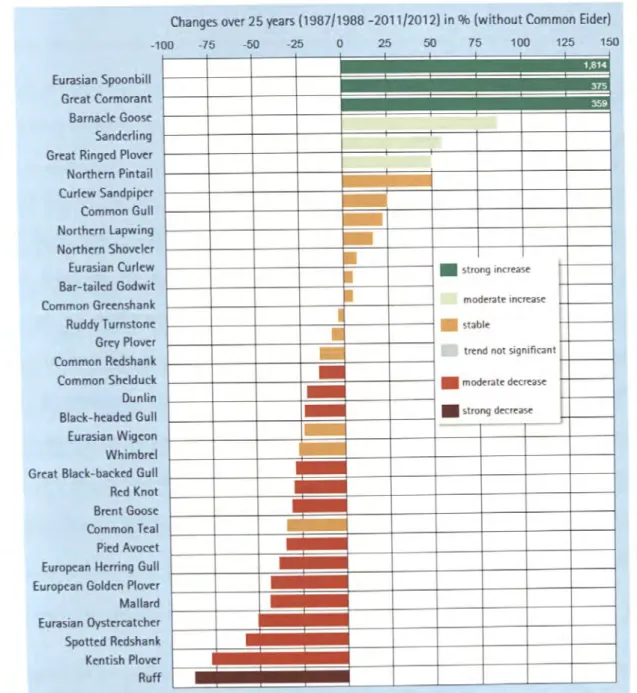
the neck of a funnel for birds coming from breeding grounds in North America and Eurasia and travelling down to Africa, source: van de Kam (2004} ... 38 Fig. 5: Long-term and short-term population trends for coastal birds in the Wadden Sea,
source: Blew et al. (2015) ... 39 Fig. 6: Four possible classes of energetic flows within a system between prey compartment
i and consumer compartment j: (1) exogenous inputs (e.g. solar radiation}, (2) intercompartmental exchanges, (3) exports of organic material (e.g. egestion), (4) energy dissipation (e.g. respiration)... 42 Fig. 7: Location and habitat distribution of the study site; the black frame delimits the
border of the studied area; l} Fohr, 2) Amrum, 3} Langeness, 4) Mainland coast, 5) Norderaue, 6) Suderaue; map changed after Brockmann Consult GmbH © 2014 (picture processing) and Landsat-8 USGS © 2014 (original data)... 45
Contents
Chapter 1: The diversity of benthos and birds in intertidal habitats
Fig. 1: Location of the study site. The black frame delimits the studied area. Sampling locations in the different habitat types are represented with black flags, map source:
Topographic GIS map 2003, issued by National Park Authority, Tanning ... 56 Fig. 2: Seasonal variation of microphytobenthic Chlorophyll a content in the six sampled
habitats ... ... 59 Fig. 3: Seasonal variation of benthic biomass... 66 Fig. 4: Seasonal variation of the abundance [lnd.m·2.h·1
1
of foraging birds... 72Chapter 2: Relationships between fresh weight, dry weight, ash free dry weight, carbon and nitrogen content for selected vertebrates
Fig. 1: Location and map of the study area. The circles and triangles refer to the locations where carcasses of birds and seals were respectively found ... 85 Fig. 2: Relationships between FW and DW, FW and AFDW, FW and CC, FW and NC for all
bird species combined. The regression equations are shown in Table 3 ... 88 Fig. 3: Relationships for between FW and DW, FW and AFDW, FW and CC, FW and NC for
Blubber-skin (A to D), Muscle (E to H), and Bone (I to L) of harbor seals. The regression equations are shown in Table 3 ... 95 Fig. 4: Relationships between FW and DW, FW and AFDW, FW and CC and FW and NC for
entire harbor seal individuals. The regression equations are shown in Table 3 ... 97
Chapter 3: Diversity of intertidal food webs - functions and features
Fig. 1: Lindeman spines of the six intertidal systems. Boxes represented the distinct trophic levels, percentage values refer to trophic efficiency between the levels. Arrows 22
indicated energy flows between trophic levels as well as im- and exports and backflows to the detritus pool. Dashed arrows show energy losses due to
. f V I . ·
c ·
2 d-1resp1ra ion. a ues are given in mg .m . . ... .
129
Fig. 2: Variation of the indices of each habitat with the initial model (red dot), the minimummodel (black framed square) and maximum model (black framed diamond)... 131
Chapter 4: Impact of birds on the intertidal food web - assessed with Ecological Network Analysis
Fig. 1: Lindeman spine of the studied intertidal system. Boxes represent the integer trophic levels, percentage values refer to trophic efficiency between the levels. Arrows indicate energy flows between trophic levels as well as import and exports and backflows to the detritus pool. Dashed arrows show energy losses due to
. . V I . . C ·2 d-1
resp1rat1on. a ues are given in mg .m . . ... .
167
Fig. 2: Mixed trophic impact of the birds as combined impacting compartments on thesystem ... 168 Fig. 3: Sensitivity of system attributes to changes in bird biomass...
169
General discussion
Fig. 1: Relationship between the degree of organization and the robustness of the analyzed systems, the dashed rectangle delimits the "window of vitality" ... 186
List of tables
Chapter 1: The diversity of benthos and birds in intertidal habitats
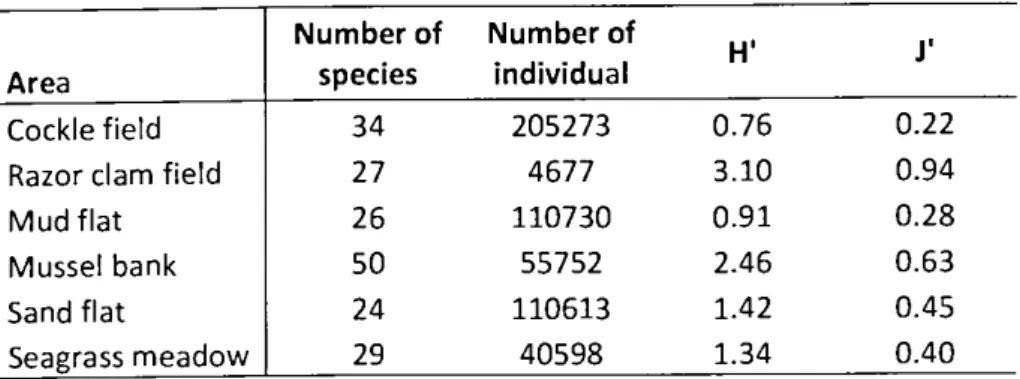
Table 1: Species list with mean values for abundance [Ind. m-2] and biomass in AFDW [mg
m-2] for all six habitats ... 63 Table 2: Results of the biodiversity analysis, H'=Shannon-lndex, J'=Pielou's evenness... 68 Table 3: Mean values of all bird counts in the six intertidal habitats with values for
abundance [lnd.m·2.h·1
1
and biomass in fresh weight [mg.m·2.h·1], biomass values were calculated using mean fresh weight values (Bezzel 1985, FTZ unpublished data) ... 70Chapter 2: Relationships between fresh weight, dry weight, ash free dry weight, carbon and nitrogen content for selected vertebrates
Table 1: Species, date of collection, total fresh weight of individuals, season and cause of death of the birds ... ... ... ... ... ... ... ... 86 Table 2: Seal ID, Date of collection, total fresh weight of individuals, age status, length and
gender of the three sampled harbor seals... 87 Table 3: Regression equations and R2 for relationships between FW and DW, FW and
AFDW, FW and CC, FW and NC for all bird species combined, for Blubber-skin, Muscle and Bone of seals, and for entire seals... 89 Table 4: DW/FW, AFDW/FW, CC/AFDW, CC/FW and NC/FW ratios for birds; mean per
individual± standard deviation (n=3) is shown for DW/FW and AFDW/FW ... 90 Table 5: DW/FW, AFDW/FW, CC/FW, CC/DW, CC/AFDW, NC/FW, NC/DW ratios (mean ±
standard deviation) for various bird, mammal, macrozoobenthos, and fish taxa.
Results from this study are displayed in bold... 92 Table 6: Fresh weight of each tissue (g) and contribution of each tissue to total fresh weight
Contents
(%) for the three sampled harbor seals... 94 Table 7: Mean and standard deviation of DW/FW, AFDW/FW, CC/FW and NC/FW ratios of
the different seal tissues... 96
Chapter 3: Diversity of intertidal food webs - functions and features
Table 1: Standing stocks in mgc.m·2 of the compartments for the six habitats, energy rations applied to calculate the energy budget of each compartment in mgc.m·2.d·1 and references of the energy ratios. B=Biomass, GPP=Gross primary production,
NPP=Net primary production, P=Production, R=Respiration, E=Egestion,
C=Consumption ... 118 Table 2: Diet matrix of the birds with references, numbers show the percentage
contribution of each prey compartment i to the diet of each bird (consumer compartment j) ... 121 Table 3: System attributes of the six intertidal systems ... 127
Chapter 4: Impact of birds on the intertidal food web - assessed with Ecological Network Analysis
Table 1: Input data for ENA; number of the compartments, compartment name, standing stocks represented by biomass in mgc.m·2, NPP= Net primary production, GPP=
Gross primary production, production, respiration, egestion and consumption of the particular compartment in mgc.m·2.d·1 and references for added biomass
values and for used energy budget ratios... 158 Table 2: List of analyzed system attributes. Name of the index, abbreviation used in the
text, unit of the index and description of the index... 161 Table 3: Compartment number(#), name of compartment and trophic position of the
26
Appendix App 1:
App 2:
App 3:
App 4:
App 5:
App 6:
App 7:
compartment determined by Lindeman Trophic Aggregation Analysis... 166
Energy flow table of the cockle field; biomass in mgc.m·2; production (P), consumption, respiration, egestion (E), imports, exports and flows in
mgc.m·2.d·1•...•....•.•...•....•...•...•...•..•.•...•..•...•..•..••...•.•...••.•. 211 Energy flow table of the razor clam field; biomass in mgC.m.2; production (P), consumption, respiration, egestion (E}, imports, exports and flows in
mgc.m·2.d·1•...•.•...•....•...•...•...•...•.•...•..•.•...•...•...•...•...•. 216 Energy flow table of the mud flat; biomass in mgc.m·2; production (P), consumption, respiration, egestion (E), imports, exports and flows in
mgc.m·2.d·1••••••..••••.••.••••••••.•••••••.••••••.••••••••...•••••••.•••••••••••••••..•••••••.••••••••••••.••••••••.•••..••••••••.•••••• 219 Energy flow table of the mussel bank; biomass in mgc.m·2; production (P}, consumption, respiration, egestion (E}, imports, exports and flows in
mgC.m 2.d-1 ...•....•...•...•...•...•...•...•...•. 223 Energy flow table of the sand flat; biomass in mgC.m.2; production (P), consumption, respiration, egestion (E}, imports, exports and flows in
mgc.m·2.d·1....•..•...••.•...•...•...•.•..•...•..•.••...•...•...•...•.•.•...•...•... 229 Energy flow table of the seagrass meadow; biomass in mgC.m.
2; production (P),
consumption, respiration, egestion (E}, imports, exports and flows in
mgc.m·2.d·1 ....•...•...•...•...•...•..•...•..•..•...•...•....•..•... 233 Energy flow table of the entire study site; biomass in mgC.m.
2; production (P},
consumption, respiration, egestion (E), imports, exports and flows in
mgc.m·2.d1... ... 238
begins with the first step
Lao-Tse
General introduction
1. The Wadden Sea
1.1. General description
The Wadden Sea (Fig. 1) is a unique ecosystem in the southeastern part of the North Sea, stretching along the coastline of Denmark, Germany and the Netherlands. From a geological point of view, the area is relatively young (Lozan et al. 1994). At the present place, it emerged about 6,000 years ago migrating in landward direction as the result of special geomorphological and hydrodynamic interactions (Lozan et al. 1994, Gatje and Reise 1998b). A line of barrier islands and sandbanks separates the Wadden Sea from the adjacent North Sea. The Wadden Sea and the North Sea are connected with each other by deep tidal channels branching in smaller inlets and creeks (Wolff 1983). Three large rivers discharge in the Wadden Sea (i.e. Ems, Weser and Elbe). Their inputs in freshwater in the coastal areas induce a gradual decline of salinity from the North Sea influenced areas (i.e. salty water) to the river-influenced areas (i.e. brackish water, Wolff 1983).
The Wadden Sea is increasingly impacted by human influences (Wolff et al. 2010, Kabat et al.
2012). Land reclamation and the building of dykes lead to a loss of habitat (Wolff et al. 2010).
Dredging and extraction of sand and shells to deepen shipping lanes or for land recreation is a severe perturbation of the benthic community (Smardon 2009, Wolff et al. 2010). The large rivers are permanent sources of pollution and nutrients which might cause eutrophication (Smardon 2009, Wolff et al. 2010). Fisheries for fish, shrimp and shellfish affects the populations of the fished species (Smardon 2009, Wolff et al. 2010) and the human-induced introduction of alien species alters the species composition in the Wadden Sea (Kabat et al. 2012). But also the changing climatic conditions influence the ecosystem continuously (Kabat et al. 2012).
However, the major force which forms the Wadden Sea is still the tidal change (Lozan et al.
1994). The area has a total size of about 9,300 km2 including islands, salt marshes, intertidal flats and tidal inlets (Lozan et al. 1994). About half of the area is exposed twice per day during low tide
General introduction
resulting in a large extent of intertidal flats, which characterize this unique ecosystem. The intertidal flats cover about 4, 700 km2• It is the largest coherent intertidal area worldwide and therefore one of the most valuable stretches of coastline (Reise et al. 2010, Wolff et al. 2010, Kabat et al. 2012). The extended intertidal flats have remained the most outstanding natural feature of the Wadden Sea (Wolff et al. 2010) and since 2014 the whole area has been proclaimed as a UNESCO World Heritage Site.
Fig. 1: Satellite picture of the Wadden Sea, source: http://www.waddensea-secretariat.org
34
1.2. Habitat diversity
At first sight, the vast intertidal flats appear to be bare, empty sediments, but the areas are highly productive (Beukema 1976, Asmus and Asmus 1985). Microalgae such as diatoms form thick layers on the sediment surface (Asmus and Bauerfeind 1994) and a rich benthic fauna inhabits the tidal flats supporting millions of coastal birds during their breeding period on their migration along the East Atlantic Flyway (Blew et al. 2015, Koffijberg et al. 2015). Interactions of physical forces turn the extensive intertidal flats into heterogeneous habitats, either characterized by differences in their sediment types or by their dominant species aggregation.
Sandy sediments cover most of the intertidal area (Lozan et al. 1994), often characterized by high abundances of Arenicola marina which is constantly reworking the sediment (Volkenborn et al. 2007,
Fig. 2 A). Muddy sediments only occur close to the shore where weak hydrodynamics allow the deposition of fine material (Lozan et al. 1994, Fig. 2 B). In sheltered areas, the sediment is often overgrown by dense seagrass meadows consisting of the two species Zostera noltei and Zostera marina (Fig. 2 C). In contrast to the worldwide trend, there is an expansion of seagrass meadows in the Wadden Sea since the 1990s (Dolch et al. 2013). Seagrass meadows are important shallow water
habitats providing shelter and nursery ground for a diversity of species (Dolch et al. 2013). In some parts of the intertidal area, specific bivalve species accumulate and dominate the species composition. Mussel banks, dominated by Mytilus edulis and the introduced species Crassostrea gigas, form solid epibenthic structures providing a habitat for species depending on a hard substrate
to settle (Fig. 2 D). On the other hand, cockle fields and razor clam fields are infaunal habitats, dominated by the common intertidal species Cerastoderma edule (Fig. 2 E) and the alien species Ensis directus (Fig. 2 F), respectively.
The heterogeneity of habitats is an important requirement for different macrobenthic species to settle as well as for higher predators such as birds that might be specialized to forage in a certain environment.
General introduction
Fig. 2: Different habitat types in the Wadden Sea; A) Sand flat dominated by Arenicola marina (Photo:
Mike Kuschereitz), B) Mud flat (photo: Sabine Horn), C) Seagrass meadow (photo: Sabine Horn), D) Mussel bank characterized by Mytilus edulis and Crassostrea gigas (photo: Sabine Horn), E) Cockle field dominated by Cerastoderma edule (photo: Mike Kuschereitz), F) Razor clam field characterized by Ensis directus (photo: Sabine Horn)
2. Birds in the Wadden Sea
The huge flocks of birds (Fig. 3) are one of the most prominent characteristics of the Wadden Sea (Wolff 1983). Considerable parts or even the total population of 50 different species of waders, gulls, ducks and geese depend on the Wadden Sea which is one of the most important breeding and migration sites (Wolff 1983, Kabat et al. 2012, Koffijberg et al. 2013, Blew et al. 2015, Koffijberg et al.
2015). About 10 to 12 million birds per year use this area to moult, breed and rear their chicks and to rest and refuel their fat reserves during their migration along the East Atlantic Flyway (Wolff et al.
2010, Koffijberg et al. 2015) (Fig. 4). Some of the bird species use the intertidal seagrass meadows and green algae mats as a major food source (e.g. Anos penelope, Branta bernicla}. But most of the
36
Fig. 3: Flocks of birds feeding in the Wadden Sea (photo: Peter Antkowiak
birds such as waders and gulls are strongly dependent on the benthic fauna inhabiting the tidal flats Birds can take up 25 to 45% of the standing stock of their prey items (Goss-Custard 1980) and are therefore one of the most important predators in the Wadden Sea. The distribution of birds on the tidal flats depnds on the food density and the distance between feeding and roosting area with a
preference for high densities and short distances (Wolff 1983).
Furthermore, birds are good bio-indicators to assess the status of an ecosystem (Markert et al.
2003). Birds occupy various positions in the food web especially in higher trophic levels. Chemical pollution or other contaminations in various compartments of the ecosystem would therefore be revealed in the health status of the bird population. In addition, birds have a long life-span and changes in the bird population generally reflect the status of the ecosystem over time (Markert et al.
2003).
General introduction
Fig. 4: Schematic illustration of the East Atlantic Flyway, the Wadden Sea (red dot) is like the neck of a funnel for birds coming from breeding grounds in North America and Eurasia and travelling down to Africa, source: van de Kam (2004)
In the Wadden Sea, birds are therefore highly protected under several comprehensive regulations and conventions (e.g. EU Bird Directive, Bonn Convention and the Bern Convention, Mendel 2008). Most of these management plans are based on species abundance data which is determined in several counting programs such as ship-based and aerial transect counts, flock surveys and the waterfowl census (Mendel 2008, Markones and Garthe 2011, Blew et al. 2015, Koffijberg et al. 2015).
In the last decades there was a strong decline in a variety of coastal bird species (van Roomen et al. 2012, Blew et al. 2015, Koffijberg et al. 2015, Fig. 5). Reasons for these population decreases are diverse and probably interconnected with each other. Climate change is presumably one of the main drivers inducing sea-level rise and an increase in flooding events. Bird species which breed close to 38
the shoreline or on beaches may suffer from a decrease in reproduction success because nests are regularly flooded and destroyed (van de Pol 2010, Wolff et al. 2010). But also increased mammalian predation threatens the breeding populations (Wolff et al. 2010). In shellfish-feeding species a reduced food supply might play an important role as well (Kabat et al. 2012, Koffijberg et al. 2015).
In addition to the population changes, there are also changes in the migration pattern of the birds. Some species (e.g. geese, ducks) arrive earlier in spring from their winter areas and leave the
Changes over 25 years (1987/1988 -2011/2012) in% (without Common Eider) -100
Eurasian Spoonbill Grc:at Cormorant Barnacle: Goose:
Sandc:rling Grc:at Ringc:d Plovc:r Northc:m Pintail Curlc:w Sandpipc:r Common Gull Northc:m lapwing Northc:rn Shovc:lc:r Eurasian Curlc:w Bar-tailc:d Godwit Common Grc:c:nshank Ruddy T umstonc:
Grc:y Plovc:r Common Rc:dshank Common Shc:lduck Dunlin Black-hc:adc:d Gull Eurasian Wigc:on Whimbrc:I Grc:at Black-backc:d Gull Rc:d Knot Brc:nt Goose:
Common Tc:al Pic:d Avocc:t Europc:an Hc:rring Gull Europc:an Goldc:n Plovc:r Mallard Eurasian Oystc:rcatchc:r Spottc:d Rc:dshank Kc:ntish Plovc:r Ruff
-75 -50 -25 0 25 50 75 100 125 150
- - - -
1.814- - -
375- - -
359- -
r-7":".'""'""1
- • 0
~ • strong increaseI
moderate increaseI
stable~ trend not significant
-
• moderate decrease--
• strong decreasec:::::I
- . - ~• = -
1111111 -- - -
Fig. 5: Long-term and short-term population trends for coastal birds in the Wadden Sea, source: Blew et al. (2015)
General introduction
Wadden Sea later than before (Wolff et al. 2010) which might cause an increased predation pressure on the intertidal benthic community. Other species tend to leave the Wadden Sea earlier to their Arctic breeding sites due to earlier snow melting (Piersma and Rakhimberdiev, Wadden Sea Day 2016). These species need to take up the same amount of food in a shorter time to refuel their fat reserves. Although birds are one of the most important predators in the tidal flats, little is known about their influence on the intertidal communities. Therefore, it is difficult to assess the impact of population and migration changes of birds on the Wadden Sea ecosystem.
3. Management strategies
3.1. Impacts on the Wadden Sea
The Wadden Sea is exposed to a variety of natural and anthropogenic changes and disturbances which may alter the ecosystem temporally or permanently (Wolff et al. 2010, Doney 2012). Storm events or severe winters with ice shredding on the intertidal surface are consistent natural disturbances which may cause local damages but have no long-lasting effects on the whole ecosystem. On the other hand, there is a diversity of anthropogenic impacts which are permanent stressors for the Wadden Sea ecosystem (e.g. land reclamation, pollution, extraction of oil and fisheries for fish, shellfish and shrimps, Wolff et al. 2010). But also climate driven changes such as sea-level rise and ocean acidification are severe threats for the coastal ecosystem and may induce irreversible damages in the system structure and functioning. Management of coastal habitats is therefore confronted with a variety of very serious challenges (Levin 2009).
3.2. Ecosystem-based management
In order to protect the unique ecological status as a World Heritage Site and its outstanding importance for birds, the Wadden Sea is subjected to extensive protection and management arrangements on national and international (i.e. Framework of Trilateral Wadden Sea Cooperation) levels (Wolff et al. 2010). The main objective of these conservation strategies is to attain a natural 40
and sustainable ecosystem in which natural processes proceed undisturbed (Wolff et al. 2010).
Therefore, a comprehensive list of environmental legislation was developed to protect the tidal area
with its morphological dynamics and its species composition which supports the huge flocks of coastal birds (Wolff et al. 2010). The most relevant ordinances are the Habitats, Birds and Water Framework Directives which should deal as guidelines to achieve a good ecological status (Meeresumwelt 2012). The characteristics of an ecosystem which is in a good status can be summarized in six different points: the system achieved a homeostasis; the system is free of diseases; there is a high level of diversity and complexity; the ecosystem is resilient and stable in front of perturbations; there is a scope for growth and there is a balance between the system
components (J0rgensen et al. 2010).
Large-scale comprehensive ecosystem-based management is therefore crucial to develop and apply ecological indicators which describe the current status of coastal ecosystems in order to assess effective marine conservation and protection strategies (Levin 2009, J0rgensen et al. 2010). In this context, an understanding of the whole functioning of the ecosystem is needed to identify reliable indicators (Levin 2009, Samhouri 2009). Scientific investigations on ecosystem-level are therefore strongly recommended because questions about the ecosystem status cannot be answered by studying single species or populations. An ecosystem is more than just the sum of components (Mann et al. 1989). In contrast to single species or population studies, research on ecosystem-level takes into account all components of system and all their direct and indirect interactions (Pockberger and Asmus 2014). One of the few tools which can allow holistic approaches on ecosystem-scale is the modelling of food web structures which could give insight in the complex interaction within ecosystems and their reaction to stressors and disturbances.
General introduction
4. Ecological Network Analysis
4.1. The theory of Ecological Network Analysis
Ecological Network Analysis (ENA) can be used to create a holistic representation of the intertidal food web. It provides tools allowing to understand the functioning of the whole ecosystem (Wulff et al. 1989). The methodology is based on economic input-output theory developed by Leontief (1951).
Hannon (1973) was the first who applied the principle to ecological systems. The concept of ENA is in detail described in Kay et al. (1989) and Ulanowicz (2004).
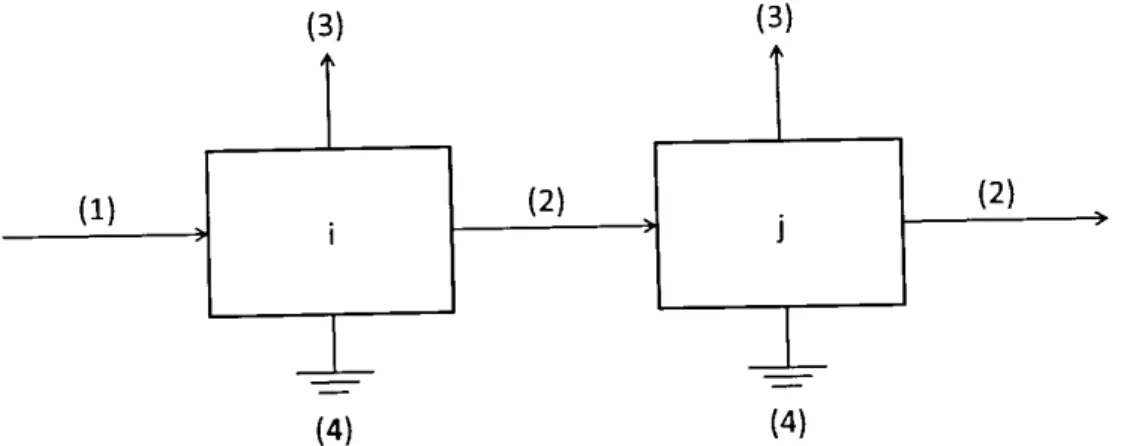
The currency of natural systems is energy (Fath 2007). Therefore, ENA pays more attention to energy processes in a system than to single objects such as species (Ulanowicz 2004). The diverse interactions between the species in a particular environment are described as flows of energy between different feeding levels resulting in a simplified representation of the natural system (Heymans et al. 2014, Fig. 6). ENA accounts for the totality of relationship between the systems' various components (Leguerrier et al. 2003) and results in a full picture of all direct and indirect effects in a system based on the systematic application of linear algebra (Ulanowicz 2004).
(3) (3)
(1) (2) (2)
(4) (4)
Fig. 6: Four possible classes of energetic flows within a system between prey compartment i and consumer compartment j: (1) exogenous inputs (e.g. solar radiation), (2) intercompartmental exchanges, (3) exports of organic material (e.g. egestion), (4) energy dissipation (e.g. respiration)
42
In ENA, each component of the network is represented as a compartment which can be a species, a group of species or a functional group (Fath 2007). Information about the biomass stock and the physiological parameters is required for the different compartments (i.e. for autotrophs:
gross primary production, respiration and net primary production; for heterotrophs: production, respiration, egestion and consumption, Fath 2007) . Each compartment is then characterized by a production value, energy losses due to respiration and egestion, and energy input based on gross primary production or consumption. The consumption fluxes connect the compartments with each other by quantifying how much energy of prey compartment i enters the consumer compartment j.
Therefore, the diet composition of each compartment is needed providing information about who eats whom and by how much (Fath 2007).
ENA is therefore a data intensive technique which is capable to analyze the complex interactions within an ecosystem including all direct and indirect relationships.
4.2. ENA output
Results of ENA are diverse and can be a powerful tool to assess the ecosystems' current status (Saint-Beat 2015). A mature and stable system is assumed to increase in its properties of organization, cycling and in its complexity (Saint-Beat 2015). On the other hand, a system should also maintain reserves of free energy (i.e. overhead) to react to perturbations. A balanced system which is stable in front of perturbations and at the same time efficient in using its energy sources therefore requires both, an adequate amount of organization and overhead of free energy to cope with disturbances (Ulanowicz 2004, Fath 2015, Saint-Beat 2015). Ecological Network Analysis uses a set of algorithms from which several system properties can be derived. These properties are the system attributes which describe the system in terms of its size and activity, developmental status, flow structure (e.g. diversity of flows, number of parallel pathways), cycling properties and trophic organization (Wulff et al. 1989). The attributes can be used to determine environmental issues but
General introductio1
also to describe the system's status in terms of maturity, health, stability and stress (Scharler and Baird 2005a, Schuckel et al. 2015).
In a complex food web network each component influences each other directly or indirectly. For example, an oystercatcher feeding on cockles is directly dependent on the cockle compartment.
However, because the cockles filter phytoplankton the oystercatcher also depends on phytoplankton due to an indirect connection. These hidden relationships are often difficult to assess but ENA provides comprehensive dependency matrices with quantitative information about all connections - direct and indirect ones - in the network. Such calculations allow an estimation of how
a change in one compartment of the system affects the other compartments.
Results from ENA are therefore of great importance for ecosystem-based management as they can provide information about the current ecological status of whole ecosystems. It might therefore be possible to include ENA indices as health indicators in the Water Framework Directives to assess the state of marine ecosystems (Saint-Beat 2015).
S. Focus of the thesis
5.1. Study site
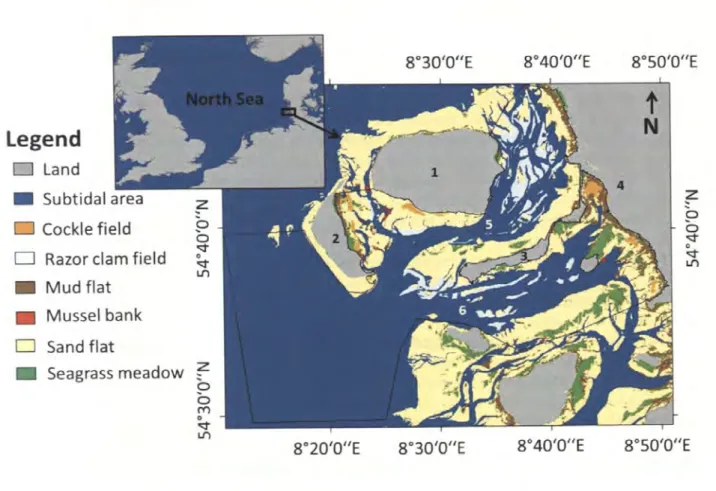
The present study is located in the German part of the Wadden Sea at the western coast of the federal state of Schleswig-Holstein between the islands Amrum, Fohr and Langeness (Fig. 7). The area has a total size of 655.4 km2 with 286.3 km2 of intertidal flats. The tidal range is on average 3.0 m.
Mean temperature varies from 16
·c
in summer to 5.9·c
in winter. The salinity ranges from 30.1 in summer to 28.5 in winter.Two large tidal inlets enter the study site, the Norderaue in the north between the islands Fohr and Langeness and the Suderaue in the south of Langeness. Both inlets have a permanent water exchange with the open North Sea.
The intertidal area of the study site is characterized by six different habitat types (Fig. 2, Fig. 7).
Most of the area is covered by sand flats (62.7%) followed by seagrass meadows (13.0%). 12.3% of 44
the site consists of razor clam fields. Mud flats cover 9.3% of the study site and only small areas are represented by cockle fields (2.4%) and mussel banks (0.2%).
The studied area is of great importance for a variety of coastal bird species which use the islands as roosting and breeding sites and the intertidal flats for foraging (Koffijberg et al. 2013).
Legend
D Land
• D Cockle field D Razor clam field
• Mud flat
• Mussel bank D Sand flat
• Seagrass meadow
8°30'0"E 8°40'0"E
8°20'0"E 8°30'0"E 8°40'0"E
8°SO'O"E
N t
z 0 0
q-0 q-
LJ)
8°SO'O"E
Fig. 7: Location and habitat distribution of the study site; the black frame delimits the border of the studied area; 1) Fohr, 2) Amrum, 3) Langeness, 4) Mainland coast, 5) Norderaue, 6) Si.ideraue; map changed after Brockmann Consult GmbH © 2014 (picture processing) and Landsat-8 USGS © 2014 (original data)
General introduction
5.2. Objectives
The present thesis focuses on the influence of birds on six intertidal habitats of the Wadden Sea.
Birds were included in food web models to assess the impact of avian predation pressure on the ecosystem. This study is one of the first of its kind as birds are rarely included in food web studies because they are highly mobile and difficult to incorporate in quantitative analysis. The thesis is divided in four chapters dealing with distinct objectives:
Chapter 1: The first chapter focuses on the characterization of the six selected habitats of the Wadden Sea (i.e. cockle field, razor clam field, mud flat, mussel bank, sand flat and seagrass meadow). These habitats were represented by their species composition, abundance and biomass of benthic flora and fauna. In addition, foraging birds were counted in each of the habitats.
Chapter 2: Missing relationships between different biomass units (e.g. relationship between fresh weight and carbon content) were determined in the second chapter for several species of birds from the Wadden Sea. Indeed, bird data is usually assessed in abundance while ecological networks use standardized biomass units (e.g. carbon) to describe the flows of energy in the system.
Chapter 3: The intertidal area of the Wadden Sea is a heterogeneous mosaic of different habitats each functioning in a distinct way and with a different importance for foraging birds. In chapter 3 food web models of six intertidal habitats were created using Ecological Network Analysis.
Similarities and differences in the systems' functioning were determined to assess characteristic features of the habitats.
Chapter 4: Birds exert intense predation pressure on intertidal organisms during their breeding and migration periods. However, it is widely unknown how birds and the ecosystem they live in influence each other. An Ecological Network Analysis for the entire study site was conducted in order to assess the current state of the studied ecosystem and to get insight in the impact of birds in the intertidal food web.
46
6. References
Asmus, H., and R. Asmus. 1985. The importance of grazing food chain for energy flow and production in three intertidal sand bottom communities of the northern Wadden Sea. HELGOLANDER MEERESUNTERSUCHUNGEN 39:273-301.
Asmus, R., M., , and E. Bauerfeind. 1994. The microphytobenthos of Konigshafen - spatial and seasonal distribution on a sandy tidal flat. HELGOLANDER MEERESUNTERSUCHUNGEN 48:257-276.
Beukema, J., J. 1976. Biomass and species richness of the macrobenthic animals living on the tidal flats of the Dutch Wadden Sea. Netherlands Journal of Sea Research 10:236-261.
Blew, J., K. Gunther, B. Halterlein, R. Kleefstra, K. Laursen, and G. Scheiffarth. 2015. Trends of Migratory and Wintering Waterbirds in the Wadden Sea 1987 /1988-2011/2012.
Dolch, T., C. Buschbaum, and K. Reise. 2013. Persisting intertidal seagrass beds in the northern Wadden Sea since the 1930s. Journal of Sea Research.
Doney, S., Ruckelshaus, M, Duffy, JE, Barry, JP, Chan, F, English, CA, Galindo, HM, Grebmeier, JM, Hollowed, AB, Knowlton, N, Polovina, J, Rabalais, NN, Sydeman, WJ, Talley, LD. 2012. Climate Change Impacts on Marine Ecosystems. Annual Reviews 4:11-37.
Fath, B., D., Scharler, U., M., Ulanowicz, R., E., Hannon, B. 2007. Ecological network analysis: network construction. Ecological Modelling 208:49-55.
Fath, B. D. 2015. Quantifying economic and ecological sustainability. Ocean & Coastal Management 108:13-19.
Gatje, C., and K. Reise. 1998. Okosystem Wattenmeer: Austausch-, Transport-und Stoffumwandlungsprozesse. Springer, Berlin.
Goss-Custard, J. 1980. Competition for food and interference among waders. Ardea 68:31-52.
Hannon, B. 1973. The structure of ecosystems. Journal of theoretical biology 41:535-546.
Heymans, J. J., M. Coll, S. Libralato, L. Morissette, and V. Christensen. 2014. Global patterns in ecological indicators of marine food webs: a modelling approach. Plos One 9:e95845.
J0rgensen, S. E., L. Xu, and R. Costanza. 2010. Handbook of ecological indicators for assessment of ecosystem health. CRC press.
Kabat, P., J. Bazelmans, J. van Dijk, P. M. Herman, T. van Oijen, M. Pejrup, K. Reise, H. Speelman, and W. J. Wolff. 2012. The Wadden Sea Region: Towards a science for sustainable development.
Ocean & Coastal Management 68:4-17.
Kay, J. J., L. A. Graham, and R. E. Ulanowicz. 1989. A detailed guide to network analysis. Pages 15-61 Network Analysis in Marine Ecology. Springer.
Koffijberg, K., K. Laursen, B. Halterlein, G. Reichert, and J. Frikke. 2013. Trends of Breeding Birds in the Wadden Sea 1991-2009.
Koffijberg, K., K. Laursen, B. Halterlein, G. Reichert, J. Frikke, and L. Soldat. 2015. Trends of Breeding Birds in the Wadden Sea 1991-2013. Wadden Sea Ecosystem.
Leguerrier, D., N. Niquil, N. Boileau, J. Rzeznik, P.-G. Sauriau, 0. Le Moine, and C. Bacher. 2003.
Numerical analysis of the food web of an intertidal mudflat ecosystem on the Atlantic coast of France. Marine Ecology Progress Series 246:17-37.
Leontief, W.W. 1951. Input-output economics. Sci Am 185:15-21.
Levin, P., Fogarty, MJ, Murawski, SA, Fluharty, D. 2009. Integrated Ecosystem Assessments:
Developing the Scientific Basis for Ecosystem-Based Management of the Ocean. PLoS Biology 7:23-28.
Lozan, J. L., E. Rachar, K. Reise, H. Von Westernhagen, and W. Lenz. 1994. Warnsignale aus dem Wattenmeer: wissenschaftliche Fakten. Blackwell Wissenschafts-Verlag.
Mann, K. H., J. G. Field, and F. Wulff. 1989. Network analysis in marine ecology: an assessment.
Springer.
General introduction
Markert, B., A. Breure, and H. Zechmeister. 2003. Biomonitoring with birds. Bioindicators &
Biomonitors:677.
Markones, N., and P. D.S. Garthe. 2011. Marine Saugetiere und Seevogel in der deut-schen AWZ von Nord-und Ostsee-Teilbericht Seevogel.
Meeresumwelt, G. d. 2012. Umsetzung der Meeresstrategie-Rahmenrichtlinie. Bund- Lander Messprogramm.
Mendel, B. 2008. Profiles of seabirds and waterbirds of the German North and Baltic Seas:
distribution, ecology and sensitivities to human activities within the marine environment.
Bundesamt f. Naturschutz.
Pockberger, M., and H. Asmus. 2014. Empfehlungen zur Anwendung von Okosystemanalysen zur Beurteilung des Nahrungsnetzes im Wattenmeer in der Meeresstrategie Rahmenrichtlinie.
Reise, K., M. Baptist, P. Burbridge, N. Dankers, L. Fischer, B. Flemming, A. Oost, and C. Smit. 2010. The Wadden Sea-a universally outstanding tidal wetland. The Wadden Sea 2010. Common Wadden Sea Secretariat (CWSS); Trilateral Monitoring and Assessment Group:
Wilhelmshaven.(Wadden Sea Ecosystem; 29/editors, Harald Marencic and Jaap de Vias) 7.
Saint-Beat, B., Baird, D., Asmus, H., Asmus, R., Bacherd, C., Pacellaa, S., R., Johnsona,G., A., Davida, V., Vezinaf, A., F., Niquila, N. 2015. Trophic networks: How do theories link ecosystem structure and functioning to stability properties? A review. Ecological indicators 52:458-471.
Samhouri, J., F., Levin, P., S., Harvey, C., J. 2009. Quantitative Evaluation of Marine Ecosystem Indicator Performance Using Food Web Models. Ecosystems 12:1283-1298.
Scharler, U. M., and D. Baird. 2005. A comparison of selected ecosystem attributes of three South African estuaries with different freshwater inflow regimes, using network analysis. Journal of
Marine Systems 56:283-308.
Schuckel, U., I. Kroncke, and D. Baird. 2015. Linking long-term changes in trophic structure and function of an intertidal macrobenthic system to eutrophication and climate change using ecological network analysis. Mar Ecol Prag Ser 536:25-38.
Smardon, R. 2009. The Wadden Sea Wetlands: A Multi-jurisdictional Challenge. Pages 21-56 Sustaining the World's Wetlands. Springer.
Ulanowicz, R. E. 2004. Quantitative methods for ecological network analysis. Computational Biology and Chemistry 28:321-339.
van de Kam, J. 2004. Shorebirds: an illustrated behavioural ecology. KNNV.
van de Pol, M., Ens, B., J., Heg, D., Brouwer, L., Krol, J., Maier, M., Exo, K., Oosterbeek, K., Lok, T.,Eising, C., M., Koffijberg, K. 2010. Do changes in the frequency, magnitude and timing of extreme climatic events threaten the population viability of coastal birds? Journal of Applied Ecology 47:720- 730.
van Roomen, M., K. Laursen, C. van Turnhout, E. van Winden, J. Blew, K. Eskildsen, K. Gunther, B.
Halterlein, R. Kleefstra, and P. Pote!. 2012. Signals from the Wadden sea: Population declines dominate among waterbirds depending on intertidal mudflats. Ocean & Coastal Management 68:79-88.
Volkenborn, N., S. Hedtkamp, J. Van Beusekom, and K. Reise. 2007. Effects of bioturbation and bioirrigation by lugworms (Arenicola marina) on physical and chemical sediment properties and implications for intertidal habitat succession. Estuarine, Coastal and Shelf Science 74:331-343.
Wolff, W. 1983. Ecology of the Wadden Sea. v. 2: Fishes and fisheries, birds, marine mammals, pollution.
Wolff, W. J., J. P. Bakker, K. Laursen, and K. Reise. 2010. The Wadden Sea Quality Status Report- Synthesis Report 2010. The Wadden Sea 2010. Common Wadden Sea Secretariat (CWSS);
Trilateral Monitoring and Assessment Group: Wilhelmshaven.(Wadden Sea Ecosystem;
29/editors, Harald Marencic and Jaap de Vias) 25.
Wulff, F., J. G. Field, and K. H. Mann. 1989. Network analysis in marine ecology: methods and applications. Springer Science & Business Media.
48
J~t~ }i ?H ~---~· ;::.1i,'-:,:_~ i /\ Ti?;" 1 j\,'iV;! ; i! 3H 7 ()l_.;;.;, ~ ;_t,-\;.:1 l~-'l]~
Photo flying geese: Robert Waleczek
The diversity of benthos and birds in intertidal habitats
Horn, 51
Affiliation
1 Alfred-Wegener-Institute Helmholtz Centre for Polar- and Marine Research, Wadden Sea Station
Sylt Hafenstr. 43, D-25992 List/ Sylt, Germany Corresponding author: sabine.horn@awi.de
Keywords: species composition, shorebirds, mussel bank, biodiversity, seasonal variation
Abstract:
In the Wadden Sea, benthic species are highly productive and represent an important link between the marine microflora and -fauna and higher trophic levels such as birds. In this study, six intertidal habitats (i.e. cockle field, razor clam field, mud flat, mussel bank, sand flat and seagrass meadow) directly influenced by the open North Sea were studied in terms of their benthic species- composition and their diversity of foraging birds.
Chlorophyll a content of microphytobenthos and biomass of benthic species showed seasonal variations with peaks in summer and autumn, respectively.
The species composition differed between the habitats. The cockle field, the razor clam field and the mussel bank were dominated by bivalve species (i.e. Cerastoderma edule, Ensis directus, Mytilus edulis, respectively) whereas the mud flat, the sand flat and the seagrass meadow showed a dominance of gastropods mainly caused by Peringia ulvae.
The highest abundances of birds were found on the sand flat and the seagrass meadow but the species composition of foraging birds differed between the habitats.
1. Introduction
The Wadden Sea, which is entirely a World Heritage Site since 2014, is a highly productive intertidal area and of outstanding importance for millions of breeding and migrating coastal birds (Asmus and Asmus 1985, Wolff et al. 2010, Koffijberg et al. 2015). Benthic species accumulate unevenly in specific areas in the intertidal area and form a heterogeneous mosaic of different habitats which are used in variable intensities by foraging birds. The benthos is therefore an important link between the marine microflora and - fauna and higher trophic levels (Wolff et al.
2010). Thus, studies about the benthos composition are a necessary requirement to understand the structure and functioning of the intertidal ecosystem.
However, in the German part of the Wadden Sea, only two benthic datasets with detailed information about species abundance and biomass in different intertidal habitats are available, the first one is from the Sylt-R0m0 Bight in the northern Wadden Sea (Baird et al. 2004, Baird et al. 2007, 2012) and the second one is from the Jade Bay in the southern Wadden Sea (Schuckel et al. 2015).
Both the Sylt-Rpmp Bight and the Jade Bay are enclosed basins with a small connection to the open North Sea. No recent data is available for the intertidal area more influenced by the North Sea, although such areas represent large parts of the Wadden Sea.
The present study therefore aims 1) to create a basic data set for benthos in an intertidal area directly influenced by the open North Sea and 2) to determine the diversity of birds feeding in different intertidal habitat types.
2. Material and Methods 2.1. Study site
The study site was located in the north-eastern German Wadden Sea at the western coast of the federal state of Schleswig-Holstein between the islands Amrum, Fi:ihr and Langeness (Fig 1).
Chapter 1
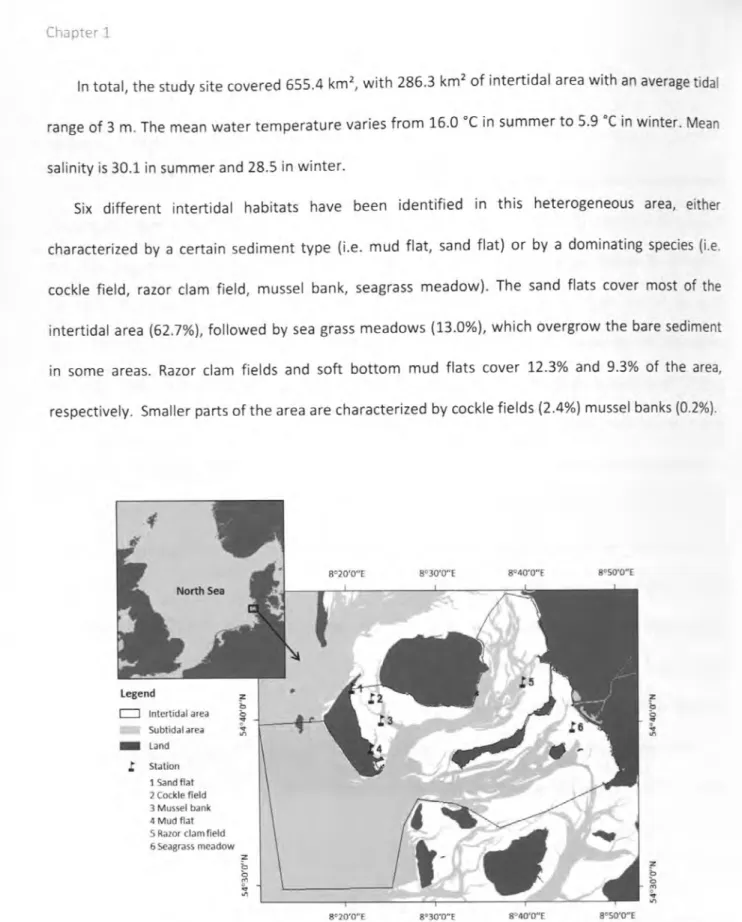
In total, the study site covered 655.4 km2, with 286.3 km2 of intertidal area with an average tidal range of 3 m. The mean water temperature varies from 16.0 °C in summer to 5.9 °C in winter. Mean salinity is 30.1 in summer and 28.5 in winter.
Six different intertidal habitats have been identified in this heterogeneous area, either characterized by a certain sediment type (i.e. mud flat, sand flat) or by a dominating species (i.e.
cockle field, razor clam field, mussel bank, seagrass meadow). The sand flats cover most of the intertidal area (62.7%), followed by sea grass meadows (13.0%), which overgrow the bare sediment in some areas. Razor clam fields and soft bottom mud flats cover 12.3% and 9.3% of the area, respectively. Smaller parts of the area are characterized by cockle fields (2.4%) mussel banks (0.2%).
[=:J Intertidal area Subtidal area
- Land
l Station
1 Sand flat 2 Cockle field 3 Mussel bank 4 Mudflat S Razor clam field 6 Seagrass meadow
b z b ::'
..
"'
8°20'0"E s•3o·o·E 8°40'0"E s•so'O"E
z b b ::'
..
"'
Fig. 1: Location of the study site. The black frame delimits the studied area. Sampling locations in the different habitat types are represented with black flags, map source: Topographic GIS map 2003, issued by National Park Authority, Tanning
56
2.2. Sampling
Samples were taken seasonally (Spring: March to May, Summer: June to August, Autumn:
September to November, Winter: December to February) between summer 2013 and summer 2015 in each of the six habitat types (i.e. cockle field, razor clam field, mud flat, mussel bank, sand flat, seagrass meadow). In each habitat, five to six stations, in 50 m distance from each other, were sampled, following a transect of 200 to 250 m length. To allow quantitative sampling, microphytobenthos, macrophytes and macrobenthos (i.e. epifauna and infauna) were sampled at each station in a 25x25 cm quadrat.
For microphytobenthos (MPB), the first centimeter of the sediment surface was outpaced with a corer (0 1 cm). The sediment was then freeze-dried and the Chlorophyll a (Chi a) content was
measured and calculated (Lorenzen 1967, Edler 1979).
Samples for epifauna and macrophytes were taken by hand within the quadrat. A subsample for infauna was taken with a lOxlO cm corer in 15 cm depth which was sieved through a 0.5 and 1
mm mesh-cascade. Organisms were sorted out of the sample, identified to the most precise taxonomic level and counted.
Biomass was determined for each species of macrofauna and macrophytes. The samples
were dried in an oven at 50
·c
until constant dry weight and then burned in a furnace at 500·c
for 5h. Ash free dry weight (AFDW) was calculated by subtracting the ash weight from the dry weight.
In each of the sampled habitats foraging birds were counted seasonally in a predefined area of 0.01 km2 (cockle field) to 0.16 km2 (mussel bank) overlapping with the benthos transect. The counts occurred in 10 min intervals for 2 h using a telescope. The birds were identified to species level. Only foraging individuals were taken into account.
Chapter 1
2.3. Data analysis
Data was analyzed using the software Primer v6.1 {Plymouth Marine Laboratory). The biodiversity within each habitat was determined using the Shannon-Index {H', 1.1) which takes into account the number of different species (S) and the total number of individuals (N). Additionally, Pielou's evenness (J', 1.2) was calculated to describe the balance between the abundances of the occurring species.
H' = -
Li
Pi*
ln(pJ (1.1)] ' HI (1.2)
=
log(S)With p; describing the contribution of species i to the total number of individuals N, and Sas the number of species in the habitat.
3. Results and discussion 3.1. Primary producers
3.1.1. Microphytobenthos
MPB and macrophytes were the two primary producers present in the samples.
Mean values for microphytobenthos (MPB) were the highest in the mud flat {20.2 mgChl a.m·
2) followed by the cockle field (11.1 mgChl a.m-2) and the mussel bank (9.61 mgChl a.m·2).
Intermediate values were found in the razor clam field (6.5 mgChl a.m-2) and the sand flat (5.7 mgChl a.m-2)_ The lowest amount of MPB was measured in the seagrass meadow with 4.5 mgChl a.m-2.
There was no consistent seasonal trend between the studied habitats (Fig. 2). The clear spring bloom which was found by Asmus and Bauerfeind (1994) and Colijn and Dijkema (1981) was only observed in the mud flat, which had the highest Chlorophyll a values in this season. The cockle field, the sand flat and the seagrass meadow reached their MPB Chi a peaks in summer, and the razor clam field and mussel bank in autumn.
58