Supplementary Material
1 Description of modeling of standardized scenarios
The provided inventories have been modelled with the LCA Software GaBi and some of the
inventories
1could only be provided as a courtesy of Thinkstep (GaBi Software-System v8.5.0.79 and Database for Life Cycle Engineering SP 35 1992-2018). In the following, a description of the
modelling is provided. Please note that the provided data sets do not aim to represent the status-quo or the future in an accurate way. Instead, the scenarios provided should help to avoid scenario generation for each LCA study and in addition, the scenarios allow a comparison between technologies as they serve as a harmonized input.
Four inventory data sets are provided:
1. Status-quo
2. Low decarbonized 3. High decarbonized 4. Full decarbonized
The scenarios have been generated by applying a simple rule: first, the greenhouse gas emissions of the electricity grid mix are computed and then the other technologies are selected such that the lowest greenhouse gas emissions are always achieved for each input. The only exception is the CO
2supply, in highly or fully decarbonized scenarios, as fossil power plants will no longer be available as a CO
2source. Instead, it is assumed that a direct air capture process supplies the CO
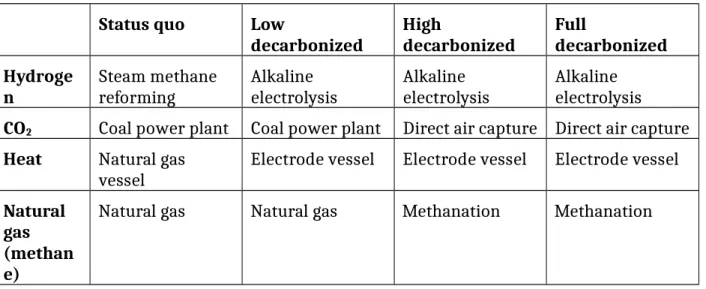
2. In Table 1, the selected technologies are listed.
Table 1: Selected Technologies for scenarios Status quo Low
decarbonized High
decarbonized Full
decarbonized Hydroge
n Steam methane
reforming Alkaline
electrolysis Alkaline
electrolysis Alkaline electrolysis CO
2Coal power plant Coal power plant Direct air capture Direct air capture Heat Natural gas
vessel Electrode vessel Electrode vessel Electrode vessel Natural
gas (methan e)
Natural gas Natural gas Methanation Methanation
1 LCIA results of the following processes are published with permission of Thinkstep: EU-28: Electricity grid mix ts,
DE: Electricity from wind power ts EU-28: Heat ts, DE: Hydrogen ts
Supplementary Material 1.1.1 Electricity:
For the current electricity generation, the mix of electricity production for the EU is used from the GaBi database (EU-28: Electricity grid mix ts). For low and high decarbonized scenarios, the mix of electricity production for the EU is modelled according to the 2°C scenario of the Energy
Technology Perspectives report for the year 2030 respectively 2050. The inventories for the electricity technologies are taken from the GaBi database (GaBi Software-System v8.5.0.79 and Database for Life Cycle Engineering SP 35 1992-2018). As inventories for European technology mixes are not available, inventories representing Germany are used as a proxy. In the Energy Technology Perspectives report, carbon capture and storage (CCS) technologies are used, but no inventories for the used CCS technologies are available. Therefore, electricity technologies with CCS are modelled as the same as conventional electricity technology, but greenhouse gas emissions from the IPPC WGIII AR5 are used instead of the original greenhouse gas emissions (Edenhofer 2014). In the full decarbonized scenario, electricity comes 100% from renewables and thus, wind energy is used as a proxy process (DE: Electricity from wind power ts) (GaBi Software-System v8.5.0.79 and Database for Life Cycle Engineering SP 35 1992-2018).
1.1.2 Hydrogen
Currently, hydrogen is mainly produced by steam methane reforming of hydrocarbons. Therefore, for the status quo, production of hydrogen a steam methane reforming inventory has been used (DE:
Hydrogen ts). For the hydrogen generation via electrolysis ,an alkaline water electrolysis has been modelled according to Koj et al. (Jan Christian Koj, Christina Wulf, Andrea Schreiber and Petra Zapp 2017). The impact of the electricity demand of the electrolysis is then calculated according to the energy scenario.
1.1.3 CO
2For CO
2supply, two sources are considered: capture from exhaust gases of a coal-fired power plant (Schreiber et al. 2009) and direct air capture (von der Assen et al. 2013).
1.1.4 Heat
Heat is either supplied by a natural gas boiler (EU-28: Heat ts) or by an electrode boiler. The electrode boiler simple converts electricity to steam with an efficiency of 95%. No other inventory was considered.
1.1.5 Natural gas
Natural gas is either supplied by the natural gas network of Europe from the extraction of fossil natural gas or by methanation of CO
2and hydrogen
The natural gas network of Europe is modelled by weighting the national natural gas supply
processes from the GaBi database according to their relative market volume in Europe. The market volume of the national gas markets are based on data from Eurostat and are assumed to remain constant over time (Eurostat). The following assumptions are made in the modelling of the natural gas network:
For the national markets of Malta and Cyprus, no data is available. Thus, these countries are
not considered in the EU natural gas mix.
For the countries of Bulgaria, Croatia, Denmark, Estonia, and the Czech Republic, no national processes are available in the GaBi database (GaBi Software-System v8.5.0.79 and Database for Life Cycle Engineering SP 35 1992-2018). The national market of these countries combined contribute less than 4% to the total European market and are neglected.
The market share of the other countries has been adjusted accordingly to reach 100%.
2 Reporting
2.1 Checklist - Executive summary Goal of the study
State the indented application of the study
State the reasons for carrying out the study
State the intended audience of the study
State whether the results are to be used in comparative assertions disclosed to public
State unambiguously the research question(s)
State the classification of the assessed CCU technology Scope of the study
State functional unit clearly and unambiguously according to guideline and report changes due to solving of multi-functionality
State system boundaries according to guideline
State relevant issues with data quality and assumptions
State technology readiness level (TRL) of processes and sub-processes
Report production or storage capacity
Report geographical scope
State software system (and version) and data library (and version) used
State type of review and provide additional information about reviewers Life cycle inventory and life cycle impact assessment
State main results of life cycle inventory and life cycle impact assessment
If results are reported on a relative basis, report basis
Describe uncertainty and sensitivity analysis and report results separately
Interpretation
Supplementary Material
State any conclusions, recommendation and limitations 2.2 Checklist – Main report
Goal of the study
State the indented application of the study
State the reasons for carrying out the study
State the intended audience of the study
State whether the results are to be used in comparative assertions disclosed to public
State unambiguous research question(s)
State the classification of the assessed CCU technology
State limitations due to the assumptions and methods, e.g., if study is preliminary
State commissioner of the study and other influential actors
State technology readiness level (TRL) of processes and sub-processes
Report production or storage capacity
State review process and review experts, if any Scope of the study:
State functional unit clearly and unambiguously according to guideline, report changes due to solving of multi-functionality
State performance characteristics, any omission of additional function in comparison and how performance is measured (might apply for products different in chemical structure and composition to their conventional counterparts)
State system boundaries according to guideline and cut-off criteria including a system boundaries flow chart
State omitted life cycle stages and processes (might apply for products different in chemical structure and composition to their conventional counterparts)
State relevant issues with data quality and assumptions
State method(s) to solve multi-functionality
State impact assessment methods
State data quality needs and how energy and material inputs and outputs are quantified
State software system (and version) and data library (and version) used
State type of review and provide additional information about reviewers
Include flow diagram of assessed process system(s)
State types and sources of required data and information
State calculation procedures
State all assumptions made
Describe sensitivity analysis for refining system boundaries
Include calculated full LCI results (if this not contradicts with confidentiality)
State data representativeness and appropriateness of LCI data
If results are reported on a relative basis, report basis
State results obtained from scenario analysis (including scenarios) and threshold values, if any Life cycle impact assessment
Include results of life cycle impact assessment
State if impact categories coverage is reduced, e.g., in case of carbon footprinting
If results are reported on a relative basis, report basis
State if delayed emissions occur and include emission time profile if needed
If applied, state discounting method and discounted results Life cycle interpretation
Include and describe the results
Negative emission in cradle-to-gate studies shall not be interpreted as CO
2sinks if life does not end with permanent carbon fixation
Emission reductions due to substitution effects shall be interpreted as environmental benefits but not as negative emissions.
Describe uncertainty and sensitivity analysis and report results separately
Include completeness check
Include consistency check
State assumptions and limitation associated with the interpretation of results
Include conclusions
Include recommendations, if any
Supplementary Material 2.3 Technical Summary Table
G O A L
CCU product Goal
Brief description Intended audience Functional unit
Limitations & assumptions
SC O P E
Boundary (i.e., cradle-to-gate)
Location Time frames
Multi-functional approach
☐Sub-division☐System expansion
☐System expansion via substitution
☐Virtual sub-division
☐Mass allocation
☐Energy allocation
☐Economic allocation
☐ Closed loop scenarios
☐Other (please specify)………
IN V EN T O R Y
Data source
☐Primary sources☐Secondary sources
☐Stoichiometric data
☐Process modelling based data
☐Mixes sources
☐Other (please specify)
……….
Energy sources
(select all that apply)
☐Grid mix
☐Power station with Carbon Capture
☐Wind
☐Solar
☐Nuclear
☐Hydro
☐Future (see timeframes)
☐Other (please specify)………..
Main sub-processes and TRLS
SUB-PROCESS TRL
TRL TRL TRL
Database & software used
A SS ES SM EN T
LCIA method
☐ CML☐ ILCD recommendation: v.____
☐ TRACI 2.0
OTHER IMPACT METHODS
☐………
SINGLE CATEGORIES:
☐ Climate change
☐ CED
☐ use TOX