Ancient globetrotters — connectivity and putative native ranges of two cosmopolitan biofouling amphipods
Jan Beermann1,2,3, Allison K. Hall-Mullen1,3, Charlotte Havermans1,4, Joop WP Coolen5,6, Richard PMA Crooijmans7, Bert Dibbits7,
Christoph Held1and Andrea Desiderato1,8
1Department of Functional Ecology, Alfred Wegener Institute, Helmholtz Centre for Polar and Marine Research, Bremerhaven, Germany
2Helmholtz Institute for Functional Marine Biodiversity, Oldenburg, Germany
3FB2, University of Bremen, Bremen, Germany
4Helmholtz Young Investigator Group“Arctic Jellies”, Alfred Wegener Institute Helmholtz Centre for Polar and Marine Research, Bremerhaven, Germany
5Wageningen Marine Research, Den Helder, The Netherlands
6Chair group Aquatic Ecology and Water Quality Management, Wageningen University, Wageningen, The Netherlands
7Animal Breeding and Genomics, Wageningen University, Wageningen, The Netherlands
8Programa de Pós‐Graduação em Zoologia (PPGZOO), Departamento de Zoologia, Universidade Federal do Paraná, Curitiba, Brazil
ABSTRACT
The geographic distributions of some coastal marine species have appeared as cosmopolitan ever since they were first scientifically documented. In particular, for many benthic species that are associated with anthropogenic substrata, there is much speculation as to whether or not their broad distributions can be explained by natural mechanisms of dispersal. Here, we focused on two congeneric coastal crustaceans with cosmopolitan distributions—the tube-dwelling amphipodsJassa marmorata andJassa slatteryi. Both species are common elements of marine biofouling on nearly all kinds of artificial hard substrata in temperate to warm seas. We hypothesized that the two species’modern occurrences across the oceans are the result of human shipping activities that started centuries ago. Mitochondrial DNA sequences of the CO1 fragment of specimens from distinct marine regions around the world were analysed, evaluating genetic structure and migration models and making inferences on putative native ranges of the two Jassaspecies. Populations of both species exhibited considerable genetic diversity with differing levels of geographic structure.
For both species, at least two dominant haplotypes were shared among several geographic populations. Rapid demographic expansion and high migration rates between geographically distant regions support a scenario of ongoing dispersal all over the world. Ourfindings indicate that the likely former native range of J. marmoratais the Northwest Atlantic, whereas the likely former native range of J. slatteryiis the Northern Pacific region. As corroborated by the genetic connectivity between populations, shipping still appears to be the more successful vector of the two species’dispersal when compared to natural mechanisms. Historical invasion events that likely started centuries ago, along with current ongoing dispersal, confirm these species’identities as true “neocosmopolitans”.
Submitted16 April 2020 Accepted6 July 2020 Published28 July 2020 Corresponding author Jan Beermann, Jan.Beermann@awi.de Academic editor Tim Collins
Additional Information and Declarations can be found on page 17
DOI10.7717/peerj.9613 Copyright
2020 Beermann et al.
Distributed under
Creative Commons CC-BY 4.0
Subjects Biogeography, Marine Biology, Molecular Biology, Zoology
Keywords Amphipoda, Biofouling, Biological invasion, Cosmopolitan distribution, Marine dispersal, Marine shipping
INTRODUCTION
Human-mediated dispersal of organisms can exceed natural mechanisms, carrying species over large distances and often across natural barriers (Ashton et al., 2007;Cohen & Carlton, 1998;Galil, Froglia & Noël, 2002;Gollasch, 2002;Molnar et al., 2008). For example, for as long as vessels have navigated oceans across the globe, non-native marine species have been transported and introduced into new regions as part of the fouling communities on vessel hulls and, for the last 100± years, in ballast water (Carlton, 1985;Thiel et al., 2003).
Thanks to the rise of scientific documentation and description, human-mediated introductions of marine species across the globe within the last half-century have been increasingly documented. In clear contrast, the dispersal of marine species in earlier centuries is nearly undocumented and probably a great many introductions since the 1820’s have yet to be recognized. Many coastal benthic species that occur in anthropogenic habitats, especially those associated with the hulls of wooden ships (i.e., fouling and boring), had probably been distributed across the oceans by human shipping activities centuries before their geographic distributions were scientifically documented for thefirst time. As a consequence, modern geographic distributions of some marine species show cosmopolitan occurrences (e.g.,Conlan, 1990;Thiel & Gutow, 2005), classified as
“neocosmopolitan”(sensuDarling & Carlton, 2018). There is much speculation as to the likely former native ranges of coastal benthic species, with many still not reliably assigned native or introduced status in parts of their global range (Geller, Darling & Carlton, 2010).
In parallel, there is mounting evidence from modern taxonomy and molecular research studies which increasingly cast doubt on the existence of marine benthic“eucosmopolitan”
species (sensuDarling & Carlton, 2018;Havermans, 2016).
Here, we focused on two congeneric coastal species that are widely distributed in the world’s oceans: the tube-dwelling amphipod crustaceansJassa marmorataHolmes, 1905 andJassa slatteryiConlan, 1990. Despite both species being common elements of marine fouling communities in harbors ranging from temperate to warm seas, their geographic distributions are not well characterized (Marchini & Cardeccia, 2017).Jassa species are effective colonizers of clean hard substrata through immigration of nearby adult animals, but primarily by recruitment of drifting juveniles through the water column (Beermann, 2014;Franz & Mohamed, 1989;Havermans et al., 2007). By these means, Jassaspecies can dominate fouling communities particularly on artificial hard substrates such as navigational buoys, harbour walls, offshore wind farms and ship wrecks, easily reaching densities of more than 1,000,000 individuals/m2and exceeding other taxa in terms of abundance and biomass (Coolen et al., 2018;Franz, 1989;Scinto et al., 2007;
Zintzen et al., 2008).
The long-standing difficulties in the taxonomy of the genusJassaled to
misidentifications and thus, unreliable and questionable species records (Conlan, 1989, 1990). Furthermore, with no historical documentation of the species’native ranges prior to
scientific documentation, it was next to impossible to retrace the origin and native ranges of these species. Although the historical invasion pathways ofJ. marmorataandJ. slatteryi are difficult to reconstruct, given their ecology, we hypothesized that the current
“cosmopolitan”distribution of these species is probably the result of“ancient”invasive events (i.e., prior to scientific documentation and description), mediated by transoceanic shipping activities that started centuries ago.
Molecular approaches have often been used to retrace species’native ranges, particularly in the case of ecologically harmful invasive invertebrate species such as woodwasps (e.g.,Boissin et al., 2012) and ladybird beetles (e.g.,Lombaert et al., 2011). By using mitochondrial sequence data or shorter fragments such as microsatellites or SNPs, the origins and pathways of invasion or colonization can be retrieved, even in cases of complex histories, independent introductions and subsequent admixtures (e.g.,Estoup &
Guillemaud, 2010). To this purpose, we analysed mitochondrial DNA sequences of the CO1 fragment of the two globally distributedJassaspecies in order to evaluate their genetic structure and infer their putative former native ranges.
MATERIALS AND METHODS
Specimen collection and taxonomic identification
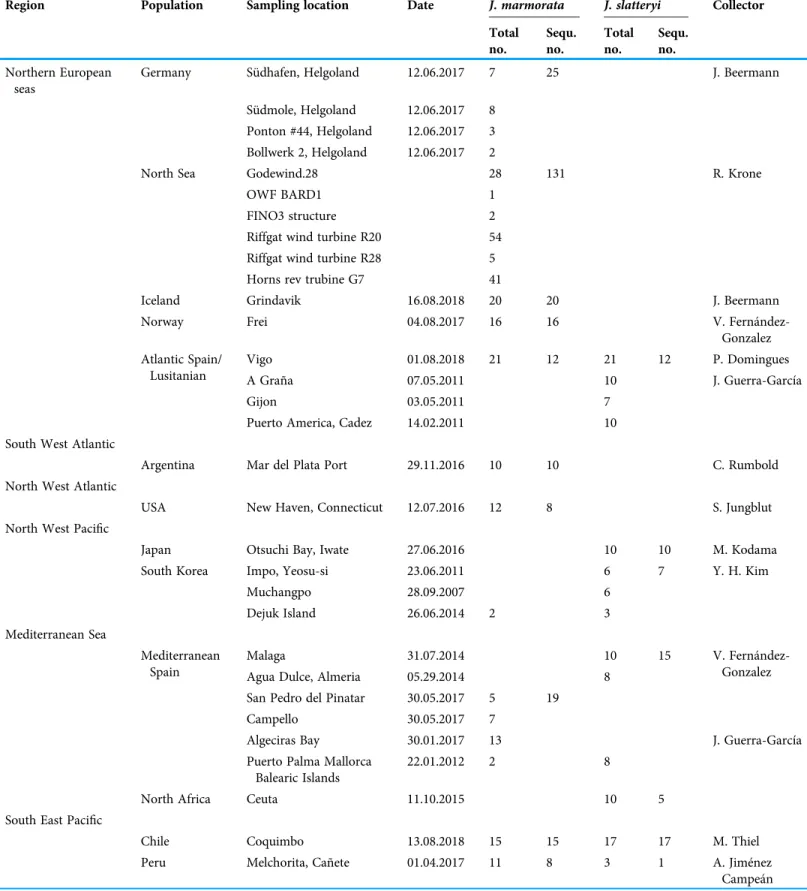
Samples were collected opportunistically from artificial substrates (e.g., harbor walls, pontoons, offshore constructions) within distinct marine regions via different sampling methods. A total of 419 specimens were collected, 291 of which were identified
morphologically asJ. marmorataand 128 of which were identified asJ. slatteryi, following the original descriptions provided by Conlan (1990)(Table 1).
DNA isolation, amplification and sequencing
If available, at least 10 specimens (including males, females and juveniles) from each sampling location were used for molecular analysis. Two to three pereopods (pereopods 5–7, depending on the animal’s size) of each specimen were used for DNA isolation.
DNA extractions were performed using the QIAmp DNA Mini Kit (Qiagen, Hilden, Germany) according to the manufacturer’s protocols. Polymerase chain reaction (PCR) amplifications at the cytochrome c oxidase 1 fragment were carried out using the universal primers LCO1490 (5′GGTCAACAAATCATAAAGATATTGG 3′) and HCO2198 (5′TAAACTTCAGGGTGACCAAAAAATCA 3′) (Folmer et al., 1994). The 25 µl reaction mix consisted of 0.2 mM dNTPs, 0.5 µM forward and reverse primers, 10 µM PCR buffer, 0.02U/µl Hotmaster Taq (5 Prime GmbH, Hamburg, Germany), 3 µl template DNA, and mol grade water to bring the mix to thefinal volume of 25 µl. PCR thermal cycling conditions for amplifying CO1 sequences consisted of an initial denaturation at 94C for 2 min, followed by 36 cycles of 94C for 20 s, primer annealing at 42C for 20 s, extension at 65C for 1 min, and afinal extension at 65C for 15 mins. The PCR product quality was assessed on a 2% agarose gel, sequencing was performed at a contracting sequencing facility (EUROFINS, Germany). Material contributed by J. Coolen was processed using the same protocol as inLuttikhuizen et al. (2019).
Table 1 Sampling by region and species.
Region Population Sampling location Date J. marmorata J. slatteryi Collector
Total no.
Sequ.
no.
Total no.
Sequ.
no.
Northern European seas
Germany Südhafen, Helgoland 12.06.2017 7 25 J. Beermann
Südmole, Helgoland 12.06.2017 8 Ponton #44, Helgoland 12.06.2017 3 Bollwerk 2, Helgoland 12.06.2017 2
North Sea Godewind.28 28 131 R. Krone
OWF BARD1 1
FINO3 structure 2
Riffgat wind turbine R20 54
Riffgat wind turbine R28 5
Horns rev trubine G7 41
Iceland Grindavik 16.08.2018 20 20 J. Beermann
Norway Frei 04.08.2017 16 16 V. Fernández-
Gonzalez Atlantic Spain/
Lusitanian
Vigo 01.08.2018 21 12 21 12 P. Domingues
A Graña 07.05.2011 10 J. Guerra-García
Gijon 03.05.2011 7
Puerto America, Cadez 14.02.2011 10
South West Atlantic
Argentina Mar del Plata Port 29.11.2016 10 10 C. Rumbold
North West Atlantic
USA New Haven, Connecticut 12.07.2016 12 8 S. Jungblut
North West Pacific
Japan Otsuchi Bay, Iwate 27.06.2016 10 10 M. Kodama
South Korea Impo, Yeosu-si 23.06.2011 6 7 Y. H. Kim
Muchangpo 28.09.2007 6
Dejuk Island 26.06.2014 2 3
Mediterranean Sea
Mediterranean Spain
Malaga 31.07.2014 10 15 V. Fernández-
Gonzalez
Agua Dulce, Almeria 05.29.2014 8
San Pedro del Pinatar 30.05.2017 5 19
Campello 30.05.2017 7
Algeciras Bay 30.01.2017 13 J. Guerra-García
Puerto Palma Mallorca Balearic Islands
22.01.2012 2 8
North Africa Ceuta 11.10.2015 10 5
South East Pacific
Chile Coquimbo 13.08.2018 15 15 17 17 M. Thiel
Peru Melchorita, Cañete 01.04.2017 11 8 3 1 A. Jiménez
Campeán
Sequence editing and alignments
The software CodonCode Aligner v.8.0 (CodonCode Corporation, Deham, MA, USA) was used to check electropherograms for ambiguous bases, remove primers, and to check for stop codons to prevent inclusion of pseudogenes in the analyses. Clustal W (Thompson, Higgins & Gibson, 1994) implemented in MEGA 7.0 (Kumar, Stecher & Tamura, 2016) was used to align the resulting sequences and the basic local alignment search tool (BLAST) provided by the National Center for biotechnology information website (http://blast.ncbi.nlm.nih.gov/Blast.cgi) was used as a sequence control. DNA barcode data from all genetically analyzed specimens were made publicly available in the project
“JASSA” in the Barcode of Life Data System (BOLD;Ratnasingham & Hebert, 2007) (dx.doi.org/10.5883/DS-JASSA). In addition to the resulting 330 newly edited CO1 sequences (199+131) for the two species obtained for this study, 128 previously published sequences ofJ. marmorataand 16 sequences ofJ. slatteryiwere retrieved from GenBank and BOLD. Thus, the complete dataset consisted of 458 DNA barcodes.
Additionally, 44 haplotype sequences of J. herdmani(Walker, 1893) from a previous work (Luttikhuizen et al., 2019) were added as outgroup (GenBank accession numbers:
MH052599–MH052642). Detailed information on the specimens and sequences are provided inTable S1.
The full alignment of 657 base pairs (bp) was collapsed to unique haplotypes,
subsequently treating gaps as missing data using ALTER (Glez-Peña et al., 2010). A shorter alignment of 589 bp which excluded sequences shorter than 500 bp was chosen for the population analyses that tend to be sensitive to missing data. Finally, an alignment for each species was produced manually, preserving rare haplotypes and deleting shorter sequences of common haplotypes.
Intra- and interspecific species distances were calculated in MEGA 7.0 based on the Kimura-two-parameter (K2P) model with pairwise deletion using the full length of 657 bp sequences; these were then used to estimate genetic divergence between taxa. The K2P model was preferred over more complex and fitting models in order to ensure
comparability of the results with those of published literature and other species delimitation analyses (Del Pasqua et al., 2018).
In the program DNASP 5.10 (Librado & Rozas, 2009), metrics of genetic diversity within populations of at least three sequences per region and species were estimated by computing indices such as number of haplotypes (H), haplotype diversity (Hd), and nucleotide diversity (π).
To test for departure from neutrality, Fu (1997),Tajima (1989)and mismatch distribution were computed in ARLEQUIN 3.5 (Excoffier & Lischer, 2010) for three different spatial scales (population, region and species). The mismatch distribution was tested against the predicted outcome of the models under demographic and spatial expansion in order to give further support to the neutrality tests. Departure from neutrality as well as demographic and spatial expansion would support the hypothesis of
neocosmopolitanism whereas stability would support an eucosmopolitan scenario.
Fixation indices were used to analyze genetic differentiation between populations (Fst),
among regions of populations (Fct), and among populations within regions (Fsc;
Wright, 1949). The Fst values were visualized in non-metric multidimensional scaling (nMDS) plots for each species in PRIMER 6 (v. 1.0.3). The significance of uncorrected pairwise Fst values were tested by performing 10,100 permutations in ARLEQUIN with the null hypothesis of no differentiation.
In order to test for a possible differentiation among regions or populations, one-way and two-way analyses of molecular variance (AMOVA;Excoffier, Smouse & Quattro, 1992) were performed in ARLEQUIN with 10,100 permutations for each species. A high degree of differentiation would suggest low connectivity and low genetic flow between populations, disproving the hypothesis of a neocosmopolitan distribution.
As possible differences between populations can be related to the remoteness of some locations, the relationship between geographic and genetic distances was tested with a Mantel test implemented in Alleles in Space (AIS;Miller, 2005) with 10,000 permutations.
Geographic distances were calculated between coordinates regardless of geographic barriers (such as continents, currents). This was set to provide good approximation and strength to the other tests and to exclude simple spatial correlation.
In addition to a putative poor differentiation, a high degree of migration between populations can provide further information on the present connectivity between populations, supporting a neocosmopolitan scenario. Migration rate among regions was assessed using MIGRATE-N 3.6.11 (Beerli, 2006) on the CIPRES Science Gateway (Miller, Pfeiffer & Schwartz, 2010). By using a coalescent approach and Bayesian Markov chain Monte Carlo (MCMC) method, MIGRATE-N quantified both population size (θ= 2Nem for haploid mtDNA) and migration rate (M = m/m). The product is the number of effective migrants per generation (2Nem). The probabilities were estimated using 10 replicates, wherein each replicate was run for 50,000,000 generations and sampled every 1,000 steps, thereby recording a total of 50,000 steps. Each replicate included four MCMC chains with relative temperatures of 1.0, 1.5, 3.0 and 100,000. Convergence was assessed to ensure that the effective sample size (ESS) was higher than 200. Migration rates were only considered when 95% of the confidence intervals (CIs) were different from zero.
A haplotype network was computed for each species using an alignment of 372 sequences and 636 bp forJ. marmorata, and 85 sequences and 595 bp forJ. slatteryiwith the median-joining method (Bandelt, Forster & Röhl, 1999) in the software Popart (v. 1.7).
Phylogenetic analyses and ancestral range estimations
Phylogenetic relationships among theJassaspecies were reconstructed using only unique haplotypes with maximum likelihood (ML) and Bayesian inference (BI) of the CO1 gene fragment. The ML was inferred with PhyML (Guindon et al., 2010) using 1,000 bootstraps for the branch support. The best substitution model (GTR + I + G) was tested with the SMS routine in PhyML using both AIC and BIC as optimality criteria (Lefort, Longueville & Gascuel, 2017).
A time-calibrated BI phylogeny was reconstructed in BEAST 2.5.2 (Bouckaert et al., 2014) on XSEDE (Towns et al., 2014). The GTR model of evolution, with proportion
of invariant (I) and gamma shape parameters (G), determined with bModelTest (Bouckaert & Drummond, 2017), and the Yule speciation model were set for priors.
An uncorrelated relaxed clock with log-normal distribution was applied following the specifications proposed byCopilaş-Ciocianu, Sidorov & Gontcharov (2019); that is, rates ranged from 0.7% to 1.7% Ma−1with a starting value of 1.2%. Three runs each of 20,000,000 iterations of MCMC sampled each 1,000 iterations were performed. All runs were examined using Tracer v1.7.1 and all sampled parameters achieved sufficient sample sizes (ESS > 200). Tree files were combined using LogCombiner on XSEDE (1.8.4) with 15% of burn-in. The maximum clade credibility tree was generated using TreeAnnotator on XSEDE. All the XSEDE analyses were performed on the CIPRES Science Gateway (Miller, Pfeiffer & Schwartz, 2010).
The ancestral ranges of the haplotypes were estimated with the R package BioGeoBears (Matzke, 2013;R Development Core Team, 2018). This package is used to perform biogeographic inferences such as the estimation of ancestral ranges of species or Operational Taxonomic Units (OTUs) under different hypotheses (e.g., dispersion, founder-event speciation). Furthermore, BioGeoBears allows for the implementation of a third parameter (J) which permits a“jump speciation”in the daughter lineage, resulting in a possible different area from the direct ancestor. This feature accounts for the biology ofJassaspecies in this study by virtually including anthropogenic dispersal. The analyses were run using the DEC and DEC+J models (Matzke, 2014) and a maximum offive (J. marmorata) and four (J. slatteryi) areas of possible occurence as this was the maximum number of regions where a single haplotype was found for each species respectively.
In order to avoid overinterpretation, only the nodes with at least 70% of bootstrap support and 90% of posterior probabilities were considered. The best-fitting model was selected based on Akaike’s information criterion (AIC).
RESULTS
The distance between species was 15.2% ± 1.7 and the average distance within species accounted 0.17% ± 0.07 forJ. marmorataand 0.57% ± 0.17 forJ. slatteryi.
Genetic diversity and population structure
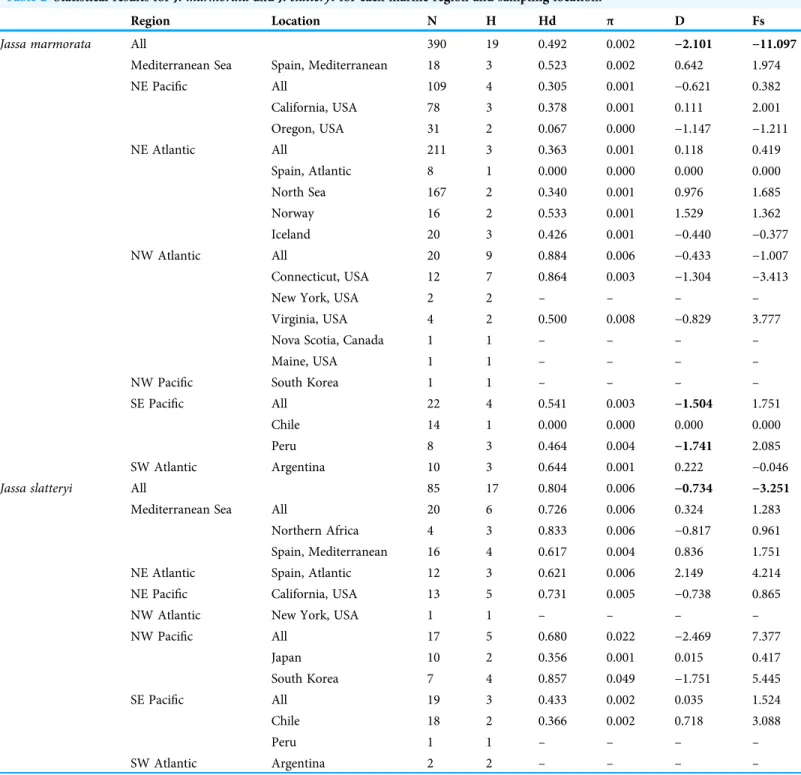
The alignment consisted of CO1 sequences from 475 individuals (Table S1). Across the entire data set, 110 sites were identified as polymorphic, 15 were singletons, and 95 were parsimony informative (comprising 36 unique haplotypes). With respect to the overall genetic diversity (all regions combined),J. marmorata(19 haplotypes) exhibited lower haplotype diversity (Hd = 0.492) and lower nucleotide diversity (π= 0.002) thanJ. slatteryi (17 haplotypes; Hd = 0.804;π= 0.006) (Table 2).
WithinJ. marmorata, the haplotype diversity was variable throughout marine regions, ranging from 0.884 in the NW Atlantic region, to 0.305 in the NE Pacific region.
Nucleotide diversity was low among the regions, ranging fromπ= 0.001 in the NE Atlantic toπ= 0.006 in the NW Atlantic region.
The haplotype diversity ofJ. slatteryialso exhibited a wide range. The highest regional value of Hd = 0.731 occurred in the NE Pacific (California) while the lowest was detected in the SE Pacific (Hd = 0.433). Nucleotide diversity ranged fromπ= 0.022 in the NW Pacific toπ= 0.002 in the SE Pacific (Table 2).
Table 2 Statistical results forJ. marmorataandJ. slatteryifor each marine region and sampling location.
Region Location N H Hd π D Fs
Jassa marmorata All 390 19 0.492 0.002 −2.101 −11.097
Mediterranean Sea Spain, Mediterranean 18 3 0.523 0.002 0.642 1.974
NE Pacific All 109 4 0.305 0.001 −0.621 0.382
California, USA 78 3 0.378 0.001 0.111 2.001
Oregon, USA 31 2 0.067 0.000 −1.147 −1.211
NE Atlantic All 211 3 0.363 0.001 0.118 0.419
Spain, Atlantic 8 1 0.000 0.000 0.000 0.000
North Sea 167 2 0.340 0.001 0.976 1.685
Norway 16 2 0.533 0.001 1.529 1.362
Iceland 20 3 0.426 0.001 −0.440 −0.377
NW Atlantic All 20 9 0.884 0.006 −0.433 −1.007
Connecticut, USA 12 7 0.864 0.003 −1.304 −3.413
New York, USA 2 2 – – – –
Virginia, USA 4 2 0.500 0.008 −0.829 3.777
Nova Scotia, Canada 1 1 – – – –
Maine, USA 1 1 – – – –
NW Pacific South Korea 1 1 – – – –
SE Pacific All 22 4 0.541 0.003 −1.504 1.751
Chile 14 1 0.000 0.000 0.000 0.000
Peru 8 3 0.464 0.004 −1.741 2.085
SW Atlantic Argentina 10 3 0.644 0.001 0.222 −0.046
Jassa slatteryi All 85 17 0.804 0.006 −0.734 −3.251
Mediterranean Sea All 20 6 0.726 0.006 0.324 1.283
Northern Africa 4 3 0.833 0.006 −0.817 0.961
Spain, Mediterranean 16 4 0.617 0.004 0.836 1.751
NE Atlantic Spain, Atlantic 12 3 0.621 0.006 2.149 4.214
NE Pacific California, USA 13 5 0.731 0.005 −0.738 0.865
NW Atlantic New York, USA 1 1 – – – –
NW Pacific All 17 5 0.680 0.022 −2.469 7.377
Japan 10 2 0.356 0.001 0.015 0.417
South Korea 7 4 0.857 0.049 −1.751 5.445
SE Pacific All 19 3 0.433 0.002 0.035 1.524
Chile 18 2 0.366 0.002 0.718 3.088
Peru 1 1 – – – –
SW Atlantic Argentina 2 2 – – – –
Note:
Total number of specimens (N), number of haplotypes (H), haplotype diversity (Hd), nucleotide diversity (π), Tajima’s D (D) and Fu’s Fs (Fs). Significant results are highlighted in bold (D confidence level <5%; Fs confidence level <2%).“−”= population with less than three specimens.
Demographic analysis
Tajima’sDvalues were negative and significant for each respective species in total; this indicates an excess of rare nucleotide site variants which suggests a departure from the Wright-Fisher neutral model (Wright, 1931;Table 2). The Fu’sFStest, which is based on the distribution of haplotypes, showed a significant negative value forJ. marmoratain total, indicating an excess of rare haplotypes.
The mismatch distribution analysis was in concordance withDand Fs results, for the two species, which supports the spatial and demographic expansion scenarios for both species (Table S2; SSD and Raggedness index).
Jassa marmorata did not display departure from the null hypothesis of demographic expansion for any other region except for Peru and the Northern European Seas where no significant spatial expansion was detected (Table S2; SSD and Raggedness index).
In contrast,J. slatteryidisplayed a significant deviation from the null model of
demographic expansion for the Mediterranean Sea as well as the North and South East Pacific, whereas there was no significance for a spatial expansion (Table S2; SSD and Raggedness index).
Geographical structure
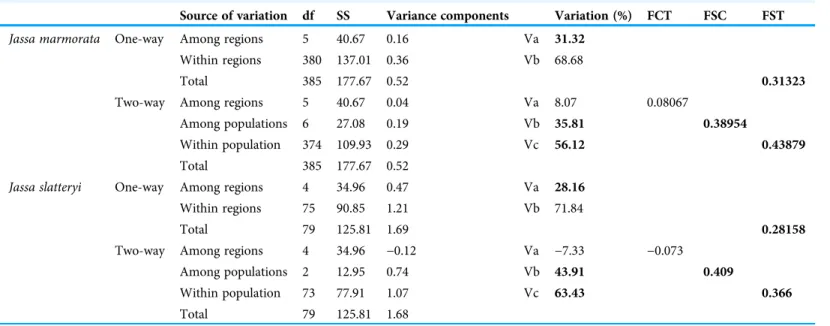
The one-way AMOVA revealed significant differences among regions for both species.
However, when exploring the variation among populations in the two-way test, the within-region variation was not significant (Table 3). While the main contribution to molecular variance was found within populations, the variation among populations within the same regions was also significant in both species.
In J. marmorata, specimens from the SW Atlantic showed the highest level of differentiation within NE Pacific and Northern European seas (Fst = 0.71 and 0.81
Table 3 Statistical results of AMOVA tests forJ. marmorataandJ. slatteryi.
Source of variation df SS Variance components Variation (%) FCT FSC FST
Jassa marmorata One-way Among regions 5 40.67 0.16 Va 31.32
Within regions 380 137.01 0.36 Vb 68.68
Total 385 177.67 0.52 0.31323
Two-way Among regions 5 40.67 0.04 Va 8.07 0.08067
Among populations 6 27.08 0.19 Vb 35.81 0.38954
Within population 374 109.93 0.29 Vc 56.12 0.43879
Total 385 177.67 0.52
Jassa slatteryi One-way Among regions 4 34.96 0.47 Va 28.16
Within regions 75 90.85 1.21 Vb 71.84
Total 79 125.81 1.69 0.28158
Two-way Among regions 4 34.96 −0.12 Va −7.33 −0.073
Among populations 2 12.95 0.74 Vb 43.91 0.409
Within population 73 77.91 1.07 Vc 63.43 0.366
Total 79 125.81 1.68
Note:
Significant results (p< 0.005) are highlighted in bold.
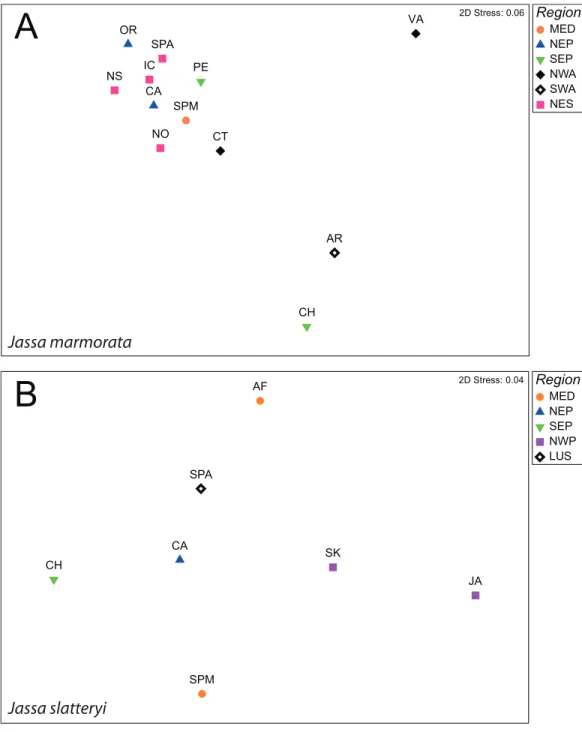
respectively). In the comparison of populations, two main groups were distinguished withinJ. marmorata: a general group with the majority of the populations, and another with Argentina and Chile. The Virginia population showed the highest average differentiation and appeared to be an outgroup (average Fst = 0.776;Fig. 1;
Tables S3andS4).
Region
MED NEP SEP NWA SWA SPM NES
CA OR
SPA NS
NO IC
CT
VA
CH PE
AR
2D Stress: 0.06
Region
MED NEP SEP NWP LUS
SPM
AF
CA SPA
CH
JA SK
2D Stress: 0.04
Jassa marmorata
Jassa slatteryi
A
B
Figure 1 nMDS plots of Fst values between populations J. marmorata (A) andJ. slatteryi (B).
Abbreviations: MED = Mediterranean Sea, NEP = North East Pacific, SEP = South East Pacific, NWA = North West Atlantic, SWA = South West Atlantic, NES = Northern European seas, LUS = Iberian Peninsula. Full-size DOI: 10.7717/peerj.9613/fig-1
Jassa slatteryishowed an overall low level of differentiation on the regional scale which was only significant for the comparison between Lusitania (Atlantic Spain) and the NE Pacific (California) (Tables S3andS4). Moreover, there was no obvious pattern with Japan which displayed the highest average Fst (Fst = 0.576;Fig. 1;Table S4).
For both species, only few migration rates met the assumptions (95% CI > 0;Table S5) and were considered in the migration model among regions. The migration between populations displayed contrasting patterns. InJ. marmorata, no emigration was observed from Chile, but from almost every other population. In contrast, for Connecticut and Virginia there was only one population donor although multiple receivers were detected (Fig. 2;Tables S5andS6).
ForJ. slatteryi, neither immigration nor emigration for Mediterranean samples (Spain) and for the NW Pacific populations met the assumptions of the migration model;
conversely, more emigrants were found from South Korea to Japan (Fig. 2;Table S5).
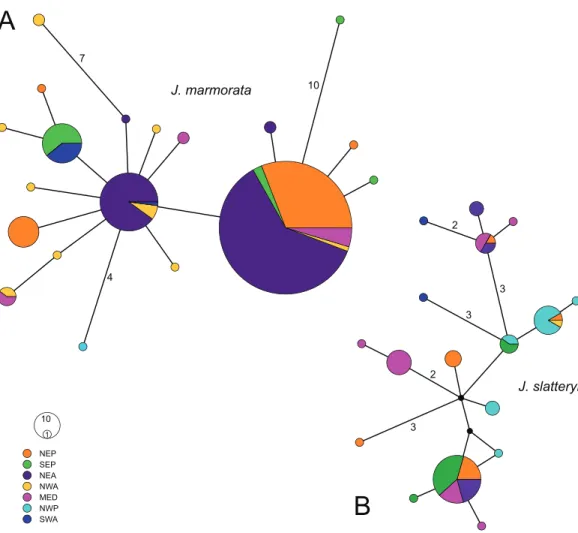
The haplotype network ofJ. marmoratawas star-like with two main haplotypes, one of which occurred in almost every region sampled except the NW Pacific and SW Atlantic (Fig. 3). The second abundant haplotype occurred mostly in the NE Atlantic with additional records from the NW and SW Atlantic. Moreover, only three haplotypes were separated by more than two mutations from either of the two central haplotypes (i.e., SE
0.59 0.67
0.67
0.74
0.69 0.69
0.79
J. marmorata J. slatteryi
Figure 2 World map with highest significant migration rates.Rates among populations of J. mar- morata(black) andJ. slatteryi(purple) from non-adjacent marine regions. Symbols indicate sampling localities for each species made for this study (i.e., excluding sampling localities of previously published sequences). Patterned areas indicate the putative native ranges ofJ. mamrorata(continuous black line) in the North West Atlantic and ofJ. slatteryi(dashed purple lines) in the North Pacific.
Full-size DOI: 10.7717/peerj.9613/fig-2
Pacific: 10, NW Atlantic: 8, NW Pacific: 4), while the highest distance was observed between SE Pacific and NW Atlantic haplotypes (19 steps). On the other hand, the network ofJ. slatteryiwas much more dispersed in comparison and did not show any clear pattern of (geographic) segregation but included multiple missing haplotypes and three haplotypes which were present in more than two regions (Fig. 3).
There was no significant correlation between genetic and geographic distances in either J. marmorataor J. slatteryi(p> 0.1).
The phylogeny was poorly resolved, showing high support (posterior probabilities = 1;
bootstrap support > 95) for the cluster groupingJ. mamrorata andJ. slatteryias well as each species (Fig. S1).
The DEC+J model significantly increased the likelihood of the DEC model in both J. marmorata(InL: DEC+J = −109.76; DEC =−153.97) andJ. slatteryi(InL: DEC+J =
−58.45; DEC =−78.23) (Table S7).
(1) (1)
(1) (1)
( (1)
(1)
10 1 NEP SEP NEA NWAMED NWP SWA
4 7
10
3 2
3
2
3
J. marmorata
J. slatteryi
A
B
Figure 3 Median joining haplotype networks ofJ. marmorata (A) andJ. slatteryi(B).Size of the circles are proportional to the number of specimens with relative haplotype. Black dots represent missing haplotypes, more than one mutation is reported with numbers. Abbreviations: NEP = North East Pacific, SEP = South East Pacific, NEA = North East Atlantic, NWA = North West Atlantic, MED = Medi- terranean Sea, NWP = North West Pacific, SWA = South West Atlantic.
Full-size DOI: 10.7717/peerj.9613/fig-3
In J. marmorata, while the reconstruction of the most recent common ancestor’s (MRCA of all the haplotypes) geographic range was inconclusive, it seemed to exclude the Mediterranean Sea and SW Atlantic but an ancestral divergence of a clade in the NW Atlantic was evident (Fig. S2).
Similar toJ. marmorata, it was not possible to determine the ancestral geographic range of the MRCA ofJ. slatteryieven though in the Pacific it appeared to be comparatively more diverse. One clade was restricted to the Mediterranean Sea (Fig. S3).
DISCUSSION
Using the molecular mitochondrial marker CO1, we were able to reconstruct putative native regions (i.e., prior to their“ancient invasion”) of two cosmopolitan amphipods that are common elements of marine biofouling. The examination of the genetic variability between these two species in our analyses indicated high levels of intraspecific divergence within theJ. slatteryipopulations, as well as comparable variation within populations and among populations within regions for J. marmorata. A high haplotype number was detected withinJ. slatteryiwhen compared toJ. marmorata, and at least two main haplotypes within each species were shared among several geographic populations.
Genetic population structure and connectivity of J. marmorata The results indicated that the overall percentage of variation present inJ. marmorata populations was derived almost equally from both variation within populations and variation among populations within marine regions. The highest genetic diversity (accounting for both haplotype and nucleotide diversity values) was found in the NW Atlantic region, and the lowest occurred in the NE Pacific region.
Previous research involvingJ. marmoratasamples taken from assumed potential source populations along the Atlantic coast of the United Stated showed varying results: one population from coastal Connecticut revealed no genetic diversity at all in the population, whereas the samples analyzed from coastal South Carolina were shown to have been derived from a separateJassaspecies-level lineage (Pilgrim & Darling, 2010; J. Beermann, A. Desiderato, 2019–2020, personal observation). Pacific North American coast
populations ofJ. marmorataare classified as invasive and are assumed to be transfers from its native range of the Atlantic coast of North America (Chapman, 2007;Conlan, 1990).
In contrast to Pilgrim & Darling (2010), the results of the current study showed high genetic diversity in the presumed native range ofJ. marmorataas well as in populations from the SW Atlantic region. Nevertheless, the presence of a shared haplotype between the SW Atlantic and the SE Pacific region could signal a connection between the two. This is in accordance with the recentfirst record ofJ. marmoratain Argentina (De Pina, 2005).
Given that introduction events transfer only a subset of native genetic diversity, invasive populations are frequently seen to exhibit lower diversity than the native source populations (Dlugosch & Parker, 2008). The gene pool of introduced populations is expected to be limited due to the stochastic process of introduction mechanisms (Holland, 2000).J. marmorata’s low genetic diversity in the NE Pacific is thus consistent with this expected founder effect (Pilgrim & Darling, 2010). Overall haplotype and genetic
diversity were lower inJ. marmoratapopulations when compared toJ. slatteryi populations despite a larger sample size. The overall genetic diversity ofJ. marmorata populations was characterized by high haplotype diversity and low nucleotide diversity, indicating only small differences between haplotypes. This is evident from the minimum spanning haplotype network which showed mostly single nucleotide differences between haplotypes inJ. marmorata.
The obtained data for J. marmorataindicated differing levels of geographic structure within the sampled populations; there appeared to be substantial geographic structure within some populations (e.g., Virginia, Chile, Argentina, New York, the North Sea and Oregon) whereas other populations were less structured (Spanish Mediterranean coast and Connecticut). These high levels of structure suggest a more limited gene flow or different selective pressures. Some J. marmoratapopulations were not panmictic
throughout a marine region, but displayed high Fst values, indicating an absence of genetic connectivity between them. Populations from Chile-Peru as well as Connecticut-Virginia, on the other hand, could each be assigned to the same marine regions, and were
characterized by high heterozygosity values.J. marmoratapopulations from California and Oregon exhibited genetic connectivity with populations in Norway and Iceland, which is unlikely to result from natural dispersal. Furthermore, negative Tajima’s D, Fu’s Fs statistics, as well as the results of the mismatch distributions forJ. marmorataindicated a population size expansion, perhaps after a bottleneck. It can be assumed that the amount of samples was rather limited considering that the genetic diversity of these populations has probably been shaped largely by stochastic events. A lack of samples from entire marine regions remains an open issue that impedes clear inferences on the connectivity of globally distributed populations.
Genetic population structure and connectivity of J. slatteryi
The magnitude of genetic variation withinJ. slatteryiwas highest within populations and lowest among marine regions. InJ. slatteryi, there was discordance between haplotype and nucleotide diversity. Haplotype diversity was higher in the Mediterranean Sea and the NE Pacific whereas nucleotide diversity was higher in the NW Pacific. The lowest genetic diversity was found in the SE Pacific region.
Jassa slatteryihad been previously considered to be either cryptogenic or introduced to the NE Pacific (Boyd, Mulligan & Shaughnessy, 2002). Populations ofJ. slatteryifrom the Pacific North American coast had been found to show similar genetic diversity indices, haplotype diversity measures, and intraspecific genetic distances as the presumed native species from that region,J. staudei(Chapman, 2007;Pilgrim & Darling, 2010). Both species exhibited diversity measures much higher thanJ. marmoratain the same area. The authors suggested that perhaps the Pacific coast of North America could represent the native range ofJ. slatteryieven though their study was geographically restricted to the continental U.S. coasts.
Our results corroborate the previous assumption thatJ. slatteryioriginated from Northern Pacific regions (NE and NW). Surprisingly, there was also high genetic diversity in the populations from the Mediterranean Sea region. The highly divergent haplotypes
found in the Mediterranean Sea and the private haplotypes from the SW Atlantic might be artifacts due to small sample sizes and a resulting undersampling in the putative native regions due to the nature of our opportunistic sampling campaign. The overall genetic diversity ofJ. slatteryipopulations was different from that of theJ. marmoratapopulations as the overall nucleotide diversity was higher, indicating larger differences between haplotypes. This was displayed by the haplotype network where the respective haplotypes were separated by more mutations than inJ. marmorata.
Populations ofJ. slatteryialso varied in their level of geographic structure, ranging from highly structured populations (Japan) to lower levels of structure (California, Spanish Atlantic coast, Chile and South Korea) and higher geneflow between populations.
In contrast to J. marmoratapopulations which showed only limited or no geneflow between populations of the same marine region,J. slatteryipopulations did not reflect this structure between populations within the same regions. Furthermore, ourfindings indicate geneflow between geographically remote populations over large distances which is highly unlikely via natural dispersal (e.g., Mediterranean and Spanish Atlantic coasts with South Korea and/or Chile). The mismatch distribution for J. slatteryisuggested a geographic expansion but not a demographic expansion.
We identified potential connectivity and dispersal differences between J. marmorata andJ. slatteryipopulations in regions where both species co-occurred.J. slatteryi
populations in Chile, California, South Korea, the Spanish Atlantic and the Mediterranean coasts were particularly closely related to each other (evident by very low Fst values), whereas theJ. marmoratapopulation from Chile showed more structure with very little geneflow between this and other populations. The Fst values also indicated that, for example, while there is measurable geneflow betweenJ. marmoratapopulations from the neighboring regions of Chile and Argentina, populations ofJ. slatteryifrom the same regions are not panmictic. However, bothJassaspecies showed evidence of geneflow between the Mediterranean coast of Spain and California. BothJ. marmorataand J. slatteryiexhibited high haplotype diversity and low nucleotide diversity, indicating rapid demographic expansion from a small effective population size (i.e., contrasting the mismatch results inJ. slatteryi;Avise, 2000).
The scenario of ongoing dispersal and continuous input of new propagules in different marine regions all over the world is also supported by the inconclusive results of the ancestral range reconstruction of both species, confirming these species’true identities as
“neocosmopolitans”.
Origin and possible pathways of introduction
Maritime shipping over the past centuries has facilitated dispersal of attached fouling species on the hulls of vessels, and for the last 100± years, transported larvae and other propagules in ballast water around the world. Consequently, this facilitates geneflow between populations, particularly those with non-planktonic larvae (Carlton & Hodder, 1995;Carlton, 1985,1987;Williams et al., 1988). These unintentional introductions have increased rapidly in recent decades as transit times have diminished, ship-carried trade has become globalized, and ballast-water volumes have risen (Carlton & Geller, 1993;
Ruiz et al., 1997;Williams & Grosholz, 2008). Despite the increase in introduction of non-native species by means of maritime traffic, shipping pathways for species dispersal remains poorly understood on a global scale (Mack et al., 2000).Seebens et al. (2013) identified major shipping routes that are high-risk pathways for bioinvasions and also determined that the highest invasion risks were concentrated in a small number of ports.
These invasion pathways help explain the geographic distribution of theJassapopulations in our study.
The ability ofJassato build tubes on anthropogenic substrata and the absence of planktonic larval stages are excellent prerequisites for human-mediated transport by ships.
Accordingly, specimens of bothJ. marmorataandJ. slatteryihave been reported from hull fouling of ships and boats in different parts of the world (Castro et al., 2020;Martínez- Laiz et al., 2019;Peters, Sink & Robinson, 2019).J. marmorata has long been recognized in the literature from worldwide locations (Marchini & Cardeccia, 2017). Although the native origin ofJ. marmoratawas uncertain, the worldwide distribution of currently knownJassaspecies indicated that it could be native to the NW Atlantic region where J. marmorataoccurs as the only species of the genus (Conlan, 1990;Marchini & Cardeccia, 2017). This hypothesis is supported by ourfindings. Although alreadyConlan (1990)noted a wide global distribution ofJ. slatteryi, records of this species after Conlan’s original description have increasingly been reported in the past recent years—for example, from Europe (Bonifazi, Mancini & Ventura, 2018;Gouillieux, 2017) or South America (Rumbold et al., 2015). This is probably due to an increasing awareness of this group’s taxonomy, which is corroborated by the standardized utilization of DNA barcoding for species identification. Hence,J. slatteryihad been classified as cryptogenic species with uncertain native origin (Marchini & Cardeccia, 2017) but ourfindings indicate that the species’likely former native range is the Northern Pacific.
Jassaspecies were most probably transported by ship traffic between NE Atlantic ports and ports in South America (e.g., Argentina, Chile, Peru). The results of this study indicate that these shipping routes played a major role for the establishment of both J. marmorataandJ. slatteryipopulations in the SE Pacific and SW Atlantic regions.
The models ofSeebens et al. (2013)also suggest that although the northern European Seas (NE Atlantic in our study) are recently most strongly connected to tropical and subtropical ecosystems in terms of marine traffic, with the adjacent NW Atlantic waters providing similar enough climatic conditions. Therefore, the North American Atlantic coast still dominates as the major source region of invasions into the NE Atlantic for coastal benthic species. The northern Pacific waters are also source regions for invasions to the NE Atlantic. This could explain the presence of bothJ. marmorataandJ. slatteryiin the NE Atlantic region. Our data indicate bothJassaspecies occur along the West and East coast of the United States, which is likely due to the connection of both coasts via shipping routes through the Panama Canal. This high invasion risk canal is also passage for shipping routes to and from the NE Atlantic regions (Seebens et al., 2013). TheJassa populations from Argentina could have been transported there by way of the Spanish Atlantic and Mediterranean coast, as well as North Africa, and there is a high invasion probability between the NE Pacific region and the SE Pacific region (e.g., Peru and Chile).
CONCLUSIONS
As a result of speculative knowledge of“ancient”invasion events and historically unsettled taxonomy, we cannot determine with certainty through which series of events theseJassa species achieved their neocosmopolitan distribution. It is most likely that the species’
distributions are a result of human-mediated introductions which started centuries ago.
Ourfindings indicate that the likely former native range ofJ. marmorata is the NW Atlantic region, and the likely former native range ofJ. slatteryiis the Northern Pacific (NW and NE) region. Due to the relatively fast travel speeds, extensive surface area, and independence of stochastic ocean currents (Haydar, 2012), shipping still appears to be the more successful vector ofJassaspecies dispersal on a global scale as compared to natural dispersal on a local level (e.g., rafting or drifting;Thiel & Haye, 2006). As with these two successful biofoulers, the occurrence of many other coastal benthic species with wide modern geographic distributions is probably the result of human shipping activities over the last centuries.
ACKNOWLEDGEMENTS
We express our deepest gratitude to the many colleagues, and PERU LNG S.R.L. and their Biodiversity Monitoring and Assessment Program (BMAP), who provided us with material for use in this study (in alphabetical order): Pedro Domingues (Instituto Español de Oceanografia, Spain), Victoria Fernández-Gonzalez (University of Alicante, Spain), José Guerra-García (University of Sevilla, Spain), Analí Jiménez Campeán (Instituto del Mar del Peru, Peru), Simon Jungblut (University of Bremen, Germany), Young-Hyo Kim (Dankook University, South Korea), Masafumi Kodama (University of Tokyo, Japan), Agnese Marchini (University of Pavia, Italy), Carlos Rumbold (Universidad Nacional de la Patagonia Austral, Argentina), Jörundur Svavarsson (University of Iceland, Iceland) and Martin Thiel (Universidad Catolica del Norte, Chile). We further thank Michał Grabowski and Tomasz Mamos (both University ofŁodz, Poland) as well as Pieternella Luttikhuizen (NIOZ, The Netherlands) who provided valuable advice on the molecular analyses. Samples from North Sea offshore structures were collected by Roland Krone (Germany). We thank James T. Carlton, Agnese Marchini and an anonymous reviewer for their constructive comments on an earlier version of the manuscript that substantially improved its quality.
ADDITIONAL INFORMATION AND DECLARATIONS
Funding
Charlotte Havermans was funded by the Deutsche Forschungsgemeinschaft (DFG, German Science Foundation) with the projects HA7627/1-1 and HA7627/1-2 within the Priority Programme 1158 on Antarctic Research with Comparable Investigations in Arctic Sea Ice. Joop Coolen, Richard Crooijmans and Bert Dibbits were funded by the NWO Domain Applied and Engineering Sciences under Grant 14494 and by the UK oil and gas project RECON (INSITE Foundation Phase I). Andrea Desiderato was funded by the Conselho Nacional de Desenvolvimento Cientifico e Tecnologico (CNPq) through a PhD
grant (process no. 141565/2017-9) and by a research grant of the Deutscher Akademischer Austauschdienst (DAAD, German Academic Exchange Service). The funders had no role in study design, data collection and analysis, decision to publish, or preparation of the manuscript.
Grant Disclosures
The following grant information was disclosed by the authors:
Deutsche Forschungsgemeinschaft (DFG, German Science Foundation): HA7627/1-1 and HA7627/1-2.
NWO Domain Applied and Engineering Sciences: 14494.
Conselho Nacional de Desenvolvimento Cientifico e Tecnologico (CNPq): 141565/2017-9.
Deutscher Akademischer Austauschdienst (DAAD, German Academic Exchange Service).
Competing Interests
The authors declare that they have no competing interests.
Author Contributions
Jan Beermann conceived and designed the experiments, performed the experiments, preparedfigures and/or tables, authored or reviewed drafts of the paper, and approved thefinal draft.
Allison K. Hall-Mullen performed the experiments, authored or reviewed drafts of the paper, and approved thefinal draft.
Charlotte Havermans performed the experiments, authored or reviewed drafts of the paper, and approved thefinal draft.
Joop W.P. Coolen performed the experiments, authored or reviewed drafts of the paper, and approved thefinal draft.
Richard P.M.A. Crooijmans performed the experiments, authored or reviewed drafts of the paper, and approved thefinal draft.
Bert Dibbits performed the experiments, authored or reviewed drafts of the paper, and approved thefinal draft.
Christoph Held performed the experiments, authored or reviewed drafts of the paper, and approved thefinal draft.
Andrea Desiderato analyzed the data, preparedfigures and/or tables, authored or reviewed drafts of the paper, and approved thefinal draft.
Data Availability
The following information was supplied regarding data availability:
DNA barcode data from all genetically analyzed specimens are available in the“JASSA”
project at BOLD (DOI 10.5883/DS-JASSA).
All sequence data are also available in aSupplemental File. An overview of all used sequences is available inTable S1including the repository, locality, accession numbers, and references.
Supplemental Information
Supplemental information for this article can be found online athttp://dx.doi.org/10.7717/
peerj.9613#supplemental-information.
REFERENCES
Ashton GV, Willis KJ, Cook EJ, Burrows M. 2007.Global distribution of the Japanese skeleton shrimp,Caprella muticaSchurin, 1935 (Crustacea, Amphipoda, Caprellidae) with a detailed account of the distribution in Scotland, U.K.Hydrobiologia590(1):31–41
DOI 10.1007/s10750-007-0754-y.
Avise JC. 2000.Phylogeography: the history and formation of species. Cambridge: Harvard University Press.
Bandelt H-J, Forster P, Röhl A. 1999.Median-joining networks for inferring intraspecific phylogenies.Molecular Biology and Evolution16(1):37–48
DOI 10.1093/oxfordjournals.molbev.a026036.
Beerli P. 2006.Comparison of Bayesian and maximum-likelihood inference of population genetic parameters.Bioinformatics22(3):341–345DOI 10.1093/bioinformatics/bti803.
Beermann J. 2014.Spatial and seasonal population dynamics of sympatricJassaspecies (Crustacea, Amphipoda).Journal of Experimental Marine Biology and Ecology459:8–16
DOI 10.1016/j.jembe.2014.05.008.
Boissin E, Hurley B, Wingfield MJ, Vasaitis R, Stenlid J, Davis C, De Groot P, Ahumada R, Carnegie A, Goldarazena A, Klasmer P, Wermelinger B, Slippers B. 2012.Retracing the routes of introduction of invasive species: the case of theSirex noctiliowoodwasp.
Molecular Ecology21(23):5728–5744DOI 10.1111/mec.12065.
Bonifazi A, Mancini E, Ventura D. 2018.First record of the invasive and cryptogenic speciesJassa slatteryi(Crustacea: Amphipoda) in Italian coastal waters.Journal of Sea Research136:37–41 DOI 10.1016/j.seares.2018.03.005.
Bouckaert RR, Drummond AJ. 2017.bModelTest: Bayesian phylogenetic site model averaging and model comparison.BMC Evolutionary Biology17(1):42DOI 10.1186/s12862-017-0890-6.
Bouckaert R, Heled J, Kühnert D, Vaughan T, Wu C-H, Xie D, Suchard MA, Rambaut A, Drummond AJ. 2014.BEAST 2: a software platform for Bayesian evolutionary analysis.
PLOS Computational Biology10(4):e1003537DOI 10.1371/journal.pcbi.1003537.
Boyd MJ, Mulligan TJ, Shaughnessy FJ. 2002.Non-indigenous marine species of Humboldt Bay, California. Report to the California Department of Fish and Game.Available at http://humboldt-dspace.calstate.edu/handle/2148/463.
Carlton JT. 1985.Transoceanic and interoceanic dispersal of coastal marine organisms: the biology of ballast.Oceanography and Marine Biology: An Annual Review23:313–371.
Carlton JT. 1987.Patterns of transoceanic marine biological invasions in the Pacific Ocean.
Bulletin of Marine Science41:452–465.
Carlton JT, Geller JB. 1993.Ecological roulette: the global transport of nonindigenous marine organisms.Science261(5117):78–82DOI 10.1126/science.261.5117.78.
Carlton J, Hodder J. 1995.Biogeography and dispersal of coastal marine organisms: experimental studies on a replica of a 16th-century sailing vessel.Marine Biology121(4):721–730
DOI 10.1007/BF00349308.
Castro K, Giachetti C, Battini N, Bortolus A, Schwindt E. 2020.Cleaning by beaching:
introducing a new alternative for hull biofouling management in Argentina.Aquatic Invasions 15(1):63–80DOI 10.3391/ai.2020.15.1.05.
Chapman JW. 2007.Gammaridea. In: Carlton JT, ed.The Light and Smith Manual: Intertidal Invertebrates from Central California to Oregon. Fourth Edition. Berkeley: University of California Press.
Cohen AN, Carlton JT. 1998.Accelerating invasion rate in a highly invaded estuary.Science 279(5350):555–558DOI 10.1126/science.279.5350.555.
Conlan KE. 1989.Delayed reproduction and adult dimorphism in males of the amphipod genus Jassa(Corophioidea: Ischyroceridae): an explanation for systematic confusion.
Journal of Crustacean Biology9(4):601–625DOI 10.2307/1548592.
Conlan KE. 1990.Revision of the crustacean amphipod genusJassaLeach (Corophioidea:
Ischyroceridae).Canadian Journal of Zoology68(10):2031–2075DOI 10.1139/z90-288.
Coolen JW, Van Der Weide B, Cuperus J, Blomberg M, Van Moorsel GW, Faasse MA, Bos OG, Degraer S, Lindeboom HJ. 2018.Benthic biodiversity on old platforms, young wind farms, and rocky reefs.ICES Journal of Marine Science77(3):1250–1265DOI 10.1093/icesjms/fsy092.
Copilaş-Ciocianu D, Sidorov D, Gontcharov A. 2019.Adrift across tectonic plates: molecular phylogenetics supports the ancient Laurasian origin of old limnic crangonyctid amphipods.
Organisms Diversity & Evolution19(2):191–207DOI 10.1007/s13127-019-00401-7.
Darling JA, Carlton JT. 2018.A framework for understanding marine cosmopolitanism in the Anthropocene.Frontiers in Marine Science5:293DOI 10.3389/fmars.2018.00293.
De Pina GMA. 2005.A new species ofNotopomaLowry & Berents, 1996, and a new record ofJassa marmorataHolmes, 1903, from the southwestern Atlantic (Amphipoda: Corophiidea:
Ischyroceridae).Proceedings of the Biological Society of Washington118(3):528–539 DOI 10.2988/0006-324X(2005)118[528:ANSONL]2.0.CO;2.
Del Pasqua M, Schulze A, Tovar-Hernández MA, Keppel E, Lezzi M, Gambi MC, Giangrande A.
2018.Clarifying the taxonomic status of the alien speciesBranchiomma bairdiand
Branchiomma boholense(Annelida: Sabellidae) using molecular and morphological evidence.
PLOS ONE13(5):e0197104DOI 10.1371/journal.pone.0197104.
Dlugosch KM, Parker I. 2008.Founding events in species invasions: genetic variation, adaptive evolution, and the role of multiple introductions.Molecular Ecology17(1):431–449
DOI 10.1111/j.1365-294X.2007.03538.x.
Estoup A, Guillemaud T. 2010.Reconstructing routes of invasion using genetic data: why, how and so what?Molecular Ecology19(19):4113–4130DOI 10.1111/j.1365-294X.2010.04773.x.
Excoffier L, Lischer HE. 2010.Arlequin suite ver 3.5: a new series of programs to perform population genetics analyses under Linux and Windows.Molecular Ecology Resources 10(3):564–567DOI 10.1111/j.1755-0998.2010.02847.x.
Excoffier L, Smouse PE, Quattro JM. 1992.Analysis of molecular variance inferred from metric distances among DNA haplotypes: application to human mitochondrial DNA restriction data.
Genetics131:479–491.
Folmer O, Black M, Hoeh W, Lutz R, Vrijenhoek R. 1994.DNA primers for amplification of mitochondrial cytochrome c oxidase subunit I from diverse metazoan invertebrates.Molecular Marine Biology and Biotechnology3:294–299.
Franz DR. 1989.Population density and demography of a fouling community amphipod.Journal of Experimental Marine Biology and Ecology125(2):117–136
DOI 10.1016/0022-0981(89)90038-5.
Franz DR, Mohamed Y. 1989.Short-distance dispersal in a fouling community amphipod crustacean,Jassa marmorataHolmes.Journal of Experimental Marine Biology and Ecology 133(1–2):1–13DOI 10.1016/0022-0981(89)90154-8.