AQUATIC MICROBIAL ECOLOGY Aquat Microb Ecol Vol. 83: 95–108, 2019
https://doi.org/10.3354/ame01902 Published online June 6
1. INTRODUCTION
Oxygen minimum zones (OMZs) are defined as wa- ter masses with oxygen (O2) concentrations < 90 µmol O2kg−1(Karstensen et al. 2008, Paulmier & Ruiz-Pino 2009). Based on the O2concentration, OMZs are of- ten classified as hypoxic (< 60 µmol kg−1), suboxic (< 5 µmol kg−1) and anoxic (Karstensen et al. 2008, Gruber 2011). In the Baltic Sea, hypoxia has in - creased in the last century, mainly due to allochtho- nous nutrient inputs, subsequent build-up of organic matter and microbial respiration of organic matter (Carstensen et al. 2014, Andersen et al. 2017). Hence,
hypoxia in the Baltic Sea is closely coupled to nutrient concen trations. The input of nitrogen and phosphorus from sea, land and atmospheric deposition increased from 1850 to 1980 by 4- and 5-fold, respectively, and to date nutrient concentrations in the Baltic Sea hardly re flect the decrease in anthropogenic nutrient loads achieved in the re cent past (Gustafsson et al. 2012, Jutterström et al. 2014). Due to denitrification in sub- oxic zones, the Baltic Sea is losing some of the al - lochthonous dissolved inorganic nitrogen (DIN), sub - sequently leading to DIN deficiency relative to phosphorus. In contrast, nitrogen is fixed by auto- trophic cyanobacteria at the surface and by hetero-
© The authors 2019. Open Access under Creative Commons by Attribution Licence. Use, distribution and reproduction are un - restricted. Authors and original publication must be credited.
Publisher: Inter-Research · www.int-res.com
*Corresponding author: mmassmig@geomar.de
Potential role of oxygen and inorganic nutrients on microbial carbon turnover in the Baltic Sea
Marie Maßmig
1,*, Judith Piontek
1, 2, Frédéric A. C. Le Moigne
1, 3, Carolina Cisternas-Novoa
1, Anja Engel
11GEOMAR Helmholtz Centre for Ocean Research, 24105 Kiel, Germany
2Present address: Leibniz Institute for Baltic Sea Research Warnemünde, 18119 Rostock, Germany
3Present address: Mediterranean Institute of Oceanography, UM 110, Aix Marseille Univ., Université 6 de Toulon, CNRS, IRD, 13288, Marseille, France
ABSTRACT: Oxygen (O2) deficiency and nutrient concentrations in marine systems are impacting organisms from microbes to higher trophic levels. In coastal and enclosed seas, O2deficiency is often related to eutrophication and high degradation rates of organic matter. To investigate the impact of O2concentration on bacterial growth and the turnover of organic matter, we conducted multifactorial batch experiments with natural microbial communities of the central Baltic Sea.
Water was collected from suboxic (< 5 µmol l−1) depths in the Gotland Basin during June 2015.
Samples were kept for 4 d under fully oxygenated and low O2conditions (mean: 34 µmol l−1O2), with or without nutrient (ammonium, phosphate and nitrate) and labile carbon (glucose) amend- ments. We measured bacterial abundance, bacterial heterotrophic production, extracellular enzyme rates (leucine-aminopeptidase) and changes in dissolved and particulate organic carbon concentrations. Our results show that the bacterial turnover of organic matter was limited by nutri- ents under both oxic and low O2conditions. In nutrient- and glucose-replete treatments, low O2 concentrations significantly reduced the net uptake of dissolved organic carbon and led to greater accumulation of more labile dissolved organic matter. Our results therewith suggest that the com- bined effects of eutrophication and deoxygenation on heterotrophic bacterial activity might favor the accumulation of dissolved organic carbon in the Baltic Sea.
KEY WORDS: Oxygen · Heterotrophic bacteria · Baltic Sea · Organic matter · Bacterial heterotrophic production · Extracellular enzymes · Leucine-aminopeptidase
O
PENPENA
CCESSCCESStrophs at the chemocline in the Baltic Sea, and this process may counteract the loss of nitrogen (Larsson et al. 2001, Voss et al. 2005, Vahtera et al. 2007, Farnelid et al. 2013). The OMZs in the Baltic Sea prevail in the deep basins at 60 to 80 m due to permanent stratifica- tion induced by strong salinity gradients (Conley et al.
2009). Inflow events can episodically transport dense and oxygenated water from the North Sea into the Baltic Sea (Mohrholz et al. 2015). The high density of the inflowing North Sea water, however, restricts oxygenation to the bottom water of the basins (from 200 to 232 m). Therefore, intermediate waters (from 70 to 175 m) remain O2-depleted (e.g. Feistel et al.
2003). Only after strong inflow events (e.g. in 2014) can parts of the intermediate waters become oxy- genated (Dellwig et al. 2018).
Within the OMZs, prokaryotes have adapted to low O2 concentrations via anaerobic respiration path- ways (e.g. Lam & Kuypers 2011) and substrate- level phosphorylation (fermentation) (Madigan et al.
2012). Denitrification is the preferred anaerobic res- piration pathway because the energy yield is close to that of O2reduction. In the OMZs of the Baltic Sea, the availability of nitrate enables significant rates of denitrification (~22.5 nmol N l−1h−1) (Hietanen et al.
2012, Bonaglia et al. 2016). Another important anaer- obic respiration pathway, in the Baltic Sea, is dissim- ilatory nitrate reduction to ammonium (DNRA) (~0.67 nmol N l−1h−1), whereas anaerobic ammonium oxidation (anammox) occurs less frequently (Hieta- nen et al. 2012, Bonaglia et al. 2016).
A decrease of O2concentration and the expansion of OMZs have been predicted for the future ocean (Bopp et al. 2013, Schmidtko et al. 2017). It is still unknown how changes in O2 concentration affect bacterial cycling of organic matter. This includes the bacterial uptake of dissolved organic matter (DOM), its remineralization and its transformation to more refractory DOM (Jiao et al. 2010). The bacterial cycling of organic matter is related to the hydrolysis of high molecular weight (HMW) organic matter by extracellular enzymes (Hoppe et al. 2002) and the formation of bacterial biomass, which can then be transferred to higher trophic levels (Azam et al.
1983). Since anaerobic respiration has a lower energy yield than aerobic respiration (Lam & Kuypers 2011, Madigan et al. 2012), the overall turnover of organic matter might be reduced within OMZs. Several stud- ies found implications of reduced organic matter degradation under anoxia or suboxia compared to oxic conditions in marine waters and incubation ex - periments (Nguyen & Harvey 1997, Devol & Hartnett 2001, Van Mooy et al. 2002, Keil et al. 2016, Le
Moigne et al. 2017). Others observed similar degra- dation rates of organic matter in oxic and suboxic or anoxic waters (Lee 1992, Pantoja et al. 2009) and sug- gested, that the quality of the organic substrate rather than O2controls the degradation rate (Pantoja et al. 2009). In the Gotland Deep (Baltic Sea), labile carbon limitation may apply for denitrifying bacteria at the oxic-anoxic interface (Bonaglia et al. 2016).
Jørgensen et al. (1999) also showed seasonally alter- nating carbon and nitrogen limitation of bacteria in the Gulf of Riga. Hence, O2, carbon and nitrogen may be co-limiting or successively limiting microbial organic matter turnover in the Baltic Sea. However, studies that combine measurements of microbial rates and organic carbon turnover at different O2 concentrations are scarce.
Here, we tested the hypothesis of reduced bacterial organic matter turnover under low O2concentrations compared to fully oxygenated conditions. We investi- gated bacterial growth, bacterial production, extra- cellular enzyme rates and the turnover of organic carbon in natural microbial communities under low and saturating O2 concentrations in a multifactorial experiment.
2. MATERIALS AND METHODS 2.1. Experimental design and treatments Seawater was sampled in the central Baltic Sea, at the HELCOM stations BY15 in the Gotland Deep (57° 20’ N, 20° 30’ E) and BY21 in the Northern Got- land Basin (58° 26’ N, 20° 19’ E). Samples were taken on 8 and 14 June 2015 during the research cruise AL458 (with RV ‘Alkor’). Hydrographic conditions were recorded by CTD (Hydrobios) casts, including measurements of O2 concentration with the Oxy - guard (PreSens) sensor (see below for details) and revealed a permanent stratification at both stations with OMZs below the pycnocline. Seawater was sampled from the O2 minimum (2−3 µmol l−1) at 110 m to incubate natural microbial communities that had been ex posed and adapted to suboxia prior to the incuba tions. At the sampling depth, bacterial cell abundance was 8.2 × 10⁵and 8.8 × 10⁵cells ml−1at Stns BY15 and BY21, respectively. For Stn BY15, the initial nutrient concentrations were 0.1, 0.1, 3.28 and 2.7 µmol l−1for nitrite, nitrate, ammonium and phos- phate, respectively. For Stn BY21, nitrite and nitrate were below the detection limit, and ammonium and phosphate concentrations peaked at 2.06 µmol l−1 and 2.6 µmol l−1.
Author copy
At each station (BY15 and BY21), 20 l of seawater were collected with 2 Niskin bottles (12 l) at 110 m depth. Seawater was filtered through a 100 µm mesh to remove larger zooplankton and filled into 12 (Expt BY21) or 18 (Expt BY15) gas-tight serum bottles of 1.12 l (Zscheiler and Klinger). Incubations were per- formed under oxic and low O2conditions (see Fig. 1 for O2 concentrations) without additions (controls) and with different inorganic nutrient and glucose enrichments. All incubations were performed in trip- licate. Expt BY15 included controls and 2 enrich- ments: (1) GPA, with final concentrations of glucose (100 µmol l−1), sodium phosphate (60 µmol l−1) and ammonium chloride (152 µmol l−1); (2) GPAN, with final con centrations of glucose (100 µmol l−1), so - dium phosphate (60 µmol l−1), ammonium chloride (152 µmol l−1) and sodium nitrate (88 µmol l−1). Expt BY21 included controls and glucose (G) enrichment (final concentration: 100 µmol l−1). All enrichment solutions were < 0.2 µm filtered prior to addition to avoid prokaryotic contamination. To avoid limitation of the added nutrients and glucose during the dura- tion of the experiments, all enrichments were con- ducted in excess. The ratio for glucose and ammo- nium addition was calculated based on a bacterial C:N ratio of 3.5 to 3.9 (Lee & Fuhrman 1987); a ratio for nitrate and ammonium addition of 1.7 was chosen after Hagström et al. (1979).
Low O2 conditions were obtained by gentle bub- bling with a gas mixture containing 0.13% of CO2in pure N2for 4 h to avoid an increase in pH during O2 degassing (R. Kiko pers. comm.). Prior to bubbling, the N2-CO2gas mixture was passed through an O2re- duction column (copper catalyst, Glasgerätebau Ochs) to remove possible O2 residues. For the oxic treat- ments, samples were gently bubbled with synthetic air (21% O2in N2with <1 ppm CO2) to induce similar perturbations by bubbling. After bubbling, low O2 bottles were closed with a gas-tight cap and septum, and oxic bottles were covered with gas-permeable parafilm. All bottles were incubated at 10°C on a shaker in the dark for 109 h (BY15) or 94 h (BY21).
During the experiment, 3 replicate incubation bottles per treatment were sampled. Samples for cell abun- dance were taken daily, for leucine-amino peptidase (LAPase) rates after 67 h (BY15) or 69 h (BY21) and for bacterial production after 66 h (BY15) or 94 h (BY21).
Dissolved organic carbon (DOC), particulate organic carbon (POC), nutrient and amino acid concentrations were determined initially and at the end of the incuba- tion. Due to a limited sampling volume, initial nutrient and amino acid concentrations were determined from a second CTD cast sampling the same water depth im-
mediately after the first cast. The O2concentration in all bottles was monitored daily.
2.2. Microbial and biogeochemical methods 2.2.1. Oxygen
O2concentration in the field was measured using the Oxygard sensor (PreSens) on the CTD (range: 0 to 437 µmol l−1 saturation; accuracy: ±1%), calibrated with Winkler titration triplicates (range: 1 to 500 µmol l−1, precision: ± 2 µmol l−1) as described by Le Moigne et al. (2017). In each incubation bottle, O2concentration was measured with a calibrated noninvasive optical sensor (PreSens, detection limit: 0.5 µmol l−1; accuracy:
± 0.4% at 20.9% and ± 0.05% at 0.2%). Values were converted to µmol l−1with the O2solubility table from Unisense a/s (Ramsing & Gundersen) using the incu- bation temperature and salinity data from the CTD.
2.2.2. Cell abundance
Under the assumption that bacteria represent the major fraction of prokaryotic cells (Karner et al. 2001, Thureborn et al. 2013), bacteria were counted by flow cytometry (FACS Calibur, Becton Dickinson) according to Gasol & Del Giorgio (2000). Briefly, 4.5 ml were fixed with 25% glutaraldehyde (1% final concentration) and stored at −20°C until analysis (maximum 1 mo). Immediately before ana lysis, sam- ples were sonicated for 5 s, filtered through a 50 µm mesh and diluted 10-fold. Then 400 µl of sample were mixed with 10 µl Fluoresbrite® fluorescent beads (Polyscience) and Sybr Green (Invitrogen) (final concentration 1×). The flow of the cytometer was calibrated with 2 standards containing a known amount of reference TruCount Beads™ (BD) and the Fluoresbrite® fluorescent beads (Polyscience), which were added to each sample. The theoretical detec- tion limit was 34 cells ml−1of sample, and the meas- urement error associated with this method was 2%.
2.2.3. Extracellular enzyme activity
The rate of the extracellular enzyme LAPase was determined using the fluorescent substrate analogue L-leucine-7-Amido-4-Methylcoumarin (Hoppe 1983).
Calibration was done with defined concentrations of 7-Amino-4-Methylcoumarin. To determine enzyme kinetics, substrates were added to 5 ml samples,
Author copy
yielding final concentrations of 1, 5, 10, 20, 50, 80, 100 and 200 µmol l−1. Samples were incubated in the dark at 10°C and room O2 concentrations for oxic conditions or placed in a gas-tight incubator filled with N2 for low O2 conditions. Fluorescence was measured after 6 h on a plate reader fluorometer (FLUOstar Optima, BMG labtech) at 355 nm (excita- tion) and 460 nm (emission). The measurement error was estimated to 2% using a calibration with tripli- cates. Michaelis-Menten kinetics were calculated using the simple ligand binding function in Sigma - Plot™ 12.0 (Systat Software) to obtain the maximum reaction velocity at saturating substrate concentra- tion (Vmax) (Chróst & Siuda 2002).
2.2.4. Bacterial heterotrophic production Heterotrophic prokaryotic production was summa- rized as bacterial production, assuming that bacterial abundance exceeds archaeal abundance (Karner et al. 2001, Thureborn et al. 2013) and that archaeal production is dominated by autotrophic processes (Ingalls et al. 2006). Bacterial production was esti- mated from uptake of radioactive labelled (3H) leucine (Kirchman et al. 1985, Smith & Azam 1992).
One sub-sample of 1.5 ml per incubation bottle was incubated for 1 h at a final concentration of 20 nmol leucine l−1. Low O2 samples were bubbled with N2 and oxic samples with synthetic air. The 3H-leucine uptake was converted into carbon units using the factor 1.5 kg C mol−1leucine (Simon & Azam 1989).
An analytical error of 5.2% was estimated using a calibration with triplicates.
2.2.5. Nutrients
From each incubation bottle, 50 ml were filtered through a 0.45 µm pore size syringe filter (glass mi- crofiber GD/X membrane, Whatman) and stored at
−20°C until analysis. Nutrient samples from the CTD profiles were measured unfiltered. Ammonium was measured directly on board after Koroleff (1969) and Solórzano (1969). The relative standard deviation (RSD) for this method was 3%, and the detection limit 0.05 µmol l−1. Samples from the incubation experi- ments were diluted at maximum 1:25 with ultrapure water. Phosphate, nitrate and nitrite con cen trations were measured photometrically with con tinuous flow analysis on an auto-analyzer (QuAAtro; Seal Analy - tical) after Grasshoff et al. (1999) (detection limit:
< 0.04 µmol l−1, coefficient of variation: < 0.7%).
2.2.6. Dissolved organic carbon and total dissolved nitrogen
For DOC and TDN, 20 ml were filtered through a 0.45 µm syringe filter (glass microfiber GD/X mem- brane, Whatman), which was rinsed with sample, into a combusted glass ampoule (8 h, 500°C). Sam- ples were acidified with 20 µl of 30% ultrapure hydrochloric acid, sealed and stored at 4°C in the dark. DOC concentrations were determined with a TOC−VCSH (Shimadzu) with 5 to 8 injections after high-temperature catalytic oxidation applying a method modified from Sugimura & Suzuki (1988) and described in more detail by Engel & Galgani (2016).
2.2.7. Dissolved hydrolysable amino acids Dissolved hydrolysable amino acids were analyzed via high performance liquid chromatography on a 1260 HPLC system (Aglient Technologies) using a C18 column (Phenomex Kinetex) after in-line ortho- phthaldialdehyde derivatization with mercaptoetha - nol (Lindroth & Mopper 1979, Dittmar et al. 2009).
The following amino acids were analyzed: alanine, arginine, glycine, leucine, phenylalanine, serine, threonine, tyrosine, valine, aspartic acid + aspa - ragine (co-eluted), glutamine + glutamic acid (co- eluted), γ-aminobutyric acid and isoleucine. For each sample, 20 ml were filtered through a rinsed Acro - disc® 0.45 µm GHP membrane (Pall) into combusted glass vials (8 h, 500°C) and stored at −20°C. Samples were hydrolyzed at 100°C for 20 h with HCl before analysis according to Lindroth & Mopper (1979). The acid was then evaporated under vacuum at 60°C and washed with Milli-Q water. The detection limit of this method is <1.4 nmol l−1. Using mol% of individual amino acids, the degradation index (DI; Dauwe &
Middelburg 1998, Dauwe et al. 1999) of organic mat- ter was calculated as an indicator of organic matter lability using the factor coefficients developed for DOM by Kaiser & Benner (2009). Thereby, fresher and more accessible organic matter is indicated by a higher DI.
2.2.8. Particulate organic carbon and particulate nitrogen
Aliquots (200−400 ml) were filtered (< 200 mbar) onto combusted (8 h, 500°C) GF/F filters (~0.7 µm) and stored at −20°C until analysis. Prior to analysis,
Author copy
filters were acid-fumed (37% hydrochloric acid) (6 h) to remove carbonates and dried (6 h; 60°C).
POC and PN concentrations were determined with an elemental analyzer (Euro EA, Hechatech) after Sharp (1974). The instrument was calibrated with acetanilide (0.1 to 0.7 mg) and soil standard (2 to 4 mg). The measurement error of the instrument was 0.4%.
2.3. Turnover of organic carbon POC formation and DOC uptake were estimated by the difference in POC and DOC concentrations (ΔPOC and ΔDOC) between the start and end of the incubation.
ΔPOC:ΔDOC was used as an esti- mate of the growth efficiency after Kroer (1993). Growth efficiency is defined by the bacterial biomass that is produced relative to the car- bon that has been taken up.
2.4. Data analysis
There were always n = 3 replicate incubation bottles. For the oxic con- trol of BY21, only 2 POC:PN filters were analyzed. The impact of O2 and nutrient concentrations on bac- terial activity was statistically tested by a multifactorial ANOVA or a robust ANOVA with the WRS pack- age (Wilcox 2005) applying boot- strapping (2000 replicates) and comparing the median (Field et al.
2012). The differences between the O2levels within one nutrient treat- ment were tested using independ- ent t-tests for normally distributed data and the Wilcoxon rank order test for data that were not normally distributed (see Tables S1 & S2 in the Supplement at www. int-res.
com/ articles/ suppl/ a083p095 _ supp.
pdf) with a significance level of p ≤ 0.017, to account for the Bonferroni correction (Field et al. 2012). All sta- tistical tests and plots were con- ducted in R version 3.4.2 (R Devel- opment Core Team 2008).
3. RESULTS 3.1. Oxygen
O2concentrations during BY15 differed clearly be - tween low and high O2 treatments throughout the experiment with differences in O2 concentrations of at least 107 µmol O2l−1, except for 1 incubation bottle (oxic GPAN) on 1 sampling day (Fig. 1A). O2concen- trations increased over time in the low O2 incuba- tions, first in the control and subsequently in the enriched incubations. However, after 66 h, low O2
Fig. 1. Temporal development of oxygen (O2) concentrations in each incubation bottle during (A) BY15 and (B) BY21. Nutrient treatments: +GPA (addition of glucose, phosphate and ammonium), +GPAN (addition of glucose, phosphate, ammonium and nitrate) and +G (addition of glucose). Light grey symbols indi- cate low O2incubations and dark grey the oxic ones. Symbols indicate in (A) the control with ambient nutrient concentrations (diamonds) and the ones with added glucose, ammonium, phosphate (circles) and additionally nitrate (trian- gles). In (B), symbols indicate the control with ambient glucose concentrations
(triangles) and the ones with added glucose (circles)
Author copy
incubations were still suboxic (GPA and GPAN) or ≤44 µmol O2 l−1 (con- trols). For BY21, O2concentrations var- ied from below the detection limit to 36 µmol O2l−1in the low O2treatment and ranged from 326 to 346 µmol O2l−1in the oxygenated incubations (Fig. 1B).
3.2. Bacterial activity
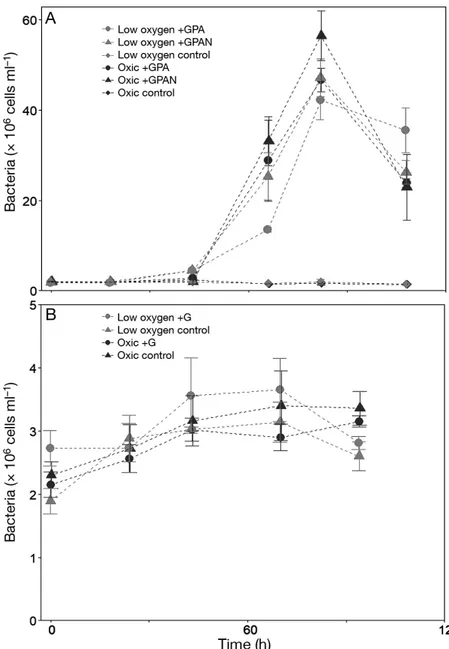
Bacterial activity was determined by changes in cell abundance as well as by bacterial production and LAPase rates. During BY15, bacterial cell abundance increased significantly 66 h after nutrient addition (p < 0.01) (Figs. 2A & 3A, see Table S3 in the Sup plement at www. int-res. com/
articles/ suppl/ a083p095 _ supp. pdf). In the GPA and GPAN treatments, cell abundance peaked 82 h after nutrient addition. At the time of sampling for LAPase and bacterial production (after 66 h), cell abundance differed between O2treatments (p=0.02) (Table S3) and was reduced in the low O2GPA treat- ment (GPA: −14% to −140%) com- pared to the oxic ones. In the GPAN treatment, cell abundance varied, but on average cell abundance was lower (−24%) in the low O2than in the oxic incubations (Fig. 3A) (Table 1). Cell abundance in the oxic and low O2con- trols was similar and showed little vari- ation over time (Fig. 2A). In the incuba- tions of BY21, addition of only glucose did not result in significantly higher cell abundance (Fig. 2B). Cell abun- dance in both control and G increased
slowly over time with an average abundance of 2.9 × 10⁶cells ml−1± 16% for all incubations (Fig. 2B).
Total and cell-specific bacterial production in - creased significantly 66 h after nutrient addition dur- ing BY15 (ptotal < 0.01, pcell-specific < 0.01) (Fig. 3B, Table S1). Total bacterial production was signifi- cantly higher in the oxic compared to the low O2
treatments (p < 0.01), depending on the nutrient and glucose addition (p < 0.01) (Table 1, Table S3). With GPA addition, bacterial production was 23 to 32%
lower under low O2conditions. With GPAN addition, the differences between the O2 treatments were slightly smaller, with bacterial production be ing 7 to
32% lower in the low-O2 incubations (Fig. 3B). In contrast, cell-specific bacterial production was rather lower under oxic conditions, indicating that higher cell abundance in the oxic treatment was responsible for the enhanced total bacterial production (Fig. 3A,B, Table S1). For BY21, bacterial production was signif- icantly higher in incubations with glucose than in the ones without (p < 0.01) (Fig. 3B, Table S3). A signifi- cant effect of O2 on bacterial production was only observed in the controls, i.e. without glucose addi- tion, with significantly higher total bacterial produc- tion in the oxic treatment than in the low-O2one (p= 0.01) (Fig. 3B, Table S2, Table 1).
Fig. 2. Changes in average bacterial abundance over time for 3 oxic and low O2incubation bottles per treatment (mean ± SD) for the batch experiment (A)
Stn BY15 and (B) Stn BY21. See Fig. 1 for symbols and abbreviations
Author copy
LAPase rates differed strongly between treatments with and without nutrient addition during BY15 (Fig. 3C). Total LAPase rates were higher for GPA and GPAN (p < 0.01), while cell-specific LAPase rates were higher in the controls (p < 0.01), implying that higher total LAPase rates in GPA and GPAN were based on higher cell abundance also (Tables S1 & S3). During BY15, total LAPase rates were significantly higher in the oxic incubations for both GPA and GPAN com- pared to the low-O2 treatments (p < 0.01) (Fig. 3C, Table 1), while cell-specific LAPase rates showed no difference between the O2treatments. In the controls, both total and cell-specific LAPase rates were signifi- cantly higher in the oxic than in the low-O2incubations (p < 0.01) (Table 1). During BY21, LAPase rates did not differ between the controls and the treatments with glucose addition (Fig. 3C). Effects of the O2treatments in BY21 differed from those during BY15. In BY21, total and cell-specific LAPase rates were significantly higher in the low-O2incubations after glucose addition (ptotal< 0.01, pcell-specific= 0.01) (Fig. 3C, Table 1).
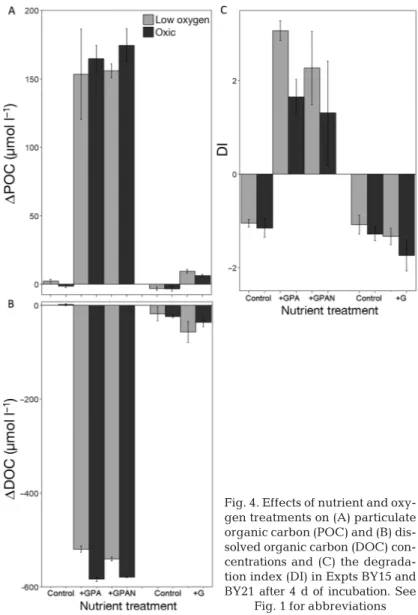
3.3. Biogeochemical transformations To test whether the turnover of organic matter dif- fered between O2and nutrient treatments, we com-
pared oxic and low-O2 treatments with respect to changes in DIN (i.e. nitrate, nitrite and ammonium), DOC and POC concentrations at the beginning and end of the experiment. At the end of the experiment, no significant difference was observed for nitrite con- centrations between the oxic and low-O2 incuba- tions (Table S1). Nitrate concentrations were signifi - cantly lower in the low-O2incubations of GPA (0.5 ± 0.0 µmol l−1) and GPAN (0.5 ± 0.0 µmol l−1) than in the oxic GPA (1.0 ± 0.0 µmol l−1) and GPAN (86.4 ± 22.6 µmol l−1) (p < 0.01). In the low-O2 incubations with GPAN, there were 116.4 ± 9.8 µmol l−1of ammo- nium; thus, concentrations were significantly higher than in the oxic incubations (64.6 ± 0.7 µmol l−1; p <
0.01) (Table 1). For BY21, no significant differences be tween the oxic and low-O2 incubations were ob - served for nutrient concentrations, independent of the glucose addition (Table S2).
During BY15, addition of GPA and GPAN resulted in a strong increase in POC formation of ~160 µmol l−1(p<0.01) (Fig. 4A, Tables S1 & S3). Higher POC formation was observed in the oxic incubations of GPAN (5−24%), but differences between the oxic and low-O2treatments were not statistically signifi- cant due to a high variability within the treatments (Fig. 4A, Table S1). In the controls, POC concentra- tion increased slightly and only in the low-O2incuba- Fig. 3. Effects of nutrient and oxygen treatments on bacterial communities in Expts BY15 and BY21 after 3 to 4 d of incubation:
(A) Bacterial abundance, (B) bacterial production (BP) and (C) Vmaxof leucine-aminopeptidase (LAPase). In the control, only the oxygen concentration was modified. See Fig. 1 for abbreviations
Author copy
tions. Initial molar POC:PN ratios of BY15 were 6.44.
In the controls, molar POC:PN ratios were variable (4.8−10.3) at the end of the incubation, whereas they clearly decreased in GPA and GPAN incubations (4.2−4.5). Addition of glucose during BY21 resulted in an increase of ~5 µmol l−1of POC, at the end of the experiment, whereas POC concentrations decreased slightly in the controls (Fig. 4A, Table S2). There
were no significant differences in POC concentrations with respect to the O2 treatments either. Molar POC:PN ratios varied between 5.7 and 7.6, similar to the initial ratio (5.88).
We estimated the growth efficiency from the ratio of POC formation and DOC consumption (ΔPOC:ΔDOC). The growth efficiency was ~30% (23−
37%) in the GPA and GPAN treat- ments (without a significant differ- ence between nutrient treatments) during BY15 and ~20% (11−26%) during BY21 in the incubations with glucose. There was no significant dif- ference between the O2 treatments (Tables S1 & S2). Growth efficiency was not estimated for the controls as no net increase in POC concentration was detected.
Similar to POC formation, the up - take of DOC, mainly in form of added glucose, was stimulated by the addi- tion of inorganic nutrients. In the controls during BY15, we observed no significant O2effect on DOC con- sumption or on DOM degradation, as indicated by the DI (Fig. 4B,C). In the GPA and GPAN treatments, the ad - dition of 100 µmol l−1 glucose to the initial DOC concentration of 262 µmol l−1 should have increased the initial concentration to 862 µmol l−1 DOC.
Thereby, the consumed DOC (DOCstart− DOCend) almost equaled the amount of added glucose (Fig. 4B).
Still, in the low-O2treatments, signif- icantly more DOC was left over than in the oxic treatments (p < 0.01) (Fig. 4B), indicating less uptake or greater release of DOC in the low-O2 treatments (Table 1). Production of new DOM in the GPA and GPAN treatments, under oxic and low-O2 conditions, was inferred from changes in organic matter lability as indicated by the amino acid based DI. The final DI was clearly higher in the GPA and GPAN treatment compared to the initial conditions (−0.39) (Fig. 4C), indicating the formation of more labile amino acids. Thereby, the DI was even higher in the low-O2treatments, with a significant difference in the GPA treatment (p < 0.01) (Fig. 4C, Table 1). For
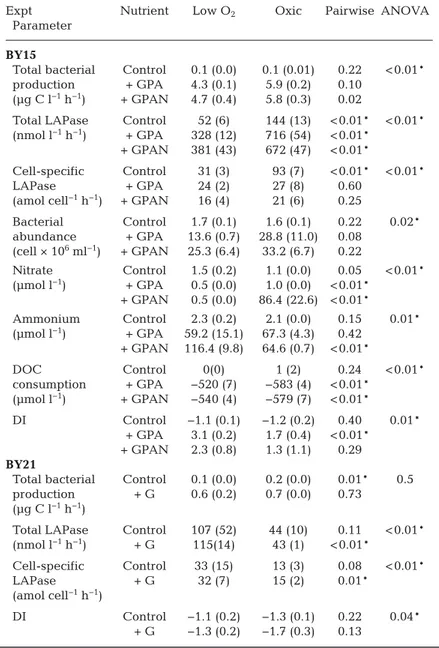
Expt Nutrient Low O2 Oxic Pairwise ANOVA
Parameter BY15
Total bacterial Control 0.1 (0.0) 0.1 (0.01) 0.22 < 0.01*
production + GPA 4.3 (0.1) 5.9 (0.2) 0.10 (µg C l−1h−1) + GPAN 4.7 (0.4) 5.8 (0.3) 0.02
Total LAPase Control 52 (6) 144 (13) < 0.01* < 0.01*
(nmol l−1h−1) + GPA 328 (12) 716 (54) < 0.01*
+ GPAN 381 (43) 672 (47) < 0.01*
Cell-specific Control 31 (3) 93 (7) < 0.01* < 0.01*
LAPase + GPA 24 (2) 27 (8) 0.60
(amol cell−1h−1) + GPAN 16 (4) 21 (6) 0.25
Bacterial Control 1.7 (0.1) 1.6 (0.1) 0.22 0.02*
abundance + GPA 13.6 (0.7) 28.8 (11.0) 0.08 (cell × 106ml−1) + GPAN 25.3 (6.4) 33.2 (6.7) 0.22
Nitrate Control 1.5 (0.2) 1.1 (0.0) 0.05 < 0.01*
(µmol l−1) + GPA 0.5 (0.0) 1.0 (0.0) < 0.01*
+ GPAN 0.5 (0.0) 86.4 (22.6) < 0.01*
Ammonium Control 2.3 (0.2) 2.1 (0.0) 0.15 0.01*
(µmol l−1) + GPA 59.2 (15.1) 67.3 (4.3) 0.42 + GPAN 116.4 (9.8) 64.6 (0.7) < 0.01*
DOC Control 0(0) 1 (2) 0.24 < 0.01*
consumption + GPA −520 (7) −583 (4) < 0.01*
(µmol l−1) + GPAN −540 (4) −579 (7) < 0.01*
DI Control −1.1 (0.1) −1.2 (0.2) 0.40 0.01*
+ GPA 3.1 (0.2) 1.7 (0.4) < 0.01*
+ GPAN 2.3 (0.8) 1.3 (1.1) 0.29 BY21
Total bacterial Control 0.1 (0.0) 0.2 (0.0) 0.01* 0.5 production + G 0.6 (0.2) 0.7 (0.0) 0.73
(µg C l−1h−1)
Total LAPase Control 107 (52) 44 (10) 0.11 < 0.01*
(nmol l−1h−1) + G 115(14) 43 (1) < 0.01*
Cell-specific Control 33 (15) 13 (3) 0.08 < 0.01*
LAPase + G 32 (7) 15 (2) 0.01*
(amol cell−1h−1)
DI Control −1.1 (0.2) −1.3 (0.1) 0.22 0.04*
+ G −1.3 (0.2) −1.7 (0.3) 0.13
Table 1. Means (standard deviations) of sampled parameters from Expts BY15 and BY21 that differed significantly between oxygen (O2) treatments. +GPA:
added glucose, phosphate and ammonium; +GPAN: added glucose, phos- phate, ammonium and nitrate. Incubations were performed in triplicate. The p-values of the pairwise comparison between different O2treatments with Wilcoxon or t-test and ANOVA results of the O2effect are given. The signifi- cance (*) level in the pairwise comparison was adjusted to 0.017, to account for the Bonferroni correction. See tables in the Supplement for details
Author copy
BY21, the initial DOC concentration was 291 µmol l−1, and the DI was −0.91. At the end of the experi- ment, DOC consumption was higher in the G treat- ment (p=0.02) (Table S3). However, only ~25 µmol l−1more DOC was taken up compared to the control (Table S2), suggesting that only a small fraction of the added glucose was consumed without the addi- tion of inorganic nutrients. Between O2 treatments, there were no significant differences in DOC con- sumption. Organic matter lability (DI) was similar to the starting conditions.
4. DISCUSSION
We conducted 2 incubation experiments to investi- gate whether bacterial degradation of organic matter is affected by changes in O2 concentrations. In the
GPA and GPAN treatments, labile organic substrate (glucose) and nutrients, including the potential electron acceptor nitrate, were offered in excess to assure alleviation of lim- itation throughout the experiment. How- ever, the amount of added nutrients and substrate in the G, GPA and GPAN treat- ments likely induced changes in the bacter- ial community composition. For example, it seems likely that fast-growing copiotrophic heterotrophic bacteria could benefit from the high glucose supply, and nitrifiers, which appear in the sampling area (Hieta- nen et al. 2012), were favored by high levels of ammonium. Thus, we cannot exclude that O2 effects discussed below will vary with initial biogeochemical and microbial condi- tions because we did not repeat all nutrient treatments in both experiments and some parameters sampled from the controls did slightly differ between experiments. Extrap- olating results from our experiments to other OMZ communities should be done with caution, in particular if the biogeochemical conditions are distinct from those in the Gotland Basin.
Bacterial growth can be limited by several factors, including labile organic carbon, in - organic nutrients and electron acceptors (e.g. Stewart 1988, Jørgensen et al. 1999, Bonaglia et al. 2016). In our study, bacterial production increased after the addition of glucose solely (Fig. 3B), suggesting a limita- tion of the bacterial community by labile organic carbon. After the addition of glu- cose and inorganic nutrients, significant amounts of glucose were taken up during the experiments, ac - companied by strongly increasing cell abundance and bacterial production (Figs. 3A,B & 4B). Inorganic nutrients therefore were mainly controlling bacterial activity in this experiment.
Under suboxic and anoxic conditions, nitrate is the energetically most favorable electron acceptor for anaerobic respiration (Lam & Kuypers 2011). How- ever, the reduction of nitrate yields less energy than the reduction of O2, and the conversion of energy into biomass after denitrification was found to be less than expected by the chemical energy yields (e.g.
Strohm et al. 2007). In the suboxic water incubated in our experiments, nitrate concentrations were close to the detection limit. Under nitrate and O2 limitation, bacteria might conduct fermentation, with an even lower energy yield than the reduction of nitrate Fig. 4. Effects of nutrient and oxy-
gen treatments on (A) particulate organic carbon (POC) and (B) dis- solved organic carbon (DOC) con - centrations and (C) the degrada- tion index (DI) in Expts BY15 and BY21 after 4 d of incubation. See
Fig. 1 for abbreviations
Author copy
(Madigan et al. 2012). We, therefore, expected (1) stronger bacterial growth under low-O2 conditions after the addition of nitrate as electron acceptor (GPAN) than in the treatment without nitrate (GPA) and (2) enhanced bacterial growth in the oxic treat- ments, in contrast with the low-O2treatments. In our experiments, the addition of nitrate enabled denitrifi- cation or DNRA, as indicated by higher ammonium and lower nitrate concentrations observed in the low O2compared to the oxic GPAN treatment (Table 1).
While cell abundance in the GPA treatment was indeed much lower than in GPAN, bacterial produc- tion was rather similar, indicating an efficient glu- cose utilization by other anaerobic respiration path- ways than the reduction of nitrate and by fermenting bacteria (Fig. 3A,B). However, since our incubations were not fully anoxic, microaerobic respiration might have additionally fueled bacterial activity in both GPA and GPAN and weakened potential differences between the oxic and low-O2 treatments. In our study, bacterial production was reduced at low O2 concentrations, in both GPA and GPAN treatments (Fig. 3B), corroborating the finding of reduced het- erotrophic bacterial growth under low-O2conditions (e.g. Stewart 1988). Cell-specific bacterial produc- tion, an estimate of the community growth rate, did not show the same trend, suggesting mortality e.g. by viruses and protists or temporal variations in cell- specific bacterial production during the low-O2incu- bation that were not captured by our sampling design. In suboxic waters of the Baltic Sea, protist bacterivory was shown to be a major reason for prokaryotic mortality and exceeded mortality by viral infections (Anderson et al. 2012). However, het- erotrophic nanoflagellates, that are known bac - terivores, appear near the oxyclines but seem less active at the redoxcline in the Baltic Sea and in anoxic lakes (Weinbauer & Höfle 1998, Anderson et al. 2012). Viruses are assumed to infect up to 62%
of the free-living bacteria in marine systems (Proctor et al. 1993), and high cell losses by viral lysis under anoxic conditions were documented for lakes (Wein- bauer & Höfle 1998) and in anoxic deep waters of the Cariaco Trench (Taylor et al. 2003). Viruses and protists should have been equally distributed be - tween the incubations but might have developed differently during incubation and influenced bacter- ial abundance.
To access HMW organic matter, bacteria excrete extracellular enzymes, which can control organic matter degradation in marine systems (Hoppe et al.
2002). O2 concentrations may affect extracellular enzyme rates in 2 ways: (1) the lower energy yield of
anaerobic respiration compared to oxic respiration may result in a decreased production of extracellular enzymes; (2) the need to oxidize more organic sub- strate to counteract the reduced energy yield by anaerobic respiration enhances the production of extracellular enzymes. In our experiments, the trend of higher LAPase rates in the oxic GPA and GPAN treatments compared to the low-O2 treatments did not persist after the normalization to cell abundance (Table S1). Moreover, LAPase rates in the controls differed between the experiments (Fig. 3C). Thus, our results do not support the idea of a consistent direct O2 effect on LAPase rates, being in line with earlier incubation experiments investigating effects of O2 deficiency (Hoppe et al. 1990). Nevertheless, the reduced abundance of bacteria observed under low-O2 conditions in the treatments amended with nutrients and glucose may have been responsible for the reduced total LAPase rates in these treatments (Fig. 3C). If applicable to the field, this may suggest a reduced degradation potential of HMW organic mat- ter in low-O2systems where substrate and nutrient availability is not limiting.
Elevated bacterial growth under oxic conditions in our experiments implies greater turnover and remin- eralization of organic matter. Therefore, we analyzed the uptake of DOC, the formation of POC and the change in substrate lability as given by the amino acid based DI (Kaiser & Benner 2009). In all una- mended controls, uptake of DOC and formation of POC did not differ between O2levels, revealing that carbon turnover of heterotrophic bacteria was not primary limited by O2 availability. Addition of glu- cose and inorganic nutrients had a stronger stimulat- ing effect on the turnover of carbon under oxic com- pared to low-O2conditions (Fig. 4A,B). In particular, the net uptake of DOC was co-limited by the avail- ability of O2(Fig. 4B). The uptake of DOC was ac - companied by the formation of POC. It can be assumed that POC accumulating in the nutrient- and glucose-amended incubations was mainly bacterial biomass, since the POC:PN ratio was close to that of bacteria (Section 3.3) (Goldman et al. 1987, Lee &
Fuhrman 1987, Billen et al. 1990, Caron et al. 1995).
Therefore, the growth efficiency can be estimated by the ratio ΔPOC:ΔDOC (Kroer 1993), reflecting the ratio between the carbon uptake and the carbon that is incorporated into biomass. Relatively high growth efficiencies of 23 to 36% in the GPA and GPAN treat- ments were at the upper range of previously reported data for the ocean and may be explained by high labile carbon and nutrient supply (Del Giorgio & Cole 1998). Little is known about the growth efficiency of
Author copy
aerobic compared to anaerobic microbial communi- ties. In our study, ratios of ΔPOC:ΔDOC did not differ between the O2treatments (Tables S1 & S2), suggest- ing no direct O2effect on growth efficiency at low O2 concentrations. However, growth efficiency may be higher in fully anoxic systems due to chemoauto- trophy as suggested by Keil et al. (2016).
Reduced bacterial growth and uptake of organic matter under low O2as well as nutrient- and glucose- amended conditions suggest a reduced transport of DOM from bacteria to higher trophic levels in sub- oxic waters. Reduced degradation of organic matter under hypoxic and anoxic conditions could explain DOC accumulation in the water column (e.g. Devol &
Hartnett 2001, Engel et al. 2017, Le Moigne et al.
2017). The higher DI values at the end of the experi- ment in the nutrient- and glucose-amended treat- ments compared to the beginning suggest an accu- mulation of more labile DOM. Additionally, the higher DI values in the low-O2 incubations (GPA) compared to the oxic ones of our experiments (Fig. 4C) suggest a reduced degradation of DOM or greater production and accumulation of labile DOM.
This finding is in line with a previous study showing slower degradation of proteins under anoxia (Nguyen
& Harvey 1997) or points towards enhanced extracel- lular release or viral lysis. The latter might also ex - plain the (on average) lower cell abundance in the low-O2treatments (see above). Former studies sug- gested viral cell lysis as a source of labile DOM that is enhanced in anoxic waters (Proctor et al. 1993, Taylor et al. 2003). The enhanced O2effect on DI in combination with the addition of glucose and inor- ganic nutrients points towards multifactorial environ- mental control of bacterial organic carbon turnover in suboxic waters.
In the Baltic Sea, the inflow of O2-rich North Sea water can oxygenate the deep basins (e.g. Mohrholz et al. 2015), whereas at least parts of the intermediate waters remain O2-depleted (e.g. Dellwig et al. 2018).
Oxygenation has a profound effect on nutrient con- centrations. Phosphate is bound to the sediment, and ammonium is oxidized to nitrate. The nitrate remains within the water column, since it does not become reduced to dinitrogen gas (Nausch et al. 2003). The results of our incubation experiments suggest that concentrations of labile organic matter would be higher in suboxic or anoxic waters, while the turn- over of organic matter would be higher in oxy- genated waters, until the bacterial activity in the oxy- genated water becomes nutrient-limited. In this case, oxyclines may represent systems, where higher amounts of labile DOM, diffusing from O2-depleted
waters, might fuel the bacterial activity in the more oxygenated waters. This would result in locally high rates of organic matter degradation and bacterial growth and might explain high cell-specific bacterial production measured at oxic-anoxic interfaces in the Baltic Sea (Brettar et al. 2012). Consequently, near oxyclines, more organic matter and subsequently bacterial biomass would enter the food chain and afterwards be respired to carbon dioxide, which might be released into the atmosphere, acting as a greenhouse gas. These potential implications remain to be verified because additional factors such as tem- perature, the abundance of higher trophic levels and the bacterial community composition can influence the degradation of OM under different O2concentra- tions. For instance, the composition of the bacterial community might favor syntrophy and therefore change the energetic yields of anaerobic degradation processes (Morris et al. 2013 and references within).
Consequently, more multifactorial experiments with natural microbial communities are needed to fully identify the influence of O2concentrations on bacter- ial degradation of OM.
5. SUMMARY
The increase of hypoxic and anoxic zones in mar- ine waters requires a better understanding of the microbial organic matter cycling under different O2 concentrations. In the Baltic Sea, as well as in other enclosed and coastal seas, O2and nutrient dynamics are strongly coupled. We showed that nutrient and O2concentrations can co-determine bacterial activ- ity and degradation of organic matter. A reduced bacterial activity and organic matter turnover under low O2 compared to oxic conditions may also be related to differences in cell mortality, e.g. by viral lysis. If our experimental results were applicable to the field, we may speculate that organic matter cycling and carbon transfer to higher trophic levels decline under nutrient-rich hypoxic conditions, resulting in less respiration of organic carbon to car- bon dioxide and enhanced storage of carbon in the ocean.
Author contributions: M.M., J.P. and A.E. designed the experiment. M.M. and J.P. performed the experiment and analyzed the data. M.M. and A.E. wrote the manuscript.
F.A.C.L.M. and C.C.-N. helped performing the experiment and sampled the experiment and the water column. A.E.
and J.P. designed the scientific program of the cruise. All authors assisted writing.
Author copy
Acknowledgements.We thank Jon Roa for the analysis of dissolved organic carbon, Tania Klüver for the particulate organic carbon measurements, Ruth Flerus for the analysis of amino acids and Bettina Domeyer for the analyses of nutrients. Moreover, we thank Sonja Endres, Alexandra Loginova, Kerstin Nachtigall, Mark Lenz, Birthe Zäncker Angela Stippkugel, Carola Wagner, Clarissa Karthäuser and Moritz Ehrlich for the support conducting the experi- ment and the data analyses. We thank the crew, officers and the captain of the RV ‘Alkor’ for the support on board and the successful cruise. We also thank the anonymous reviewers for the helpful comments. This study is a contribu- tion to the Collaborative Research Center 754 / SFB Sonder- forschungsbereich 754 ‘Climate-Biogeochemistry Interac- tions in the Tropical Ocean’. This research was supported by Helmholtz-Gemeinschaft Deutscher For schungs zentren, a Fellowship of the DFG Excellence Cluster ‘The Future Ocean’ (CP1403 to F.A.C.L.M.) and by a DAAD short term grant (57130097 to C.C.-N.)
LITERATURE CITED
Andersen JH, Carstensen J, Conley DJ, Dromph K and oth- ers (2017) Long-term temporal and spatial trends in eutrophication status of the Baltic Sea. Biol Rev Camb Philos Soc 92: 135−149
Anderson R, Winter C, Jürgens K (2012) Protist grazing and viral lysis as prokaryotic mortality factors at Baltic Sea oxic−anoxic interfaces. Mar Ecol Prog Ser 467: 1−14 Azam F, Fenchel T, Field JG, Gray JS, Meyer-Reil LA,
Thingstadt F (1983) The ecological role of water-column microbes in the sea. Mar Ecol Prog Ser 10: 257−263 Billen G, Joiris C, Meyer-Reil L, Lindeboom H (1990) Role of
bacteria in the North Sea ecosystem. Neth J Sea Res 26:
265−293
Bonaglia S, Klawonn I, De Brabandere L, Deutsch B, Tham- drup B, Brüchert V (2016) Denitrification and DNRA at the Baltic Sea oxic-anoxic interface: substrate spectrum and kinetics. Limnol Oceanogr 61: 1900−1915
Bopp L, Resplandy L, Orr JC, Doney SC and others (2013) Multiple stressors of ocean ecosystems in the 21st cen- tury: projections with CMIP5 models. Biogeosciences 10:
6225−6245
Brettar I, Christen R, Höfle MG (2012) Analysis of bacterial core communities in the central Baltic by comparative RNA−DNA-based fingerprinting provides links to struc- ture−function relationships. ISME J 6: 195−212
Caron DA, Dam HG, Kremer P, Lessard EJ and others (1995) The contribution of microorganisms to particulate carbon and nitrogen in surface waters of the Sargasso Sea near Bermuda. Deep-Sea Res 42: 943−972
Carstensen J, Andersen JH, Gustafsson BG, Conley DJ (2014) Deoxygenation of the Baltic Sea during the last century. Proc Natl Acad Sci USA 111: 5628−5633 Chróst RJ, Siuda W (2002) Ecology of microbial enzymes in
lake ecosystems. In: Burns RG, Dick RP (eds) Enzymes in the environment. Activity, ecology and applications.
Marcel Dekker, New York, NY, p 35−72
Conley DJ, Björck S, Bonsdorff E, Carstensen J and others (2009) Hypoxia-related processes in the Baltic Sea. Envi- ron Sci Technol 43: 3412−3420
Dauwe B, Middelburg JJ (1998) Amino acids and hexosamines as indicators of organic matter degradation state in North Sea sediments. Limnol Oceanogr 43: 782−798
Dauwe B, Middelburg JJ, Herman PMJ, Heip CHR (1999) Linking diagenetic alteration of amino acids and bulk organic matter reactivity. Limnol Oceanogr 44:
1809−1814
Del Giorgio PA, Cole JJ (1998) Bacterial growth efficiency in natural aquatic systems. Annu Rev Ecol Syst 29:
503−541
Dellwig O, Schnetger B, Meyer D, Pollehne F, Häusler K (2018) Impact of the major Baltic inflow in 2014 on man- ganese cycling in the Gotland Deep (Baltic Sea). Front Mar Sci 5: 1−20
Devol AH, Hartnett HE (2001) Role of the oxygen-deficient zone in transfer of organic carbon to the deep ocean.
Limnol Oceanogr 46: 1684−1690
Dittmar T, Cherrier J, Ludichowski KU (2009) The analysis of amino acids in seawater. In: Wurl O (ed) Practical guidelines for the analysis of seawater. CRC Press, Boca Raton, FL, p 67−78
Engel A, Galgani L (2016) The organic sea-surface micro- layer in the upwelling region off the coast of Peru and potential implications for air−sea exchange processes.
Biogeosciences 13: 989−1007
Engel A, Wagner H, Le Moigne FAC, Wilson ST (2017) Par- ticle export fluxes to the oxygen minimum zone of the eastern tropical North Atlantic. Biogeosciences 14:
1825−1838
Farnelid H, Bentzon-Tilia M, Andersson AF, Bertilsson S and others (2013) Active nitrogen-fixing heterotrophic bacteria at and below the chemocline of the central Baltic Sea. ISME J 7: 1413−1423
Feistel R, Nausch G, Matthäus W, Hagen E (2003) Temporal and spatial evolution of the Baltic deep water renewal in spring 2003. Oceanologia 45: 623−642
Field A, Miles J, Field Z (2012) Discovering statistics using R. SAGE Publications, London
Gasol JM, Del Giorgio PA (2000) Using flow cytometry for counting natural planktonic bacteria and understanding the structure of planktonic bacterial communities. Sci Mar 64: 197−224
Goldman JC, Caron DA, Dennett MR (1987) Regulation of gross growth efficiency and ammonium regeneration in bacteria by substrate C: N ratio. Limnol Oceanogr 32:
1239−1252
Grasshoff K, Kremlin K, Ehrhardt M (eds) (1999) Methods of seawater analysis., 3rd edn. Wiley-VCH, Weinheim Gruber N (2011) Warming up, turning sour, losing breath :
ocean biogeochemistry under global change. Phili Trans R Soc Lond A 369: 1980−1996
Gustafsson BG, Schenk F, Blenckner T, Eilola K and others (2012) Reconstructing the development of Baltic Sea eutrophication 1850-2006. Ambio 41:
534−548
Hagström A, Larsson U, Hörstedt P, Normark S (1979) Fre- quency of dividing cells, a new approach to the determi- nation of bacterial growth rates in aquatic environments.
Appl Environ Microbiol 37: 805−812
Hietanen S, Jäntti H, Buizert C, Jürgens K, Labrenz M, Voss M, Kuparinen J (2012) Hypoxia and nitrogen processing in the Baltic Sea water column. Limnol Oceanogr 57:
325−337
Hoppe HG (1983) Significance of exoenzymatic activities in the ecology of brackish water: measurements by means of methylumbelliferyl-substrates. Mar Ecol Prog Ser 11:
299−308
Hoppe HG, Gocke K, Kuparinen J (1990) Effect of H2S on
Author copy
heterotrophic substrate uptake, extracellular enzyme activity and growth of brackish water bacteria. Mar Ecol Prog Ser 64: 157−167
Hoppe HG, Arnosti C, Herndl GF (2002) Ecological signifi- cance of bacterial enzymes in the marine environment.
In: Burns R, Dick R (eds) Enzymes in the environment:
activity, ecology, and applications. Marcel Dekker, New York, NY, p 73−108
Ingalls AE, Shah SR, Hansman RL, Aluwihare LI, Santos GM, Druffel ERM, Pearson A (2006) Quantifying archaeal community autotrophy in the mesopelagic ocean using natural radiocarbon. Proc Natl Acad Sci USA 103: 6442−6447
Jiao N, Herndl GJ, Hansell DA, Benner R and others (2010) Microbial production of recalcitrant dissolved organic matter: long-term carbon storage in the global ocean.
Nat Rev Microbiol 8: 593−599
Jørgensen NOG, Tranvik LJ, Berg GM (1999) Occurrence and bacterial cycling of dissolved nitrogen in the Gulf of Riga, the Baltic Sea. Mar Ecol Prog Ser 191: 1−18 Jutterström S, Andersson HC, Omstedt A, Malmaeus JM
(2014) Multiple stressors threatening the future of the Baltic Sea−Kattegat marine ecosystem: implications for policy and management actions. Mar Pollut Bull 86:
468−480
Kaiser K, Benner R (2009) Biochemical composition and size distribution of organic matter at the Pacific and Atlantic time-series stations. Mar Chem 113: 63−77
Karner MB, Delong EF, Karl DM (2001) Archaeal dominance in the mesopelagic zone of the Pacific Ocean. Nature 409: 507−510
Karstensen J, Stramma L, Visbeck M (2008) Oxygen mini- mum zones in the eastern tropical Atlantic and Pacific oceans. Prog Oceanogr 77: 331−350
Keil RG, Neibauer JA, Biladeau C, Van Der Elst K, Devol AH (2016) A multiproxy approach to understanding the
‘enhanced’ flux of organic matter through the oxygen- deficient waters of the Arabian Sea. Biogeosciences 13:
2077−2092
Kirchman D, K’nees E, Hodson R (1985) Leucine incorpora- tion and its potential as a measure of protein synthesis by bacteria in natural aquatic systems. Appl Environ Micro- biol 49: 599−607
Koroleff F (1969) Direct determination of ammonia in natu- ral waters as indophenol blue. Int Con Explor Sea, C.M.
C:9
Kroer N (1993) Bacterial growth efficiency on natural dissolved organic matter. Limnol Oceanogr 38:
1282−1290
Lam P, Kuypers MMM (2011) Microbial nitrogen cycling processes in oxygen minimum zones. Annu Rev Mar Sci 3: 317−345
Larsson U, Hajdu S, Walve J, Elmgren R (2001) Baltic Sea nitrogen fixation estimated from the summer increase in summer mixed layer total nitrogen. Limnol Oceanogr 46:
811−820
Le Moigne FAC, Cisternas-Novoa C, Piontek J, Maßmig M, Engel A (2017) On the effect of low oxygen concentra- tions on bacterial degradation of sinking particles. Sci Rep 7: 16722
Lee C (1992) Controls on organic carbon preservation: the use of stratified water bodies to compare intrinsic rates of decomposition in oxic and anoxic systems. Geochim Cos- mochim Acta 56: 3323−3335
Lee S, Fuhrman JA (1987) Relationships between biovolume
and biomass of naturally derived marine bacterioplank- ton. Appl Environ Microbiol 53: 1298−1303
Lindroth P, Mopper K (1979) High performance liquid chro- matographic determination of subpicomole amounts of amino acids by precolumn fluorescence derivatization with o-phthaldialdehyde. Anal Chem 51: 1667−1674 Madigan M, Martinko J, Stahl D, Clark D (2012) Brock biol-
ogy of microorganisms, 13th edn. Pearson, San Fran- cisco, CA
Mohrholz V, Naumann M, Nausch G, Krüger S, Gräwe U (2015) Fresh oxygen for the Baltic Sea — an exceptional saline inflow after a decade of stagnation. J Mar Syst 148:
152−166
Morris BEL, Henneberger R, Huber H, Moissl-Eichinger C (2013) Microbial syntrophy: interaction for the common good. FEMS Microbiol Rev 37: 384−406
Nausch G, Matthäus W, Feistel R (2003) Hydrographic and hydrochemical conditions in the Gotland Deep area between 1992 and 2003. Oceanologia 45: 557−569 Nguyen RT, Harvey HR (1997) Protein and amino acid
cycling during phytoplankton decomposition in oxic and anoxic waters. Org Geochem 27: 115−128
Pantoja S, Rossel P, Castro R, Cuevas LA, Daneri G, Córdova C (2009) Microbial degradation rates of small peptides and amino acids in the oxygen minimum zone of Chilean coastal waters. Deep-Sea Res 56: 1055−1062
Paulmier A, Ruiz-Pino D (2009) Oxygen minimum zones (OMZs) in the modern ocean. Prog Oceanogr 80:
113−128
Proctor LM, Okubo A, Fuhrman JA (1993) Calibrating esti- mates of phage-induced mortality in marine bacteria:
ultrastructural studies of marine bacteriophage develop- ment from one-step growth experiments. Microb Ecol 25:
161−182
R Development Core Team (2008) R: a language and envi- ronment for statistical computing. R Foundation for Statistical Computing, Vienna
Ramsing N, Gundersen J. Seawater and gases: tabulated physical parameters of interest to people working with microsensors in marine systems. Unisense, Aarhus Schmidtko S, Stramma L, Visbeck M (2017) Decline in
global oceanic oxygen content during the past five decades. Nature 542: 335−339
Sharp JH (1974) Improved analysis for ‘particulate’ organic carbon and nitrogen from seawater. Limnol Oceanogr 19:
984−989
Simon M, Azam F (1989) Protein content and protein synthe- sis rates of planktonic marine bacteria. Mar Ecol Prog Ser 51: 201−213
Smith DC, Azam F (1992) A simple, economical method for measuring bacterial protein synthesis rates in seawater using 3H-leucine. Mar Microb Food Webs 6: 107−114 Solórzano I (1969) Determination of ammonia in natural sea-
water by the phenol-hypochlorite method. Limnol Oceanogr 14: 799−801
Stewart V (1988) Nitrate respiration in relation to facultative metabolism in Enterobacteria. Microbiol Rev 52: 190−232 Strohm TO, Griffin B, Zumft WG, Schink B (2007) Growth yields in bacterial denitrification and nitrate ammonifica- tion. Appl Environ Microbiol 73: 1420−1424
Sugimura Y, Suzuki Y (1988) A high-temperature catalytic oxidation method for the determination of non-volatile dissolved organic carbon in seawater by direct injection of a liquid sample. Mar Chem 24: 105−131
Taylor GT, Hein C, Iabichella M (2003) Temporal variations
Author copy
in viral distributions in the anoxic Cariaco Basin. Aquat Microb Ecol 30: 103−116
Thureborn P, Lundin D, Plathan J, Poole AM, Sjöberg BM, Sjölin S (2013) A metagenomics transect into the deepest point of the Baltic Sea reveals clear stratification of microbial functional capacities. PLOS ONE 8: e74983 Vahtera E, Conley DJ, Gustafsson BG, Kuosa H and others
(2007) Internal ecosystem feedbacks enhance nitrogen- fixing cyanobacteria blooms and complicate manage- ment in the Baltic Sea. Ambio 36: 186−194
Van Mooy BA, Keil RG, Devol AH (2002) Impact of sub- oxia on sinking particulate organic carbon: enhanced
carbon flux and preferential degradation of amino acids via denitrification. Geochim Cosmochim Acta 66:
457−465
Voss M, Emeis KC, Hille S, Neumann T, Dippner JW (2005) Nitrogen cycle of the Baltic Sea from an isotopic perspec- tive. Global Biogeochem Cycles 19: 1−15
Weinbauer MG, Höfle MG (1998) Significance of viral lysis and flagellate grazing as factors controlling bacterio- plankton production in a eutrophic lake. Appl Environ Microbiol 64: 431−438
Wilcox RR (2005) Introduction to robust estimation and hypothesis testing. Academic Press, San Diego, CA
Editorial responsibility: Gerhard Herndl, Vienna, Austria
Submitted: March 14, 2018; Accepted: March 4, 2019 Proofs received from author(s): June 2, 2019