Impact of West Antarctic Ice Shelf melting on the Southern Ocean Hydrography
Yoshihiro Nakayama
1,2, Ralph Timmermann
2, and Hartmut Hellmer
21Institute of Low Temperature Science, Hokkaido University, Japan
2Alfred Wegener Institute, Bremerhaven, Germany
Correspondence:Yoshihiro Nakayama (Yoshihiro.Nakayama@lowtem.hokudai.ac.jp)
Abstract.Previous studies show accelerations of West Antarctic glaciers, implying that basal melt rates of these glaciers were previously small and increased in the middle of the 20th century. This enhanced melting is a likely source of the observed Ross Sea (RS) freshening, but its long-term impact on the Southern Ocean hydrography has not been well investigated. Here, we conduct coupled sea-ice/ice-shelf/ocean simulations with different levels of ice shelf melting from West Antarctic glaciers.
Freshening of RS shelf and bottom water is simulated with enhanced West Antarctic ice shelf melting, while no significant 5
changes in shelf water properties are simulated when West Antarctic ice shelf melting is small. We further show that the fresh- ening caused by glacial meltwater from ice shelves in the Amundsen and Bellingshausen Seas propagates further downstream along the East Antarctic coast into the Weddell Sea. The freshening signal propagates onto the RS continental shelf within a year of model simulation, while it takes roughly 5-10 years and 10-15 years to propagate into the region off Cape Darnley and into the Weddell Sea, respectively. This advection of freshening modulates the properties of dense shelf water and possibly 10
impacts the production of Antarctic Bottom Water.
1 Introduction
Ice shelves in the Amundsen Sea (AS) and Bellingshausen Sea (BS) are melting and thinning rapidly, based on satellite-based estimates of the last∼20 years (Depoorter et al., 2013; Rignot et al., 2013; Paolo et al., 2015), contributing significantly to ongoing sea level rise and ocean freshening through a high discharge of grounded ice (Shepherd et al., 2012; Rignot et al., 15
2013). The main cause for high basal melt rates is the relatively warm Circumpolar Deep Water (CDW, about 0.5–1.5◦C, located below∼300–500 m depth), which flows via submarine glacial troughs from the continental shelf break into the ice shelf cavities (e.g. Jacobs et al., 1996; Nakayama et al., 2013; Dutrieux et al., 2014; Webber et al., 2017; Jenkins et al., 2018).
Their recent high basal melt rates coincide with a few glaciological observations, that show evidence for a sustained increase of ice discharge for most glaciers in the eastern AS since 1973 (e.g. Ferrigno et al., 1993; Lucchita and Rosanova, 1997; Rignot, 20
1998; Mouginot et al., 2014). There exist a few other evidences implying that basal melt rates of these glaciers were previously small and started increasing from the middle of the 20th century (Hillenbrand et al., 2017; Smith et al., 2017).
In the Ross Sea (RS), shelf water is freshening, leading to a change in the Antarctic Bottom Water (AABW) properties (Jacobs et al., 2002; Jacobs and Giulivi, 2010). Since the salinity decrease leads to a change in AABW characteristics formed
in the RS (Jacobs et al., 2002; Aoki et al., 2005; Rintoul, 2007; Jacobs and Giulivi, 2010) and may influence the global 25
thermohaline circulation, understanding the possible link between the melting of West Antarctic ice shelves and RS freshening is important for assessing long-term changes in the Southern Ocean.
Nakayama et al. (2014) showed the spreading pathways of glacial meltwater from ice shelves in the AS and BS, which may end up on the RS continental shelf. However, due to the difficulties in a realistic representation of Southern Ocean hydrography as well as basal melt rates, their global model simulations are limited to 10 years. Using circum-Antarctic or global domains, 30
Kusahara and Hasumi (2014); Dinniman et al. (2016); Kusahara et al. (2017) also showed pathways of glacial meltwater using passive tracers, confirming that glacial meltwater from the AS and BS ice shelves flows westwards onto the RS continental shelf. However, in these studies, pathways of glacial melt tracers are mostly discussed for steady (or control) simulation and the impact of glacial melt on the Antarctic coastal freshening is not discussed. Recently, many ocean simulations are developed for studying oceanographic conditions in the Amundsen Sea, but they employ regional models with more focuses on CDW 35
intrusions onto the Amundsen Sea continental shelf (e.g. Thoma et al., 2008; Schodlok et al., 2012; Assmann et al., 2013;
St-Laurent et al., 2015; Kimura et al., 2017; Nakayama et al., 2018; Webber et al., 2019).
After development of the global Finite-Element Sea-ice/ice-shelf/Ocean Model (FESOM) (Timmermann et al., 2012; Nakayama et al., 2014), we are now able to carry out longer integration of our simulation with more realistic hydrographic representations of the Antarctic coastal regions. In this study, we conduct 32-year simulations to analyze the impact of glacial meltwater on 40
the Southern Ocean freshening. We also conduct three other sensitivity experiments with different ice shelf melt rates in the AS and BS.
2 Model
Here, we investigate ocean states in the AS and BS using the FESOM (Timmermann et al., 2012; Nakayama et al., 2014). Ice shelf draft, cavity geometry, and global ocean bathymetry are derived from the RTopo-1 dataset (Timmermann et al., 2010). We 45
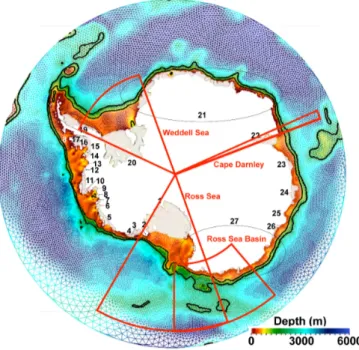
use a tetrahedral mesh with a horizontal spacing of∼100 km along non-Antarctic coasts, refined to∼20 km along the Antarctic coast, 10-20 km under the large ice shelves in the RS and Weddell Sea (WS), and∼5 km in the central AS and BS (Fig. 1).
We apply a hybrid vertical coordinate system with 46 layers and a z-level discretization in the mid- and low-latitude ocean basins. The top 21 layers along the Antarctic coast are terrain-following (sigma coordinate) for depths shallower than 650 m.
In the z-coordinate region, bottom nodes are allowed to deviate from their nominal layer depth in order to allow for a correct 50
representation of bottom topography, similar to the shaved-cell approach in finite-difference models. A Gaussian function with a width depending on the model’s horizontal resolution is applied to smooth ice shelf draft and sea-floor topography in the sigma-coordinate region. Ocean bathymetry south of 55◦S of the global model is shown in Fig. 1. We assume a steady state for ice shelf thickness and cavity geometry, and compute the mass loss rate at ice-shelf bases (Hellmer and Olbers, 1989; Holland and Jenkins, 1999). Unlike the previous study (Nakayama et al., 2014), no restoring is applied to any region of our model 55
domain. Model parameters used in this study are summarized in Table S1.
We carry out two sensitivity simulations for 32 years using the ERA-Interim reanalysis product (1979-2010) (Dee et al., 2011). Low and realistic rates of ice shelf melting (Table S2, referred to LMELT and CTRL, respectively) are introduced by changing the heat and salt transfer coefficients at the interface between ocean and those ice shelves fringing the AS and BS (Table S3). For the LMELT case, the coefficients are chosen following previous studies (Hellmer and Olbers, 1989; Holland 60
and Jenkins, 1999), while they are set to 3-times larger values for the CTRL case. We note that adjusting the heat and salt transfer coefficients is a convenient way to force the ocean model with realistic freshwater fluxes from ice shelves (Jourdain et al., 2017; Nakayama et al., 2017). We conduct a model spin-up of 10 years (1979-1988) using the LMELT set up, while the CTRL case represents the transient response of the ocean to a step change of AS and BS ice shelf melting. We further conduct two other sensitivity experiments (MMELT and HMELT), which are discussed in section 3.2. To track the basal meltwater, we 65
use a virtual passive tracer, which is released at the same rate as the glacial melt only from ice shelves in the AS and BS.
3 Results
3.1 Model Evaluation
Both LMELT and CTRL produce many features of ocean circulation, water mass properties, and sea-ice distribution in good agreement with observations. The integrated transport of the Ross Gyre is∼30 Sv (1Sv=106m3 s−1) and the Antarctic Cir- 70
cumpolar Current (ACC) carries∼160 Sv through Drake Passage (Mazloff et al., 2010; Renault et al., 2011). The simulated austral winter (September) sea-ice extent is similar to observations (Cavalieri et al., 2006), while the austral summer (March) sea-ice extent is underestimated by∼35%. The bottom temperature on the continental shelf is mostly close to the freezing point except for regions with CDW intrusions onto the AS and BS continental shelves (Figs. 2 and S1). Bottom salinity shows local salinity maxima towards the western WS and RS, and a zonal-shelf gradient with higher salinity at the eastern side in the 75
AS and BS (Figs. 2 and S1). These features are present both in the observations and the model results (Schmidtko et al., 2014;
Jenkins et al., 2016).
As a result of the different heat and salt transfer coefficients, the total ice shelf basal mass losses are 192 Gt yr−1and 336 Gt yr−1in the AS, and 131 Gt yr−1and 223 Gt yr−1in the BS for LMELT and CTRL, respectively (Table S3). For the AS and BS, the CTRL loss rates are slightly lower than satellite-based estimates between 2003-2009 (Depoorter et al., 2013; Rignot et al., 80
2013) (Table S3). The total LMELT loss rate of all AS and BS ice shelves is 323 Gt yr−1, which is∼130 Gt yr−1smaller than the steady state melt rates (assuming zero thickening) of 459 Gt yr−1estimated based on 2006-2007 ice shelf configurations (Rignot et al., 2013). However, LMELT case may represent the melt rates at that the time in the middle of the last century, considering the fact that ice shelf cavity geometry should have evolved largely since then (Jenkins et al., 2010; Smith et al., 2017) and West Antarctic glaciers should have flown much slower at the time (Mouginot et al., 2014).
85
For the LMELT case, the impact of freshening is small and the LMELT case does not show significant shelf water property changes during the model integration (Fig. 3, left column). For example, RS shelf salinity at 200-m depth remains stable at
∼34.7 g kg−1for the LMELT case (Fig. 3). Both LMELT and CTRL cases show glacial meltwater spreading downstream onto the RS continental shelf further along the east Antarctic coast and towards the northwestern WS within the ACC (Nakayama
et al., 2014; Dinniman et al., 2016) (Fig. 2). In response to enhanced ice shelf melting, CTRL shows glacial meltwater spreading 90
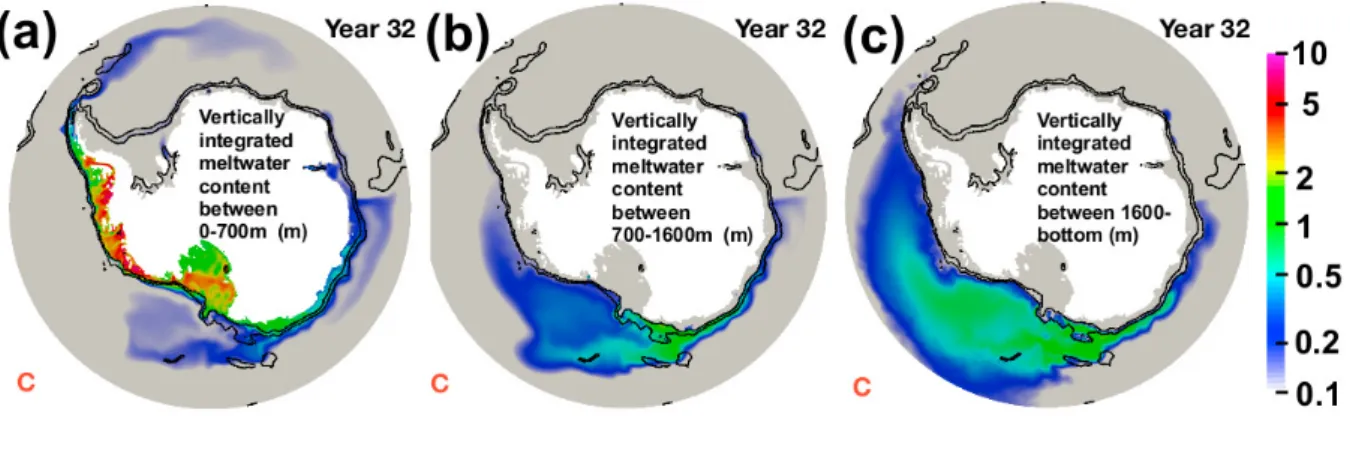
further downstream (Fig. 2). The simulated bottom salinity difference between LMELT and CTRL shows a freshening along the western AS coast (year 5, Fig. 3c), which spreads further westward onto the RS continental shelf (year 10-32, Fig .3). This freshening extends down to the bottom of the RS basin as a result of the formation and descent of dense shelf water. We note that the RS is the only location where a large amount of glacial melt from the AS and BS reaches the deep ocean (Fig. 4). For CTRL, 19% and 36% of the total glacial meltwater tracer from ice shelves in the AS and BS descend to depths of 700-1600m 95
and 1600m-bottom, respectively, most of which is found in the RS basin after 32 years of simulation (Fig. 4).
We compare the CTRL results with recent observations. RS dense shelf water observed for about 50 years shows a salinity decline of 0.03 g kg−1per decade (Jacobs et al., 2002; Jacobs and Giulivi, 2010). Warming and freshening of Ross Sea Bottom Water (RSBW) (Purkey and Johnson, 2013) extend further westward off the Adélie Land (Aoki et al., 2005; Rintoul, 2007) and RSBW shows warming and freshening of∼0.1◦C and∼0.01 g kg−1, respectively, between 1992-2011 at 180◦E along S04P 100
section (Purkey and Johnson, 2013). Despite underestimated by∼50% in magnitude, these features are reproduced in CTRL, as the RS dense shelf water freshens by∼0.045 g kg−1over 32 years (Fig. 3l, Table S4). This dense shelf water descends to the deep ocean causing a simulated RSBW warming and freshening of∼0.02◦C and∼0.005 g kg−1, respectively, over 32 years (see the black arrow in Fig. S2).
3.2 Spreading of glacial meltwater from West Antarctic ice shelves 105
We conduct two additional sensitivity experiments and investigate the impact of enhanced ice shelf melting in the AS and BS focusing on both small (200-m depth) and large (bottom) depths. Medium and high rates of ice shelf melting (Table S2, referred to MMELT and HMELT, respectively) are introduced with heat and salt transfer coefficients being set to 2-times and 30-times larger values, respectively. The total ice shelf basal mass losses are 280 Gt yr−1and 592 Gt yr−1in the AS, and 186 Gt yr−1and 385 Gt yr−1in the BS for MMELT and HMELT, respectively (Table S3).
110
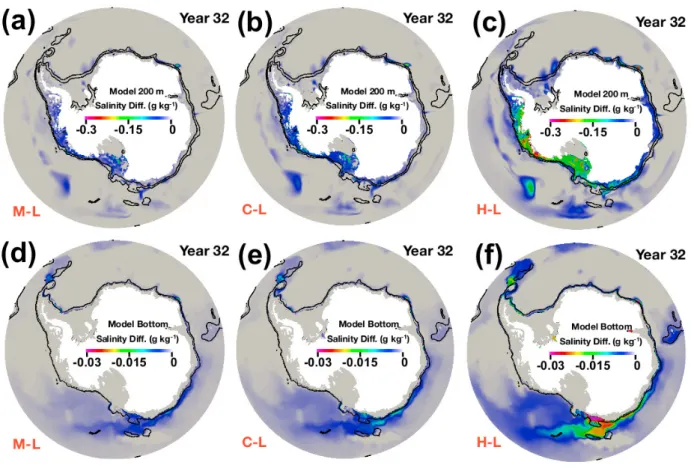
We subtract the LMELT results from MMELT, CTRL, and HMELT and use the last-2-year temporally averaged fields to investigate the impact of enhanced ice shelf melting. We calculate spatial averages for the regions indicated in Fig. 1 but using regions shallower than 1000 m and deeper than 2500 m for on-shelf 200-m and bottom spatially averaged salinity, respectively (Table S4). For MMELT-LMELT, the salinity decrease is confined mostly to the AS, BS, and RS continental shelves with a freshening of 0.025 g kg−1 and 0.0030 g kg−1 for the RS continental shelf and RS bottom basin, respectively (Table S4).
115
Freshening in other regions is small at 200-m depth amounting to 0.0038 g kg−1and 0.0003 g kg−1for the continental shelf off Cape Darnley (CD) and the WS continental shelf, respectively (Table S4). For the CTRL case, the freshwater signal extends along the east Antarctic coast all the way to the WS with values of 0.045, 0.0048, 0.0078, and 0.0035 for the RS shelf, RS bottom, off CD, and WS shelf regions, respectively (Fig. 5, Table S4). For the HMELT case, the spatial freshening pattern remains similar to the CTRL case amounting to 0.14, 0.0015, 0.035, and 0.016 for the RS shelf, RS bottom, off CD, and WS 120
shelf regions, respectively (Fig. 5, Table S4).
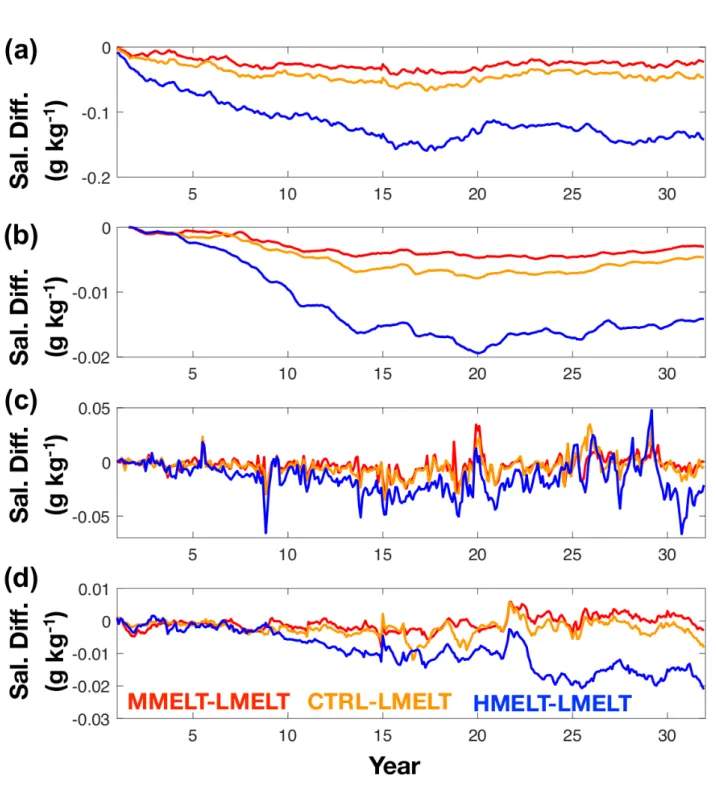
Our experiments clearly show the timescales for the freshening signal to reach other regions around the Antarctic continent.
For all cases, the freshening signal propagates onto the RS continental shelf within a year of model simulation (Fig. 6). It takes
roughly 5 more years for this freshening signal to become visible in the deeper part of the RS basin (Fig. 6). Another branch of the freshening signal further propagates near the surface along the east Antarctic coast taking roughly 5-10 years and 10-15 125
years to propagate into the region off CD and into the WS, respectively. Since the salinity decrease continues even after model year 32 in these regions (Figs. 6 c and d), it seems to take a long time (over 32 years) for the Southern Ocean to adjust to the new state of enhanced ice shelf melting in the AS and BS.
4 Discussion
We show that enhanced ice shelf melting modifies the properties of RS shelf water (Figs. 5 and 6), possibly with consequences 130
for the global thermohaline circulation. In the RS, the difference between high salinity shelf water and CDW is∼0.2 g kg−1, and RS dense shelf water production could be strongly affected, if the total ice shelf melting in the AS and BS would increase to a level similar to or larger than in the HMELT case (Figs. 5 and 6). The model results also show that the Southern Ocean freshening extends along the East Antarctic coast and into the WS, similar to the idea presented by (e.g. Beckmann and Timmermann, 2001). Due to much stronger seasonal and interannual variability in the near-surface layers and long response 135
time scales of 15-20 years (Figs. 6c and d), we are likely not able to extract the effect of enhanced ice shelf melting from the existing observations in these regions. However, considering the magnitude of the salinity decrease in the CTRL experiment, circum-Antarctic freshening could be possibly undergoing.
We also note that magnitudes of freshening caused by glacial meltwater from ice shelves in the AS and BS represent linear and nonlinear behaviors. For the RS shelf and deep RS, magnitudes of freshening linearly increase as ice shelf melting in the 140
AS and BS enhances (total melt rate difference in Table S4). For example, AS and BS ice shelf melting increases by 138 Gt yr−1, 231 Gt yr−1, and 643 Gt yr−1 and simulated freshening is 0.025 g kg−1, 0.045 g kg−1, and 0.14 g kg−1for the RS shelf region and 0.030 g kg−1, 0.048 g kg−1, and 0.015 g kg−1for the deep RS region for MMELT, CTRL, and HMELT cases compared to the LMELT case, respectively. However, freshening off CD region is 0.0038 g kg−1, 0.0078 g kg−1, and 0.035 g kg−1and freshening in the WS shelf is 0.0003 g kg−1, 0.0035 g kg−1, and 0.016 g kg−1for the MMELT, CTRL, and HMELT 145
cases compared to the LMELT case, respectively, representing much enhanced freshening for HMELT. This implies that the large-scale impact of freshening caused by ice shelves in the AS and BS may not be negligible especially for the region further downstream along the Antarctic coast.
5 Conclusions
In this study, we conduct four 32-year simulations with different levels of ice shelf melting in the AS and BS to investigate 150
the impact of glacial meltwater on the Southern Ocean hydrography. The total ice shelf melt rates from AS and BS are 333 Gt yr−1, 466 Gt yr−1, 559 Gt yr−1, and 978 Gt yr−1for LMELT, MMELT, CTRL, and HMELT cases, respectively (Tables S2 and S3). We show that the LMELT results represent a quasi-steady state with a stable RS shelf water salinity of∼34.7 g kg−1, and the CTRL results show a RS continental shelf and deep ocean freshening with some similarities to existing observations
(Fig. 3). We further show that glacial meltwater from the AS and BS ice shelves propagates further downstream along the East 155
Antarctic coast leading to salinity decreases in the WS and off CD (Figs. 5 and 6). The freshening signal propagates onto the RS continental shelf within a year of model simulation, while it takes roughly 5-10 years and 10-15 years to propagate into the region off Cape Darnley and into the Weddell Sea, respectively. This possibly modulates the properties of dense shelf water and impacts the production of AABW. We also show that magnitudes of freshening caused by glacial meltwater from the AS and BS represent linear and nonlinear behaviors (Table S4), emphasizing the importance of ice shelf melting in the AS and 160
BS. Considering the spatial and temporal scales of how glacial meltwater from AS and BS spreads around Antarctica, further investigations as well as model developments are required for understanding the impact of West Antarctic ice shelf melting on the circum-Antarctic and global ocean.
Code availability. Model codes presented in this study are available from the authors upon request and without conditions.
Data availability. Datasets presented in this study are available from the authors upon request and without conditions.
165
Author contributions. YN prepared the manuscript, conducted ocean simulations. RT and HH helped interpreting the results. All authors commented the manuscript.
Competing interests. The authors declare no competing interests.
Acknowledgements. We thank Dmitry Sidorenko and Lukrecia Stulic for their numerical and technical support and Sunke Schmidtko for sharing the observed data. Alex Gardner, Andrew Thompson, Dimitris Menemenlis, Eric Rignot, Surendra Adhikari, Stan Jacobs, and Shigeru 170
Aoki provided helpful comments and suggestions. Simulations were carried out at the Supercomputing Division, Information Technology Center at University of Tokyo and at the North-German Supercomputing Alliance (HLRN). We acknowledge funding by the Helmholtz Climate Initiative REKLIM (Regional Climate Change), a joint research project of the Helmholtz Association of German Research Cen- tres (HGF). The model code, processing tools, and raw model output are difficult to make publicly available, and the authors recommend contacting the corresponding author for those interested in accessing the data.
175
References
Aoki, S., Rintoul, S. R., Ushio, S., Watanabe, S., and Bindoff, N. L.: Freshening of the Adélie Land Bottom water near 140 E, Geophysical Research Letters, 32, 2005.
Assmann, K., Jenkins, A., Shoosmith, D., Walker, D., Jacobs, S., and Nicholls, K.: Variability of Circumpolar Deep Water transport onto the Amundsen Sea continental shelf through a shelf break trough, J. Geophys. Res., 118, 6603–6620, 2013.
180
Beckmann, A. and Timmermann, R.: Circumpolar influences on the Weddell Sea: Indication of an Antarctic circumpolar coastal wave, Journal of Climate, 14, 3785–3792, 2001.
Cavalieri, D., Parkinson, C., Gloersen, P., and Zwally, H.: Sea ice concentrations from Nimbus-7 SMMR and DMSP SSM/I passive mi- crowave data, January 1979-June 2006, 2006.
Dee, D., Uppala, S., Simmons, A., Berrisford, P., Poli, P., Kobayashi, S., Andrae, U., Balmaseda, M., Balsamo, G., Bauer, P., et al.: The 185
ERA-Interim reanalysis: Configuration and performance of the data assimilation system, Quarterly Journal of the Royal Meteorological Society, 137, 553–597, 2011.
Depoorter, M., Bamber, J., Griggs, J., Lenaerts, J., Ligtenberg, S., van den Broeke, M., and Moholdt, G.: Calving fluxes and basal melt rates of Antarctic ice shelves, Nature, 502, 89–92, 2013.
Dinniman, M. S., Asay-Davis, X. S., Galton-Fenzi, B. K., Holland, P. R., Jenkins, A., and Timmermann, R.: Modeling ice shelf/ocean 190
interaction in Antarctica: A review, Oceanography, 29, 144–153, 2016.
Dutrieux, P., De Rydt, J., Jenkins, A., Holland, P. R., Ha, H. K., Lee, S. H., Steig, E. J., Ding, Q., Abrahamsen, E. P., and Schröder, M.:
Strong sensitivity of Pine Island ice-shelf melting to climatic variability, Science, 343, 174–178, 2014.
Ferrigno, J. G., Lucchitta, B. K., Mullins, K., Allison, A., Allen, R., and Gould, W.: Velocity measurements and changes in position of Thwaites Glacier/iceberg tongue from aerial photography, Landsat images and NOAA AVHRR data, Annals of Glaciology, 17, 239–244, 195
1993.
Hellmer, H. and Olbers, D.: A two-dimensional model for the thermohaline circulation under an ice shelf, Antarctic Science, 1, 325–336, 1989.
Hillenbrand, C.-D., Smith, J. A., Hodell, D. A., Greaves, M., Poole, C. R., Kender, S., Williams, M., Andersen, T. J., Jernas, P. E., Elderfield, H., et al.: West Antarctic Ice Sheet retreat driven by Holocene warm water incursions, Nature, 547, 43–48, 2017.
200
Holland, D. M. and Jenkins, A.: Modeling thermodynamic ice-ocean interactions at the base of an ice shelf, J. Phys. Oceanogr., 29, 1787–
1800, 1999.
Jacobs, S. S. and Giulivi, C. F.: Large multidecadal salinity trends near the Pacific-Antarctic continental margin, J. Clim., 23, 4508–4524, 2010.
Jacobs, S. S., Hellmer, H. H., and Jenkins, A.: Antarctic ice sheet melting in the Southeast Pacific, Geophys. Res. Lett., 23, 957–960, 1996.
205
Jacobs, S. S., Giulivi, C. F., and Mele, P. A.: Freshening of the Ross Sea during the late 20th century, Science, 297, 386–389, 2002.
Jenkins, A., Dutrieux, P., Jacobs, S. S., McPhail, S. D., Perrett, J. R., Webb, A. T., and White, D.: Observations beneath Pine Island Glacier in West Antarctica and implications for its retreat, Nat. Geosci., 3, 468–472, 2010.
Jenkins, A., Dutrieux, P., Jacobs, S., Steig, E. J., Gudmundsson, G. H., Smith, J., and Heywood, K. J.: Decadal ocean forcing and Antarctic Ice Sheet response: Lessons from the Amundsen Sea, Oceanography, 29, 106–117, 2016.
210
Jenkins, A., Shoosmith, D., Dutrieux, P., Jacobs, S., Kim, T. W., Lee, S. H., Ha, H. K., and Stammerjohn, S.: West AntarcticIce Sheet retreat in the Amundsen Sea driven by decadal oceanic variability, Nature Geoscience, 11, 733, 2018.
Jourdain, N. C., Mathiot, P., Merino, N., Durand, G., Le Sommer, J., Spence, P., Dutrieux, P., and Madec, G.: Ocean circulation and sea-ice thinning induced by melting ice shelves in the Amundsen Sea, Journal of Geophysical Research: Oceans, 122, 2550–2573, 2017.
Kimura, S., Jenkins, A., Regan, H., Holland, P. R., Assmann, K. M., Whitt, D. B., Van Wessem, M., van de Berg, W. J., Reijmer, C. H., and 215
Dutrieux, P.: Oceanographic Controls on the Variability of Ice-Shelf Basal Melting and Circulation of Glacial Meltwater in the Amundsen Sea Embayment, Antarctica, Journal of Geophysical Research: Oceans, 122, 10 131–10 155, 2017.
Kusahara, K. and Hasumi, H.: Pathways of basal meltwater from Antarctic ice shelves: A model study, J. Geophys. Res. Lett., 2014.
Kusahara, K., Williams, G. D., Tamura, T., Massom, R., and Hasumi, H.: Dense shelf water spreading from A ntarctic coastal polynyas to the deep S outhern O cean: A regional circumpolar model study, Journal of Geophysical Research: Oceans, 122, 6238–6253, 2017.
220
Lucchita, B. K. and Rosanova, C. E.: Velocities of Pine Island and Thwaites glaciers, West Antarctica, from ERS-1 SAR images, 1997.
Mazloff, M. R., Heimbach, P., and Wunsch, C.: An eddy-permitting Southern Ocean state estimate, Journal of Physical Oceanography, 40, 880–899, 2010.
Mouginot, J., Rignot, E., and Scheuchl, B.: Sustained increase in ice discharge from the Amundsen Sea Embayment, West Antarctica, from 1973 to 2013, Geophysical Research Letters, 41, 1576–1584, 2014.
225
Nakayama, Y., Schröder, M., and Hellmer, H. H.: From Circumpolar Deep Water to the glacial meltwater plume on the eastern Amundsen Shelf, Deep Sea Res. I, 77, 50–62, 2013.
Nakayama, Y., Timmermann, R., Rodehacke, C. B., Schröder, M., and Hellmer, H. H.: Modeling the spreading of glacial meltwater from the Amundsen and Bellingshausen Seas, Geophysical Research Letters, 41, 7942–7949, 2014.
Nakayama, Y., Menemenlis, D., Schodlok, M., and Rignot, E.: Amundsen and Bellingshausen Seas simulation with optimized ocean, sea 230
ice, and thermodynamic ice shelf model parameters, Journal of Geophysical Research: Oceans, 122, 6180–6195, 2017.
Nakayama, Y., Menemenlis, D., Zhang, H., Schodlok, M., and Rignot, E.: Origin of Circumpolar Deep Water intruding onto the Amundsen and Bellingshausen Sea continental shelves, Nature communications, 9, 3403, 2018.
Paolo, F. S., Fricker, H. A., and Padman, L.: Volume loss from Antarctic ice shelves is accelerating, Science, 348, 327–331, 2015.
Purkey, S. G. and Johnson, G. C.: Antarctic Bottom Water warming and freshening: Contributions to sea level rise, ocean freshwater budgets, 235
and global heat gain, Journal of Climate, 26, 6105–6122, 2013.
Renault, A., Provost, C., Sennéchael, N., Barré, N., and Kartavtseff, A.: Two full-depth velocity sections in the Drake Passage in 2006?Trans- port estimates, Deep Sea Research Part II: Topical Studies in Oceanography, 58, 2572–2591, 2011.
Rignot, E., Jacobs, S. S., Mouginot, J., and Scheuchl, B.: Ice-shelf melting around Antarctica, Science Express, 341, 226–270, 2013.
Rignot, E. J.: Fast recession of a West Antarctic glacier, Science, 281, 549, 1998.
240
Rintoul, S. R.: Rapid freshening of Antarctic Bottom Water formed in the Indian and Pacific oceans, Geophys. Res. Lett., 34, L06 606, 2007.
Schmidtko, S., Heywood, K. J., Thompson, A. F., and Aoki, S.: Multidecadal warming of Antarctic waters, Science, 346, 1227–1231, 2014.
Schodlok, M. P., Menemenlis, D., Rignot, E., and Studinger, M.: Sensitivity of the ice shelf ocean system to the sub-ice shelf cavity shape measured by NASA IceBridge in Pine Island Glacier, West Antarctica, Ann. Glaciol., 53, 156–162, 2012.
Shepherd, A., Ivins, E., Geruo, A., Barletta, V., Bentley, M., Bettadpur, S., Briggs, K., Bromwich, D., Forsberg, R., Galin, N., et al.: A 245
reconciled estimate of ice-sheet mass balance, Science, 338, 1183–1189, 2012.
Smith, J., Andersen, T. J., Shortt, M., Gaffney, A., Truffer, M., Stanton, T., Bindschadler, R., Dutrieux, P., Jenkins, A., Hillenbrand, C.-D., et al.: Sub-ice-shelf sediments record history of twentieth-century retreat of Pine Island Glacier, Nature, 541, 77–80, 2017.
St-Laurent, P., Klinck, J., and Dinniman, M.: Impact of local winter cooling on the melt of Pine Island Glacier, Antarctica, Journal of Geophysical Research: Oceans, 120, 6718–6732, 2015.
250
Thoma, M., Jenkins, A., Holland, D., and Jacobs, S.: Modelling Circumpolar Deep Water intrusions on the Amundsen Sea continental shelf, Antarctica, Geophys. Res. Lett., 35, 2008.
Timmermann, R., Brocq, A. L., Deen, T., Domack, E., Dutrieux, P., Galton-Fenzi, B., Hellmer, H., Humbert, A., Jansen, D., Jenkins, A., et al.: A consistent data set of Antarctic Ice Sheet topography, cavity geometry, and global bathymetry, Earth System Science Data, 2, 261–273, 2010.
255
Timmermann, R., Wang, Q., and Hellmer, H.: Ice-shelf basal melting in a global finite-element sea-ice/ice-shelf/ocean model, Ann. Glaciol., 53, 303–314, 2012.
Webber, B. G., Heywood, K. J., Stevens, D. P., Dutrieux, P., Abrahamsen, E. P., Jenkins, A., Jacobs, S. S., Ha, H. K., Lee, S. H., and Kim, T. W.: Mechanisms driving variability in the ocean forcing of Pine Island Glacier, Nature Communications, 8, 14 507, 2017.
Webber, B. G., Heywood, K. J., Stevens, D. P., and Assmann, K. M.: The impact of overturning and horizontal circulation in Pine Island 260
Trough on ice shelf melt in the eastern Amundsen Sea, Journal of Physical Oceanography, 49, 63–83, 2019.
Figure 1.Horizontal grid (triangles) and model bathymetry (color) south of 55ºS in the global model. The bathymetry contours of 1000 m and 2500 m are shown as black lines. Locations of ice shelves are indicated by numbers summarized in Table S3. Basal melt rates are integrated for several ice shelves in the WS and East Antarctica, bordered by ellipses, for model-data comparison (Table S3). The regions enclosed by red lines represent the RS, RS Basin, CD, and WS regions in which spatially averages are calculated (Table S4 and Fig. 6).
Figure 2.January mean bottom properties for (a) potential temperature and (b) absolute salinity for the CTRL case for year 32. Insets of the observed bottom properties (Schmidtko et al., 2014) are shown in (a) and (b). (c-d) January mean vertically integrated tracer contents representing the glacial meltwater only from ice shelves in the AS and BS for LMELT and CTRL cases for year 32. The letters C and L at the bottom left of each panel indicate CTRL and LMELT, respectively. The bathymetry contours of 1000 m and 2500 m are shown as black lines. AS, BS, RS, and WS stand for the Amundsen, Bellingshausen, Ross, and Weddell Seas.
Figure 3.January mean bottom absolute salinity for LMELT (L) and CTRL (C) and the differences (C-L) for years 5, 10, 20, and 32. The differences are shown for the region enclosed by the blue line in (a). The bathymetry contours of 1000 m and 2500 m are shown as black lines. Ice shelves are shaded with transparent white.
Figure 4.January mean vertically integrated glacial meltwater content between (a) 0-700 m, (b) 700-1600 m, and (c) 1600 m to bottom of year 32 for CTRL case (C). The bathymetry contours of 1000 m and 2500 m are shown as black lines.
Figure 5.January mean absolute salinity differences between MMELT and LMELT (M-L) for year 32 at (a) 200-m depth and (d) bottom.
Same for CTRL (C-L) and HMELT (H-L) shown in (b,e) and (c,f), respectively. Bottom properties are only shown for regions deeper than 1500m. The bathymetry contours of 1000 m and 2500 m are shown as black lines.
Figure 6.Time series of spatially averaged salinity difference over (a) RS continental shelf at 200-m depth, (b) bottom RS basin, (c) continental shelf region off CD at 200-m depth, and (d) WS continental shelf at 200-m depth. Spatial averages have been calculated for the regions indicated in Fig. S1 but using regions shallower than 1000 m and deeper than 2500 m for on-shelf 200-m spatially averaged and bottom spatially averaged salinity, respectively (Table S4). LMELT fields are subtracted from HMELT (blue), CTRL (orange), and MMELT (red) fields to calculate the differences.