ALKOR-Berichte
Baltic Sea Geophysical Student Field Trip
Cruise No. AL527
06.09.2019 – 14.09.2019 Kiel (Germany) – Kiel (Germany)
Sebastian Krastel, Christian Berndt, Jens Schneider v. Deimling, Kai- Frederik Lenz, Philipp Held, Michael Kühn, Per Oscar Nilsson, Anna
Christina Hans, Tatjana Michaela Weiler, Jonas Liebsch, Theresa Prigan, Tilman May, Johanna Klein, Kelvin Rathjens, Pascal Koch
Sebastian Krastel
Christian-Albrechts-Universität zu Kiel
2019
1 Preface 3
2 Summary 4
3 Introduction 5
4 Narrative of the Cruise 8
5 Participants 11
6 Methodology 13
6.1 2D reflection seismic . . . 13
6.2 NORBIT Multibeam . . . 14
6.3 INNOMAR Sediment echosounder . . . 16
6.4 EK60 fishery echosounder . . . 16
6.5 Gravity core and grabber sediment sampling . . . 16
6.6 Video Camera . . . 18
7 Preliminary Results 19 7.1 Identification of sediment and biological characteristics . . . 19
7.2 Fate of the seafloor observatory at Boknis Eck . . . 21
7.3 Spatial expansion and geological structure of a former beach in the Bay of Lübeck . . . 22
7.4 Acoustic characterisation of gas . . . 24
7.5 Tectonic structures in the Bay of Mecklenburg . . . 27
8 References 29
9 Acknowledgements 30
10 Acquisition protocols 31
11 List of Stations 39
1 Preface
Cruise AL527 was carried out as a marine geophysical field course of Kiel University.
One task for the participating students was the preparation of the cruise report. Hence, the focus of this report is on the description of methods and data acquisition but it also includes some first result. Some parts of the report are not written in a typical way for cruise reports but we (Christian Berndt, Jens Schneider von Deimling, Sebastian Krastel) decided not to modify the student’s report because it documents the activities of the field course.
2 Summary
The cruise AL527 took place in the Western Baltic Sea in the period 6. – 14.09.2019.
The cruise was carried out as a marine geophysical field course of Kiel University, supported by BONUS ECOMAP project. Starting and ending point of the cruise was Kiel. One stopover in Kiel took place during the cruise due to an exchange of parts of the scientific party (10.09.2019). The main aim of the cruise was to introduce marine geophysical acquisition to the students including hands-on experience in collecting ma- rine geophysical data. This approach also included a first processing and interpretation of the data as well as the presentation of the first results.
Two areas in the Western Baltic Sea were the main working areas of AL527. The first survey area was at Boknis Eck, a part of the Eckernförde Bay. The main objective in this area was to search for an underwater observatory from the Coastal Observing System for Northern and Arctic Seas Project (COSYNA), which was operated by GEOMAR and disappeared end of August 2019. For this purpose, a survey with a bathymetric multibeam system from the ”Marine Geophysics and Hydroacoustics” working group (Kiel University) was carried out. Furthermore, an underwater camera system was used for visual inspections. The second survey area was in the Mecklenburger Bay. The main objective was a pre-investigation of a buried beach for an upcoming cruise within the EU-funded project ACT-SENSE. Therefore, 2D reflections seismic, sediment echo sounder, and multibeam data were acquired. Additionally, 7 gravity cores were taken for ground trothing and sampling of the buried beach. In order to analyze major tectonic structures in the Fehmarn Belt and the Mecklenburger Bay, 12 additional seismic profiles were collected when transiting between the survey areas.
Our investigations showed that a buried beach is located in the Mecklenburger Bay beneath a layer of mud. The sand deposits have an estimated variable thickness between 1m and 9m in the survey area. The top of the beach was successfully sampled with several gravity cores. Further investigations of these cores, together with the geophysical data, will be take place in the frame of the ACT-SENSE project.
In the acquired bathymetric dataset from Boknis Eck some conspicuous zones could be identified, where possibly remaining parts of the missing underwater observatory are located. Unfortunately, it was not possible to validate these zones by the used underwater camera. These zones should be investigated by divers in the near future, for a reliable validation.
3 Introduction
The geophysical student field training cruise AL527 took place in the german territory of the Baltic Sea, more precisely in the Bay of Eckernförde and Mecklenburg.
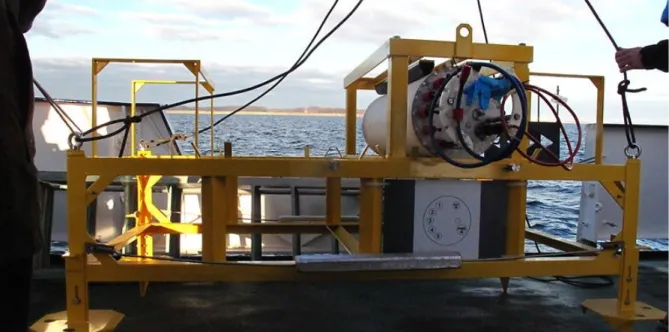
One of the aims of this cruise was to gather more information for the search of the lost observatory from the Coastal Observing System for Northern and Arctic Seas Project (COSYNA), which is partly shown in Figure 1 during its deployment (Baschek et al., 2017). The system was installed in December 2016 and measured temperature, salinity, oxygen, nutrients and chlorophyll concentration close to Boknis Eck in the Bay of Eck- ernförde. The connection to the observatory was lost on the 21st of August 2019 under unknown circumstances. Research divers only found the disrupted power cable and dragging traces on the seafloor close to the initial position of the station (Römer, 2019).
During this cruise we surveyed with a prototype Multibeam Echosounder (MBES), kindly provides by the EU-funded BONUS ECOMAP project. Seeing that the observatory, or its debris, has a higher accoustic backscatter intensity and is elevated from the surrounding sea floor and we applied the Multibeam technology for the search.
Figure 1: Picture of the missing observatory taken from Forschungstaucher (2019) of Kiel University.
A further aim of this cruise was a survey of the seafloor in the Bay of Mecklenburg as a pre-investigation for an upcoming cruise within the EU-funded project ACT-SENSE.
According to the IPCC, geological storage of CO2 is one promising method to achieve the goal of a maximum global warming by 2 °C. To avoid an unexpected aftermath, it is important to understand the impact of underwater gas injections into geological structures beforehand (Berndt, 2005). One field campaign for gaining more knowledge
about the related processes is scheduled for October 2020 (for more information (Berndt
& Karstens, 2019)). It is going to take place in the area of the Bay of Mecklenburg where evidences of buried, presumably pre-glacial beaches exist (Heinrichet al., 2016). The setting of sand below impermeable mud is good for gas injections. The aim of cruise AL527 was mapping of the potential injection areas by using 2D reflection seismics and hydroacoustics. Sediment samples taken by a gravity corer or a grab provide useful information to define the relevant sediment properties in preparation of the injection.
The data of the Innomar Sediment Echosounder (SES) and sediment cores allow to charted the location and depth of the beach. Backscatter and bathymetry data collected by the NORBIT MBES can be used as reference data for potential injections.
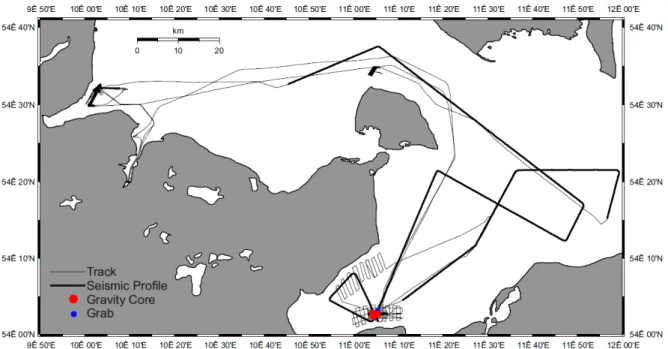
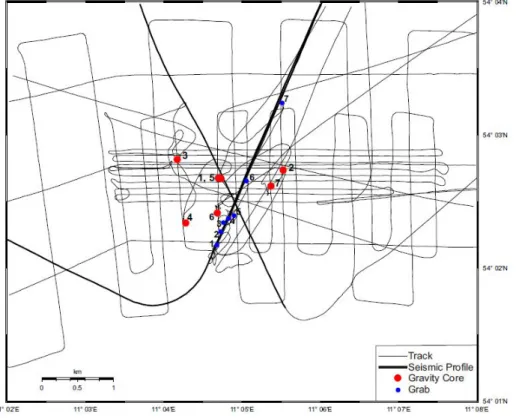
Figure 2: Cruise track of AL527. In the west the searching area for the observatory close to Boknis Eck. In the south the survey area for the measurement in the Bay of Mecklenburg. Red marks show where gravity cores were taken. Grabs are marked with blue points. Thick lines show seismic Profile tracks, and thin lines show the cruise track.
To understand the geological structure of the seafloor in the Bay of Mecklenburg, it is necessary to look at the history of the Baltic Sea. In the Perm (252 Million years ago) the Zechstein Sea was dried out repeatedly. At this time residues of evaporation deposited.
The second to last layer of evaporation is made of halites. Due to its lower density, it rises to the surface. During the Triassic, layers of sandstones, carbonates, sandy maris and mudstones are typical shell limestone accumulations. Jurassic sediments are mostly interbedded sand- and mudstones. Typical sediments in the Creataeous are sandstone and carbonates. In the Cenozoic the most common deposits are mudstones (Hübscher, 2010). The formation of the Baltic Sea started in the middle Miocene after
the last glaciation. The leftover of the ice margin are glacial drifts and moraines. After this holocene, silt and sand had a thickness of about 9 m (Winterhalter, 1992).
4 Narrative of the Cruise
In the morning of the6th of September the scientific group consisting of four senior scientists and eight students boarded the R/V ALKOR. The scientific equipment, that had been boarded earlier, was unpacked, installed and secured. The following cruise track is shown in Figure 2. The cruise itself started shortly past 08:10am from the Geomar pier in Kiel. We reached the Bay of Eckernförde, the first research area, around noon. Upon arrival we started a Multibeam Echosounder (MBES) mattress in order to search for the lost underwater observatory of Geomar in the restricted area Hausgarten.
Using Kiel University NORBIT MBES, we discovered dragging traces and anomalies on the seafloor. In between the survey a Conductivity, Temperature, Depth (CTD) profiler was deployed in order to determine a depth profile of the sound velocity for MBES calibration. We finished the survey in the early evening hours and started a 2D reflection seismic survey using a streamer with 48 channels and an active length of 75 m. The survey was planned to run throughout the night towards the Bay of Lübeck passing by four permanent environmental impact survey points. Due to decreasing pressure at the airgun, the survey was cancelled around 09:00pm, airgun and seismic streamer were recovered. The technical problem could not be solved that evening.
However, it could be identified that the adapter between compressor and supply cable for the air gun was the cause. Therefore, we steamed back to the Bay of Eckernförde to perform another MBES bathymetry survey. The mattress started at 01:30am the following day, the7th of September. It was situated just north of Mittelgrund, intending to fill in gaps of previous surveys regarding pockmarks. After completion of the mattress another CTD was deployed. Since the adapter for the compressor of the air gun could be replaced in the morning hours, we followed up on the earlier 2D seismic survey plan and headed at 02:30pm through the Fehmarn Belt into the Bay of Mecklenburg.
The survey was finalized at 03:30pm on the8th of September. Shortly afterwards we proceeded with a mattress north-east of Lübeck using the ship-board Innomar Sediment Echo Sounder (SES) to investigate the remainders of a pre-glacial beach. The SES survey was finalized the following day, the 9th of September, at 02:00pm and was followed by another MBES mattress in the same area. During the survey three CTDs were deployed and a rolling calibration was applied in order to ensure data quality. We finished this survey by midnight and secured all inventory for the following transit to the Bay of Strande, where we arrived by 07:00am on the10th of September. At the Bay of Strande we did a short MBES mattress in order to investigate a presumed bomb crater.
At 09:30am we arrived in Kiel at the Geomar pier for a partial exchange of the scientific crew and departed at 12:00am again towards the Bay of Eckernförde. At 02:00pm we performed a video camera survey at Hausgarten, the area where parts of the lost underwater observatory are assumed, according to our processing of the previously
taken MBES data. Unfortunately, visibility was weak since only little light reached the seafloor and the installed light system was insufficient. Apart from that, exact navigation was not possible with the positioning system of the R/V ALKOR. Therefore, the survey was ended at 05:30pm. Nevertheless, we had sight on parts of the instrumental tower for a couple of seconds. Within the Bay of Eckernförde we performed another MBES mattress from 05:00pm until 07:00pm, followed by an Innomar mattress on the edge of Mittelgrund in order to investigate pockmarks further. This survey was completed by 10:50pm. Afterwards we set course towards the Bay of Lübeck. The transit lasted through the night and scientific work was resumed at 08:00am the following morning, the11th of September. At 07:00am we started another Innomar SES survey northeast of Lübeck which lasted until 02:00pm and was interrupted twice for gravity cores. Both of the cores were taken close to shore off Brook in order to investigate the possibility of storing CO2within the underlying sands. One of the cores was cut open and prepared for sampling to teach the students the method and process. Afterwards, we took seven grab samples to inspect the material of the upper seafloor. This enables better and more specific interpretation of the MBES backscatter data and verifies the structures supposed by the earlier survey. By 05:00pm we began another seismic survey within the Bay of Mecklenburg in order to gather further information on the Baltic tectonics. Over the course of the evening, the wind speed increased drastically, which made us recover the streamers ahead of schedule by 09:30pm as constant data acquisition was not possible due to the swell. Therefore, we moved towards Grömitz to start another Innomar and MBES mattress at 11:45pm which was finished by 10:00am the next morning of the 12th of September. At that time we reached the next gravity coring position, close to the former coring area northeast of Lübeck. Altogether, we covered 6 locations, taking 5 cores since the corer could not penetrate the seafloor at one of the spots. All the cores were cut and packed appropriately for further examinations by Dr. Christian Berndt’s work group at Geomar. In the afternoon, by 03:00pm we carried out another seismic survey within the Bay of Mecklenburg. Seismic streamer and airgun were recovered at 11:00pm in the Fehmarnbelt. Early morning of the13th of September, at 03:30am we ran another MBES mattress in order to survey a ripple field off Fehmarn that is being closely watched for a few years by now. Due to wind conditions we could not take the survey as planned with profiles in roughly north-south direction but had to change to roughly east-west profiles by 08:30am. At the beginning of the survey, a CTD profile was taken from which we could not read any data for technical problems. Another CTD profile was successfully taken shortly before the survey was ended at 11:30am. Afterwards, we took four more grab samples of the upper seafloor within the area of the just finished MBES survey, slowly heading towards Kiel. In between 01:50pm and 03:50pm different presentations on preliminary results of the cruise were given. Meanwhile, we ran a last MBES survey of the western branch of the ripple field off Fehmarn. Throughout the
day, cleaning and packing of equipment had started and remained the main activity throughout the remaining transit time to Kiel. The cruise found a successful ending at 06:00pm at the Geomar Pier in Kiel. At this time, two more talks by students were given.
5 Participants
Table 1: List of scientific crew.
Name Position Institute
Prof. Dr. Christian Berndt (09/06/2019 - 09/10/2019)
Chief Scientist GEOMAR Prof. Dr. Sebastian Krastel
(09/10/2019 - 09/14/2019)
Chief Scientist University of Kiel Dr. Jens Schneider v. D.
(09/06/2019 - 09/10/2019)
Senior Scientist University of Kiel Kai Frederik Lenz Senior Scientist University of Kiel Dr. Philipp Held
(09/10/2019 - 09/14/2019)
Senior Scientist University of Kiel Per Oscar Nilsson
(09/10/2019 - 09/14/2019)
Master Student University of Stockholm Michael Kühn
(09/06/2019 - 09/10/2019)
Master Student GEOMAR/University of Kiel
Anna Christina Hans Bachelor Student University of Kiel Tatjana Michaela Weiler Bachelor Student University of Kiel Jonas Liebsch Bachelor Student University of Kiel Theresa Prigan Bachelor Student University of Kiel Tilman May Bachelor Student University of Kiel Johanna Klein Bachelor Student University of Kiel Kelvin Rathiens Bachelor Student University of Kiel Pascal Koch Bachelor Student University of Kiel
Table 2: List of crew from Reederei Briese.
Name Position
Helge Volland Master
Christian Gräber 1st Officer Sebastian Neugebauer 2nd Officer Hans Jörg Freund Chief Engineer Matthias Jensen Electrician Hardy Schwieger Boatswain
Ken Schnieders A.B.
Benjamin Brüdigam A.B.
Lucien Delachaux Dit-Gay A.B
Willi Rieger A.B.
Thomas Kirschnick Cook
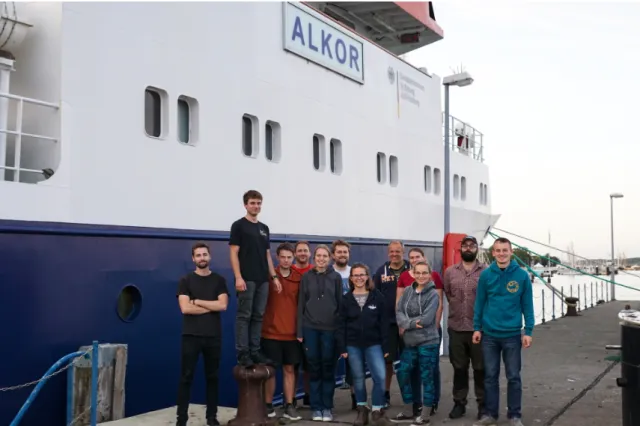
Figure 3: Group picture of the scientific crew of AL527.
6 Methodology
6.1 2D reflection seismic
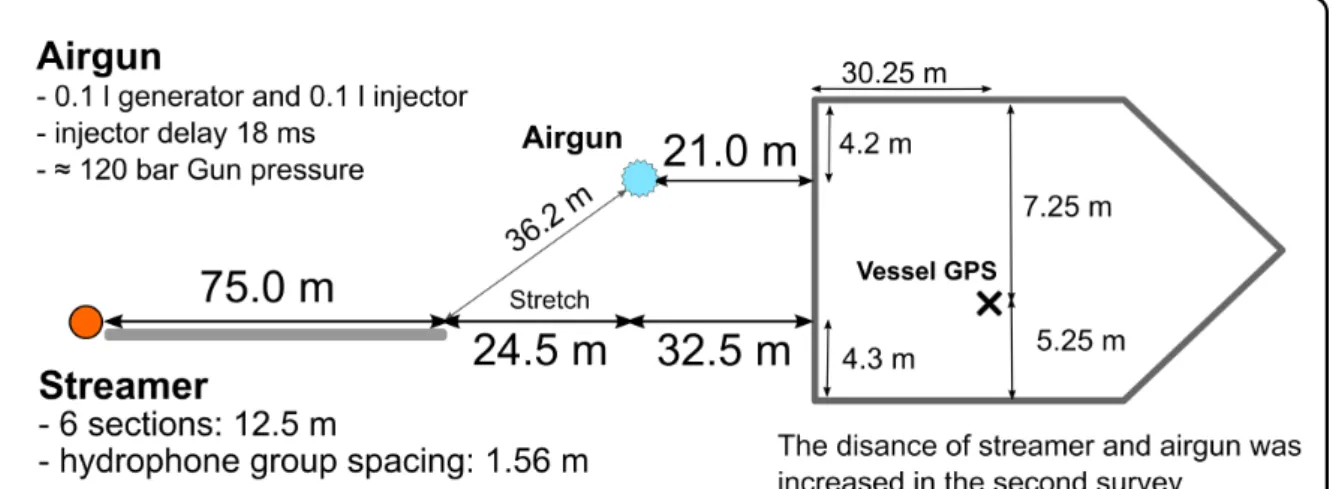
A Sercel Mini GI-Gun was used as seismic source during the seismic surveys. The chamber volume of the Mini GI-Gun was reduced by Micro Shuttles to 0.1 l for the generator and 0.1 l for the injector. Most of the time the airgun was operated with 120 bar gun pressure and an injector delay of 18 ms. The shooting interval varied between 7 s and 10 s with a vessel speed around 4.5 kn. That leads to a shooting-point distance of 2 m to 2.8 m. We estimated a signal delay of 21 ms. The Streamer used in the surveys contained 6 sections with 8 channels per section and a group spacing of 1.56 m and a total streamer length of 75 m. We used a 24.5 m stretch in front of the streamer.
Exact information about the geometry is visualised in Figure 4. We did not use birds for the streamer as it was comparably short, but we fixed floats to the Analog-to-digital (AD) converter instead. For that reason, we were limited in controlling the depth of the streamer. Each streamer section had an analog digital converter. The communication between the AD-converter modules and the recording system was transmitted via TCP/IP protocol. A repeater was located between the deck cable and the tow cable.
The power supply as well as the communication with the AD-converter was managed by the power supply unit.
Figure 4: Deck geometries, streamer configuration and gun setting for the 2D reflection seismic surveys.
The reflected seismic signal was sampled with 500µs and an overall length of 3 s for every shot. The seismic data was recorded as multiplexed SEG-D where seperate files were generated for every shot. The acquisition computer allowed a live quality control.
We used the GPS system of the R/V Alkor to log time as well as position and speed of the vessel. Unfortunately, there were some interruptions of the GPS system within line 202 which should be considered when using this data.
6.2 NORBIT Multibeam
Upon arrival on the vessel, we installed a NORBIT STX prototype Wideband Multibeam System (MBES) in the moonpool. The STX prototypes integrates an Applanix Wavemas- ter motion and inertial navigation system (IMU), which corresponds to a sound velocity probe next to the sonar head. A dual GPS antenna was installed at the rail of ALKOR’s top deck and connected to the IMU. Installation offsets on ALKOR were taken from previous installation (Table 3). We supplied RTK corrections (15-AXIO-NET) via the on-board internet to support the dual antenna GPS recordings.
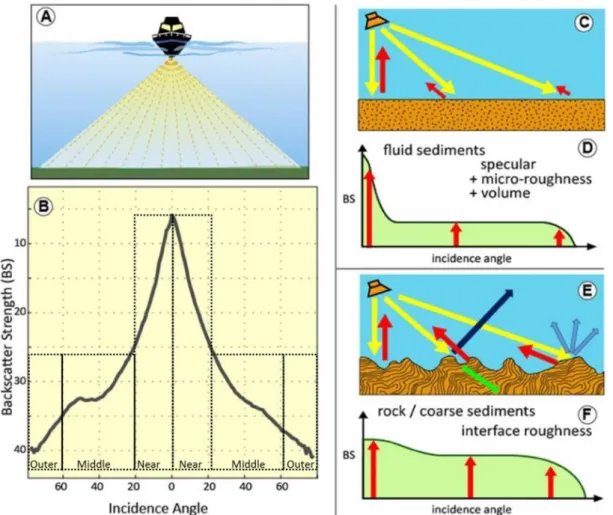
The NORBIT MBES produces a chirp signal with a 500µs lasting pulse resulting in 80 kHz bandwidth. 512 beams are formed with a beam resolution of 0.9° across-track and 0.9° resolution along-track at 400 kHz. Range resolution can achieve accuracy of up to 1 centimeter in shallow water. We sailed our surveys with 140° to 150°. The opening angle was variable depending on the bathymetry characteristics. Attitude data (.000 format) was collected with 200 Hz to allow for later post-processing of the IMU data. QINSy 8.18.3 and the NORBIT GUI recorded .db and .s7k data in parallel for bathymetry, backscatter, and snippet backscatter. MBSystem and QPS Qimera were applied for post-processing. The strength of backscatter values is influenced by a number of characteristics: the strongest impact to intensity comes from the distance of the reflecting surface to the MBES radiator, and the angle in which the beams impinge the seafloor (Figure 5B). During processing both of those effects are mostly removed from the backscatter grid, leaving behind mostly backscatter effects of the surface which result from differences in sediment grain-size, micro-topography, biology and moisture of the topmost layer (Figure 5C-F). For assessing vertical profiles of sound velocity we used a multisensor Conductivity, Temperature, Depth (CTD) profiler 75M manufactured by Sea & Sun Technology. It is a self-sustaining probe, which is powered by batteries and can operate up to a depth of 1000 m. Three of the eight channels were equipped with a pressure, conductivity, and temperature sensor. Furthermore, the time mode was used to record UTC stamps with a sampling rate of 0.1 s. From the data, we derived the salinity, sound velocity, density, and acoustic absorption values.
Table 3: Installation lever arm offsets between the POSMV Wavemaster primary antenna mounting point and the sonar head flange.
Applanix coordinates Offset [m] to primary antenna on the top deck
X 3.92
Y 3.82
Z -15.73
After approximately one hour of sailing the IMU completed its self-calibration. The IMU also achieved fix RTK GPS leading to accuracies up to 5 cm for position and height
Figure 5: Influences to backscatter signal strength taken from Lurton & Lamarche (2015) Table 4: Parameter Setup before and after the calibration (reference to COG was not
provided).
Parameter Initial GAMS value Final GAMS value
Baseline Vector X 0 0.085
Baseline Vector Y 2 1.998
Baseline Vector Z 0 -0.001
most of the survey time. The roll calibration was conducted during a mattress survey in the Bay of Mecklenburg close to the coast of Brook. Bottom detection was reliable within the 140° sector, deteriorated with noise at 150°. Simultaneous recording of bathymetry, sidescan, snippet sidescan and water column was feasible at slow survey speed. Bathymetric data were recorded at survey speed between 3 kn to 5 kn and ping rates between 5 Hz to 10 Hz. Heave might be improved by post-proccessing (true heave) or RTK heave application.
6.3 INNOMAR Sediment echosounder
We used a parametric subbottom profiler of type Innomar SES-2000® medium which is hull-mounted on the R/V ALKOR. It transmits two high frequencies at high sound pressure. These two sound waves interact in the water column, generating harmonics.
The SES-2000® medium sends and records primary frequencies of about 100 kHz and thus generates parametric secondary frequencies within the range of 4 kHz to 15 kHz.
Secondary frequencies develop through nonlinear acoustic interaction of the primary waves at high signal amplitudes. The advantage of these secondary frequencies is the fact that they have a similar beam width and short pulse lengths as the primary frequencies despite the low frequency and the small transducer. The system allows a simultaneous acquisition of up to three different frequencies (multi-frequency mode), which are shot sequentially. Every shot is recorded by two channels, comprising a primary high frequency (HF) and secondary low frequency (LF) as full waveform and envelope. The secondary frequencies are adjustable and were set to 4 kHz with two pulses and to 15 kHz with one pulse during all surveys. The system has a vertical resolution of 6 cm and its accuracy depends on the frequency and water depth, e.g.
100/10 kHz: 2/4 cm + 0.02 % of the water depth. The soundings are corrected for heave, roll and pitch movements of the vessel. The system worked reliable and produced high-quality data throughout the whole time. After recording, the full waveform data was converted into the segy-format with SES-convert (version 2.3.0.2). If seismic data was collected simultaneously, one SEG-Y file was created for the length of each seismic profile. We imported the converted segy-files into IHS Kingdom seismic interpretation software and calculated the envelope subsequently.
6.4 EK60 fishery echosounder
The ship-board fishery echosounder KONGSBERG EK60 was operated with a frequency of 120 kHz for detection of gas bubbles. The data were not processed during the cruise and just recorded for a potential further use.
6.5 Gravity core and grabber sediment sampling
A gravity corer was used for taking sediment samples. It uses a 800 kg weight to press a 5 m long metal pipe into the ground. In order to collect and secure the core afterwards, a plastic pipe was installed within the metal pipe. Further, we used a core catcher at the end of the pipe to prevent sediments from falling out of the pipe. With this setup we were able to collect cores with up to 4 m length. Once the samples were taken, the plastic pipe was cut in 1 m pieces for closer investigations and archiving.A simple grab was used to get samples of the surface of the seafloor. The findings were documented
by pictures and small quantities were secured. The individual positions for gravity coring and grabbing are shown in Figure 6.
The SES data was used to choose interesting grab points considering topographical characteristics. The limited maneuverability of the vessel and the influence of water current makes it impossible to determine a grabbing point down to single meters. This influenced the choice-making of the grab points, some were intentionally chosen to be in areas of constant backscatter, while some were chosen in areas of the backscatter changing in small dimensions, to get a chance to collect information about some darker spots. These could show larger rocks, or biological features on the seafloor.
Figure 6: Positions of graps and gravity cores taken in the Bay of Mecklenburg.
Figure 7: Deployment of a gravity corer (left) and example of a grab (right).
6.6 Video Camera
We conducted underwater filming in order to search for the missing observatory. For that purpose, we used a Mariscope-UW-Video-camera. The camera was lowered on the side of the vessel until the seafloor got into view. The depth of the camera was adjusted permanently as the ship moved. Unfortunately, the weak lights of the camera made it impossible to film in regions deeper than approx. 20 m. Further, the size of the image was small compared to the research area. Thus, it was hard to cover the area systematically for limited moving options and the low visual range. The camera was supplied by a power supply unit. The data was observed and recorded live on a connected computer.
7 Preliminary Results
7.1 Identification of sediment and biological characteristics
To get a better understanding of the composition of sediments and biological features at the seafloor of the Bay of Mecklenburg the same track has been surveyed twice, first using the Multibeam Echosounder (MBES), and then using the INNOMAR Sedi- ment Echo Sounder (SES). Darker areas in the resulting backscatter grid show areas of stronger backscatter, and brighter values show areas of weaker backscatter (Figure 8).
Figure 8: Complete backscatter data survey including chosen grab points, 1 in SW, 7 in NE ends of survey.
The first grab point was chosen in an area of evenly colored backscatter in with a dark gray tint. The SES data shows that this point is located on an underwater hill, with an elevation of around 2 m above the valley in the north east (Figure 9, grab_01). From prior exploration of the area it is clear that this hill is a sunken beach. The sediments that were expected to be found were mostly moist sand, without larger rocks or vegetation. The sediments that were excavated showed the expected characteristics: smooth, sandy silt, with weak to no odor, and small sea shells, without larger rocks.
The second grab point was chosen to be in an area of backscatter with equal overall intensity, but containing smaller, rock-sized areas of higher backscatter values. Hence, the expected sediments were similar to the ones excavated from the first grab. But,
Figure 9: Complete SES data survey including chosen grab points.
considering the low precision of the ship and grabber placement, it could either hit a brighter or darker spot, the former being very similar to grab 1, and the latter containing larger rocks, or underwater plants. This was the case, the sample was largely similar to grab 1, but it contained less sea shells, and more, larger rocks with diameters up to 2 cm.
The third grab was the first one that was collected on the slope down from the beach leading to the valley (Figure 9, Grab_03), and lies in an area characterized by even darker patches of backscatter. Continuing the trend, it was expected to contain even larger rocks. And indeed the excavation results contained a large rock with a diameter of 15 cm, within mostly sandy, silty and badly sorted mud. It also contained smaller flint stones and rocks with sharper edges, these have likely rolled down from the beach in more recent times. There were only a handful of small sea shell pieces scattered within the sediment.
Grab 4 was chosen to be in another area of strong, dotted backscatter on a slowly brightening background. It is located on the steepest point of the hillside (??) and was believed to contain more sediments that fell down, and similarly sized rocks as the ones that have been found in grab 3. The examined sediment sample had a faint smell, and didn’t contain large rocks, sea shells and was made mostly out of a mix of very small rocks, mud and sand. These findings lead to the conclusion that the grab was probably executed in a spot with brighter backscatter, and not at one of the darker spots.
The fifth grab sample was collected at the foot of the slope (Figure 9, Grab_05), in an area of evenly colored, light gray backscatter. The sediments found in the valley were
expected to be quite similar, with the amount of rocks and sea shells decreasing with increasing distance to the beach.
The findings were matching the expectations well, grab 5 contained small rocks (diameter of 2-3 cm), and small pieces of sea shells, and had a strong odor. Grab 6 contained very fine, silty sediment, and very small rocks (diameter of 1-5 mm). No sea shells were found in this sample, which corresponds to the long distance of about 500m between the location of the beach and grab 6.
The last grab point, grab 7, was collected at the end of the survey, at a distance of about 1.5 km from the beach, on a slow upwards slope (Figure 9, Grab_07), and at one of the brightest areas of backscatter along the survey track. As was the case with grabs 5 and 6, this sample also had a strong odor, and was very well sorted, with no rocks, sea shells or sand among the silty clay this sample was made of.
In conclusion the preliminary results of the survey show that judging from a combination of MBES backscatter and SES data the composition of sediments and biological traces at the seafloor can be predicted very well. Sediment samples collected via excavating with a grabber were largely consistent with the expectations.
7.2 Fate of the seafloor observatory at Boknis Eck
The COSYNA node system at Boknis Eck consisted of a shore-side container with power supply and server, as well as a shore connection cable, a sea-side node, data cable and two measuring stations. The first station was known as the Underwater Observatory and the second one as the Coastsens Tower (Helmholtz-Zentrum, n.d.). On 21st of August, 2019 the node (dimensions LxWxH: 2.4 x 1.4 x 1.2 m) and the observatory (dimensions LxWxH: 1.2 x 1.2 x 1.2 m) went missing.
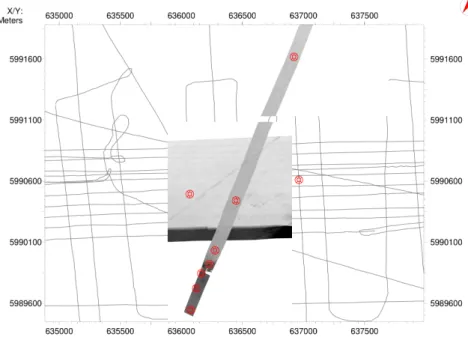
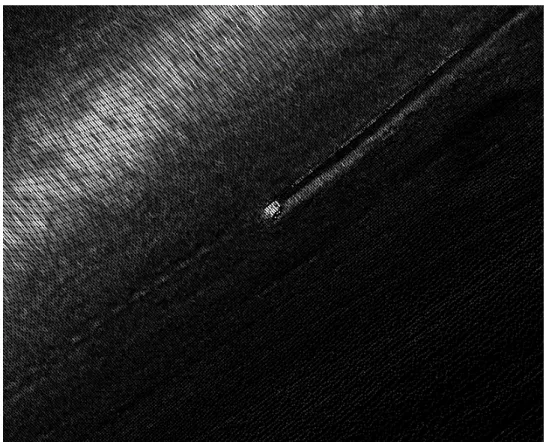
A 3D bathymetry map generated by Qimera was used then to determine coordinates of conspicuous points in the area close to Boknis Eck. At these positions underwater filming was done later on. The evaluation of the backscatter profiles showed that the tower and the weights are still in the correct position. This could be confirmed with the underwater video camera. Two conspicuous points in the vicinity (70 m away) of the tower turned out to be railway wheels. Two further conspicuous points could not be identified by the camera. A particularly conspicuous drag mark with a length of 400 m, a width of 2 m and a depth of on average 20 cm passed the tower at a distance of about 200 m. At the end of the grinding track, an atypical elevation was visible, which could be very well represented by backscatter intensity. Since this elevation is a rectangular object of approx. 1.4 m x 1.2 m in size, it was obvious to assume that it was one of the missing devices. See also Figure 10. In summary it can be said that it was not possible to detect the missing devices. However, the surrounding area could be mapped. Coordinates of suspicious positions are passed forward to Geomar for further
investigations.
Figure 10: Object at the end of the conspicuous grinding track as derived by backscatter data by NORBIT MBES.
7.3 Spatial expansion and geological structure of a former beach in the Bay of Lübeck
The data were obtained with Innomar using a frequency of 8 kHz close to the Bay of Lübeck, processed and interpreted with IHS Kingdom Suite. In the Bay of Lübeck a former beach was expected, which was covered by sediments because of a rise in sea level when the present Baltic Sea was formed.
Since the focus of this exploration was the former beach, it will mainly be focused on the grid of the top of the sand, which is presented in Figure 11. Beginning with the dimensions, it has to be said that there are large gas accumulations (approx. 4 %) in the northern part of the survey. These accumulations make it impossible to get any valid data from this area. Therefore, the beach could possibly continue further north than presented in the data. In order to make a clear statement about that, different methods than the SES are necessary. In the south of the survey, a slope appears on the seafloor. This slope pretty much marks the southern boundary of the former beach, where the top part of the beach is just 19 m below the sea surface. The bottom of the
Figure 11: Top of the former beach in the Bay of Lübeck as conduted from SES data visualized with Kingdom Suite.
sand occurrences is harder to recognize, since the signal strength is getting significantly weaker proportional to the depth. The most distinct features in the collected data are two sandbanks, which are located in the very middle of the survey. Both of them are orientated in east-west direction, and thus along the general beach trend, and can be found between 23 m to 26 m below the sea surface. One of the sandbanks (point 2 in Figure 11) is located close to the southern boundary of the beach. Since we only collected 2D data, the algorithm did not calculate a continuous line for the sandbank.
Nevertheless, the presence of a sandbank is supported by the signals to its right and left, even though the signals are weaker than the ones of the other sandbank. The second sandbank starts pretty much in the north of the first one. This leads to the assumption that both sandbanks could have the same origin. But, either way, starting from that region, the sandbank extends towards the north-west. At point 1, the sandbank seems to be disrupted as a line is going exactly through it. However, considering the other lines, it is more likely that the structure bends towards the north, forming some kind of arc around point 1. Further west, there is a small basin (point 3), which can be seen in the vertical and horizontal lines. Right next to it, there is another small interruption (point 4). The appearance of this interruption is not as smooth and natural as the one of the basins in point 3, since it originated from seafloor subsidence due to gas leakage.
In general, it was very hard to gather any meaningful information about the bottom of the sand structures, since they were not easy to pick and partly not visible due to the presence of gas especially in the northern part. Nevertheless, the grid shows a general trend from south to north with the southern part being closer to the surface. In the very north, the bottom of the sand structures reaches a depth of 33 m. Considering the lines, it can be assumed that they even reach further down. On the basis of SES data alone, no indication can be given about this thesis due to the increased gas content in the northern area. Apart from analysing the layers individually, I calculated the thickness of the beach by subtracting the grids for the top and the bottom of the sand structures. In the resulting grid, it can be seen that the thickness is at its maximum with about 9 m at the position where the sandbanks are supposed to be. Other than that, there is a general trend with increasing thickness of the beach from south to north. In the eastern part of the considered area, the sand accumulation is very thin (<1 m). This can be a true effect but it also might just be the result of insufficient data in the lower parts of the ground, where the bottom of the beach was quite hard to find.
7.4 Acoustic characterisation of gas
Gas fields beneath the seafloor emerge when biological material dies off. Methanogens, microorganisms which are common in anaerobic surroundings, are responsible for this gas formation as they produce methane out of carbon dioxide (Balchet al., 1979). If the formed gas is covered by a sufficient thick layer of silt, the gas will not be able to escape but remains as a silt layer enriched with gas. Such gas fields can be observed in the Bay of Mecklenburg.
To study the acoustic characterisation of gas, hydroacoustic surveys at different frequen- cies along the same profile line were compared. In this case, data from the Innomar Sediment Echosounder (SES) at 4 kHz, 5 kHz, 6 kHz, 8 kHz, 10 kHz, 12 kHz and 15 kHz as well as seismic data at a frequency of about 300 Hz were analyzed. The considered profile line is situated in the Bay of Lübeck close to the coast of Brook and has an east- west orientation. The boundary points are located at 54°02’17.37” N, 11°04’46.51” E and at 54°03’01.26” N, 11°05’17.45” E and thus cover a distance of 1.5 km. According to the 4 kHz SES profile presented in Figure 12, the observed seafloor is characterized by a more highly situated area in the west. The water depth in the remaining profile is about 5 m lower. At an offset of 1400 m, a vertical disturbance is visible as a vertical blank. At the eastern edge of the profile, a gas layer is visible at 2 m depth. In general, an emitted acoustic signal is scattered by the gas layer, so that the backscattering of gas is more diffuse compared to the backscattering of the layered silt. Further, the acoustic energy is completely absorbed by the gas layer, so that the acoustic signal
Figure 12: West-east orientated Innomar SES profile at 4 kHz close to the coast of Brook, extending from 54°02’17.37” N, 11°04’46.51” E to 54°03’01.26” N, 11°05’17.45” E.
cannot reach further down. According to these two effects, gas can be identified in SES data by acoustic turbidity and acoustic blanking (Sunjay, 2011).
The usage of different frequencies for the SES leads predominantely to different vertical resolution, in this case to 10 cm for the 15 kHz and to 40 cm for the 4 kHz survey.Thus, the layers of the seafloor are represented more detailed the higher the resolution is, as can be seen in Figure 13. However, considering the representation of the mentioned vertical disturbance as well as the transition zone to the gas enriched layer, this relation does not apply. Instead, the seafloor is represented best in the 10 kHz survey as blank- ing is minimized at that frequency (Figure 13).
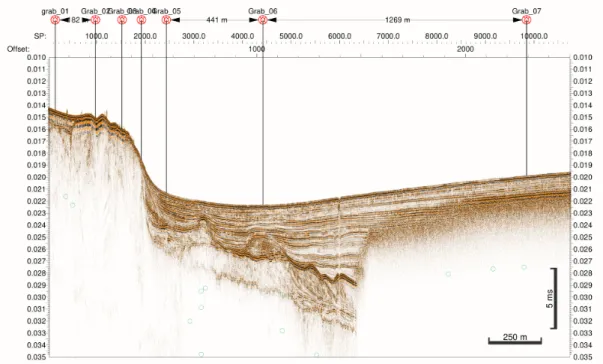
The gas layer is also visible in the seismic survey presented in Figure 14. It is visible because of a phase inversion of the reflectors at the eastern end of the survey. This phase inversion arises as the acoustic impedance decreases from water to gas while it increases from water to soil. Further, gas is a stronger reflector than soil which explains the greater number of clearly visible multiples at the eastern side of the survey. The transition area is still characterised by a phase inversion. Nevertheless, the multiples are not as distinct as in gas layer, which can be explained by the difference in total gas content.
Figure 13: West-east orientated Innomar SES profile at different frequencies cut off between 26 ms and 32 ms.
Figure 14: West-east orientated seismic profile.
7.5 Tectonic structures in the Bay of Mecklenburg
The profiles P202 (Figure 15) and P205 (Figure 16) both show some interesting geo- logical structures. Profile P202 starts in the west of the Fehmarn Belt and ends in the east. The seafloor is located at 0.033 s TWT, the first and second multiple are located at 0.066 s TWT and 0.099 s TWT. The profile P205 starts east of the Fehmarn Sund and is running towards Travemünde. As the seafloor in P205 is located at 0.025 s TWT, the first and second multiple of the seafloor are located at 0.05 s TWT and 0.075 s TWT.
In Figure 15 an anticline and syncline structure is clearly visible over the whole profile.
There are also some zones of seismic blanking marked in Figure 15 between 13 km and 20 km. Seismic blanking is an indicator for the occurrence of gases in the ground. At the beginning of profile P205 the seafloor reflection shows a reversed seismic polarity which indicates high gas content in the pore space. There is also an anticline visible in Figure 16 at about 34 km offset and it’s first visible at about 0.15 s TWT.
The 2D seismic data in the Bay of Mecklenburg is characterized by a lot of the recognized anticline and syncline structures. It can be explained by halotectonics. There must have been a time when the salt, which deposited probably in the Zechstein, moved upwards due to its lower density. So the overlaying deposited sediments started to be bent upwards by rising saltpillows.
Figure 15: Seismic Profile P202 crossing the Fehmarn Belt from west to east.
Figure 16: Seismic Profile P205 starting near the Fehmarn Sund und running in south- west direction.
8 References
Balch, W. E., Magrum, L. J., Fox, G. E., & Woese, C. R. 1979. Methanogens: A Re-evaluation of a unique biological group. Microbiological reviews,43(2), 260–296.
Baschek, B., Schroeder, F., & Brix, H. 2017. The Coastal Observing System for Northern and Artic Seas. Ocean science.
Berndt, C. 2005. Focused fluid flow in passive continental margins. Philosophical transactions of the royal society a: Mathematical, physical and engineering sciences, 2855–2871.
Berndt, C., & Karstens, J. 2019. Cruise Proposal for the project ACT-SENSE: Boden- messungsbasierte Überwachung der Integrität von CO2-Speicherstätten.
Forschungstaucher, Uni Kiel/DPA. 2019. https://www.spiegel.de/wissenschaft/natur/bild- 1285237-1465827.html (last access: 16.09.2019).
Heinrich, C., Schwarzer, K., & Feldens, P. 2016. Submerged beach ridges in Mecklen- burg Bay (SW Baltic Sea) indicate Late-Pleistocene and Holocene shore lines. In:
35th International Geological Congress, Cape Town, South Africa.
Helmholtz-Zentrum, Geesthacht. COSYNA Unterwasserknoten-System, https://www.hzg.de/institutes_platforms/cosyna/observations/underwater_node/in- dex.php.de (last access: 16.09.2019).
Hübscher, C. 2010. Structure and evolution of the Northeastern German Basin and its transition onto the Baltic Shield. Marine and petroleum geology.
Karstens, J. 2018. Cruise Report R/V ALKOR 512: North Sea Blowouts, Cuxhaven - Kiel (Germany) 15.07. - 26.07.2018. GEOMAR report.
Lurton, X., & Lamarche, Geoffroy. 2015. Backscatter measurements by seafloor- mapping sonars.
Römer, J. 2019. 800 Kilo Messstation von Meeresgrund verschwunden (04.09.2019).
Spiegel online.
Sunjay, S. 2011. Geophysical prospecting of gas hydrate. Pages 79–83 of: Technical and geoinformational systems in mining. CRC Press.
Winterhalter, B. 1992. Late-Quaternary stratigraphy of Baltic Sea basins - a review.
Bulletin of the Geological Society of Finland,64(2), 189–194.
9 Acknowledgements
We would like to thank Captain Helge Volland and the entire crew of R/V ALKOR for their excellent support and hospitality during the entire cruise. Speaking for all students, we thoroughly enjoyed this cruise, learning about marine geophysical methods and processes and generally feeling very well instructed. We would like to thank all of the scientific and the on-board crew for making this cruise a great experience for all of us.
UTCxx° xx.xxx‘xx° xx.xxx‘ 17:4054° 31.531 010° 02.401291 2823,528Micro GI73 21,0100020,01206 sections in water. Survey al527-3. first file number is 1000. ch 33 dead. Sampling frequency 0.5ms 17:5454° 32.199010° 03.11786973,826Micro GI7325,0113020,0SOL P101 18:0054° 32.168010° 03.78891974,426Micro GI7326,0118320,080 18:2054° 32.123010° 06.02092944,122Micro GI10328,0133620,045changed shot interval to 10s due to low pressure 18:2854°32.116010° 06.99890944,222Micro GI10328,0138020,0checking on dropping pressure, no info within shot window. Shots 1377- 1436:empty shots 18:3654° 32. 111010° 08.140931152,222Micro GI0028,0143620,0turning trigger off, taking gun in 18:5854° 32.089010° 09.419951261,822Micro GI0020,0finished taking streamer and shotgun in 12:5754° 32.360010° 43.98072694,622Micro GI10319,0200020,01206 sections in water. Survey al527-4. first file number is 2000. Sampling frequency 0.5ms 13:0054° 32.481010° 44.55570674,622Micro GI7320,0201520,0120 13:06Micro GI732068Sol 201 13:07Micro GI732074only generator for testing Micro GI732087only injector for testing Micro GI7321130,0injector and generator 0 ms delay Micro GI73214120,0testing delays Micro GI73215018,0testing delays Micro GI73215916,0testing delays 13:18Micro GI73216418,0testing delays 13:2254° 33.126010° 47.35867634,523Micro GI7327,0221018,0120 13:4554° 33.780010° 49.99467614,421Micro GI7329,0240118,0122 14:0554° 34.402010° 52.57067614,516Micro GI7329,0257718,0120 14:2554° 34.963010° 54.79069654,616Micro GI7330,0274318,0120 14:4554° 35.598010° 57.35867714,721Micro GI7330,0292218,0122 15:0554° 36.130010° 59.69968724,536Micro GI7330,0309018,0123 15:2554° 36.661011° 01.81867754,822Micro GI7330,0325018,0122 15:4554° 37.394011° 04.82868774,824Micro GI7331,0344018,0122 15:4954° 37.508011° 05.28871854,624Micro GI7331,0346918,0122EOL 201 SOL 202 16:0554° 37.003011° 06.9491301314,626Micro GI7331,0360518,0123 16:2554° 36.079011° 09.0491261284,528Micro GI7331,0377818,0123 16:38Micro GI73368918,0GPS Aussetzer 16:4554° 35.230011° 10.9501291294,628Micro GI7331,0393718,0123 Injector Delay
[ms]
Gun-Pressure [bar]
RemarksSource
Shot interv. [s]
Rec. length [s]
Leakage
FFN
Speed O.G.
[kn]
Depth [m]
TimeLatitudeLongitude
Course [°]
Heading [°]
Friday, 06.09.2019 Seismic Survey S100 Saturday, 07.09.2019 Seismic Survey S200