Article
Phytoplankton Blooms, Red Tides and Mucilaginous Aggregates in the Urban Thessaloniki Bay,
Eastern Mediterranean
Savvas Genitsaris1,2 , Natassa Stefanidou1, Ulrich Sommer3and Maria Moustaka-Gouni1,*
1 Department of Botany, School of Biology, Aristotle University of Thessaloniki, 54124 Thessaloniki, Greece
2 School of Economics, Business Administration and Legal Studies, International Hellenic University, 57001 Thermi, Greece
3 Geomar Helmholtz Centre for Ocean Research Kiel, 24105 Kiel, Germany
* Correspondence: mmustaka@bio.auth.gr; Tel.:+30-2310-998325
Received: 5 July 2019; Accepted: 12 August 2019; Published: 14 August 2019 Abstract: We investigated the plankton community composition and abundance in the urban marine environment of Thessaloniki Bay. We collected water samples weekly from March 2017 to February 2018 at the coastal front of Thessaloniki city center and monthly samples from three other inshore sites along the urban front of the bay. During the study period, conspicuous and successive phytoplankton blooms, dominated by known mucilage-producing diatoms alternated with red tide events formed by the dinoflagellatesNoctiluca scintillansandSpatulodinium pseudonoctiluca, and an extensive mucilage aggregate phenomenon, which appeared in late June 2017. At least 11 known harmful algae were identified throughout the study, with the increase in the abundance of the known harmful dinoflagellateDinophysiscf.acuminataoccurring in October and November 2017. Finally, a red tide caused by the photosynthetic ciliateMesodinium rubrumon December 2017 was conspicuous throughout the sampling sites. The above-mentioned harmful blooms and red tides were linked to high nutrient concentrations and eutrophication. This paper provides an overview of eutrophication impacts on the response of the unicellular eukaryotic plankton organisms and their impact on water quality and ecosystem services.
Keywords: nutrients; HABs; mucilaginous aggregates; Noctiluca scintillans; Dinophysis;
Mesodinium rubrum
1. Introduction
On a global scale, the rate of coastal urbanization will increase rapidly in the next decades, and in combination with climate change is projected to result in an increased risk of coastal eutrophication [1,2].
Sewage inputs from coastal cities that are transported directly to coastal waters can act synergistically with land-based sources and river run-offcausing high levels of nutrients [3,4]. Consequently, the global Indicator for Coastal Eutrophication Potential (ICEP) analyses indicate that the potential for coastal eutrophication continuously grows worldwide [2]. Worldwide eutrophication has led to phytoplankton abundance and biomass increase [5–7], while more coastal harmful algal blooms (HABs), with more toxic species, have been linked with eutrophication phenomena [8,9]. Numerous examples of linkages between nutrient loading and coastal phytoplankton blooms and mucilagine aggregate phenomena [10,11] include the involvement of harmful species, i.e., the diatomPseudonitzschiaspp. in the Gulf of Mexico [12], the dinoflagellatesProrocentrumsp., andKarenia mikimotoialong the coast of China [13], and the red tide-forming heterotrophic dinoflagellateNoctiluca scintillans[14–16].
Diversity2019,11, 136; doi:10.3390/d11080136 www.mdpi.com/journal/diversity
A large volume of domestic and industrial wastes from the city of Thessaloniki has been directed for decades to the Thermaikos Gulf and especially its inner part, Thessaloniki Bay. In the 20thcentury, these wastes were discharged in the Bay without treatment, causing the eutrophication of the system.
Since 2001, wastewater treatment has been implemented, decreasing the effects of anthropogenic eutrophication [17]. Although it is generally accepted in the public that the water quality in the Thermaikos Gulf has been improved compared to 20–30 years ago [18,19], the urban front of the Thessaloniki Bay, with restricted water circulation and shallowness, still exhibits apparent red tides and algal blooms. These events are usually the cause of irritation to the public, often mentioned in the Greek media, with subsequent socio-economic consequences to the city of Thessaloniki, especially the touristic center. Despite the growing concerns of the citizens and authorities on the water quality of the Bay and particularly of the urban front, only scarce and isolated studies have been published on the abundance and dynamics of plankton community (both phyto- and protozooplankton) in the urban part of the Gulf [20,21]. On the other hand, several studies in the broader Thermaikos Gulf have focused on phytoplankton [18,22,23] and the occurrence of HABs [24,25]. However, comprehensive studies on red tides and mucilage aggregate phenomena are lacking for the Thermaikos Gulf.
According to the related legislation for the ecological water quality based on nutrient pressures and the phytoplankton quality element (Water Framework Directive; WFD, 2000/60/EC) there is a need for systematic and frequent monitoring of coastal waters. Furthermore, similar to the WFD objectives are those of Marine Strategy Framework Directive (MSFD, 2008/56/EC) for achieving good environmental status of EU marine waters by 2020. The MSFD eutrophication quality descriptor (D5) refers to the adverse effects of eutrophication including harmful algae blooms [26].
The aim of this paper was to examine the shift in the protagonists of the conspicuous and successive algal blooms, red tides and mucilage aggregations in the urban marine environment of the Thessaloniki Bay, by investigating the temporal and spatial changes of the unicellular eukaryotic plankton community attributes (species diversity, dominance, and abundance). This is the first study concerning the phyto- and protozoo-plankton species succession at an annual time scale with weekly samplings, with conspicuous phytoplankton blooms, red tides and a mucilage aggregate phenomenon, in the urban coastal front of the Thessaloniki Bay (Thermaikos Gulf). The present work focuses on the zone linking the terrestrial and the coastal environments heavily affected by, and influencing various human activities, such as the harbor, tourism, industry, mussel cultures, and sewage effluents.
2. Materials and Methods
2.1. Sampling Sites and Sample Collection
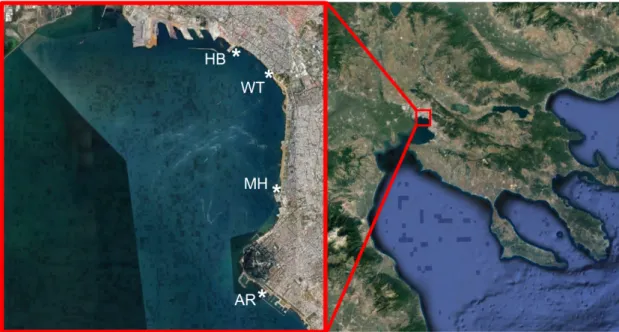
Samples were collected weekly from March 2017 to February 2018, from a coastal inshore sampling site in the White Tower (WT) in the center of the city of Thessaloniki (Table1; Figure1). During the same period, every month, additional samples were collected from three other inshore sites along the urban front of the Bay, namely at Aretsou Beach (AR), Music Hall coast (MH), and harbor (HB) (Table1; Figure1). In total, 47 samples were collected from WT and 12 from each other site (Table1).
All sampling sites had a maximal depth of 4 m.
Table 1.Sampling sites and total number of samples collected.
Sampling Sites Latitude Longitude Number of Samples
White Tower (WT) 40◦37034 N 22◦56051 E 47
Aretsou Beach (AR) 40◦34029 N 22◦56038 E 12
Music Hall coast (MH) 40◦35057 N 22◦56053 E 12
Harbor (HB) 40◦37055 N 22◦56009 E 12
Figure 1. Study area in Thermaikos Bay, indicating the location of the four sampling sites (*). WT:
White Tower, AR: Aretsou, MH: Music Hall, HB: Harbor.
During all samplings, in situ measurements of water temperature and conductivity were made with the use of the YSI Pro 1030 instrument (YSI Inc., Yellow Springs, OH, USA). Conductivity was transformed to salinity based on the equation in Weyl [27]. Water samples of 2 L were collected from the surface layer of 1 m, and separated as follows: (i) a subsample of 0.5 L was used for immediate microscopic observation of the living microbial eukaryotic community; (ii) a subsample of 0.5 L was preserved in Lugol’s solution and kept in the dark in room temperature for microscopic analysis within the next few days; (iii) subsamples of 100–250 mL (depending on plankton and particulate matter density) were immediately filtered onto 0.7 μm pre-washed (in 5–10% HCl) and pre- combusted (6 h, 550 °C) Whatman GF/F filters, and the filters were stored in −20 °C until future particulate organic phosphorus and chlorophyll a (Chl a) measurements; (iv) a subsample of 50 mL was filtered through 0.2 μm cellulose acetate filters (Sartorius) and the filtered water aliquots were kept in −20 °C until future dissolved inorganic nutrient measurements.
2.2. Chl a and Nutrient Measurements
Chl a content was estimated according to Jeffrey and Humphrey [28]. Prior to the photochemical measurements (HITACHI, U2900) filters were put into 8 mL acetone (90%) for 24 h in the dark at 6 ℃.
Particulate organic phosphorus (POP) was measured colorimetrically by an element analyzer (Thermo Scientific Flash 2000) at 882 nm, following the protocol by Hansen and Koroleff [29]. Nitrate and nitrite (NO3− and NO2−), ammonium (NH4+), silicate (SiO4−), and phosphate (PO4−) were, also, measured according to Hansen and Koroleff [29].
Furthermore, the Eutrophication Index (E.I.) of Primpas et al. [30] was used in order to assess the eutrophication status of Thessaloniki Bay. The formula takes into consideration the NO3− and NO2−, ammonium, PO4−, and Chl α concentrations resulting in three distinct ranges describing oligotrophy (0.04–0.38), mesotrophy (0.37–0.87), and eutrophication (0.83–1.51). The ranges are further divided into a five-scale scheme according to the WFD requirements, in order to assess the water quality status, as follows:
1. High ecological water quality: < 0.04 2. Good: 0.04–0.38
3. Moderate: 0.38–0.85 4. Poor: 0.85–1.51 5. Bad: > 1.51
Figure 1. Study area in Thermaikos Bay, indicating the location of the four sampling sites (*). WT:
White Tower, AR: Aretsou, MH: Music Hall, HB: Harbor.
During all samplings, in situ measurements of water temperature and conductivity were made with the use of the YSI Pro 1030 instrument (YSI Inc., Yellow Springs, OH, USA). Conductivity was transformed to salinity based on the equation in Weyl [27]. Water samples of 2 L were collected from the surface layer of 1 m, and separated as follows: (i) a subsample of 0.5 L was used for immediate microscopic observation of the living microbial eukaryotic community; (ii) a subsample of 0.5 L was preserved in Lugol’s solution and kept in the dark in room temperature for microscopic analysis within the next few days; (iii) subsamples of 100–250 mL (depending on plankton and particulate matter density) were immediately filtered onto 0.7µm pre-washed (in 5–10% HCl) and pre-combusted (6 h, 550◦C) Whatman GF/F filters, and the filters were stored in−20◦C until future particulate organic phosphorus and chlorophylla(Chla) measurements; (iv) a subsample of 50 mL was filtered through 0.2µm cellulose acetate filters (Sartorius) and the filtered water aliquots were kept in−20◦C until future dissolved inorganic nutrient measurements.
2.2. Chl a and Nutrient Measurements
Chlacontent was estimated according to Jeffrey and Humphrey [28]. Prior to the photochemical measurements (HITACHI, U2900) filters were put into 8 mL acetone (90%) for 24 h in the dark at 6◦C.
Particulate organic phosphorus (POP) was measured colorimetrically by an element analyzer (Thermo Scientific Flash 2000) at 882 nm, following the protocol by Hansen and Koroleff[29]. Nitrate and nitrite (NO3−
and NO2−
), ammonium (NH4+), silicate (SiO4−
), and phosphate (PO4−
) were, also, measured according to Hansen and Koroleff[29].
Furthermore, the Eutrophication Index (E.I.) of Primpas et al. [30] was used in order to assess the eutrophication status of Thessaloniki Bay. The formula takes into consideration the NO3−and NO2−, ammonium, PO4−
, and Chlαconcentrations resulting in three distinct ranges describing oligotrophy (0.04–0.38), mesotrophy (0.37–0.87), and eutrophication (0.83–1.51). The ranges are further divided into a five-scale scheme according to the WFD requirements, in order to assess the water quality status, as follows:
1. High ecological water quality: <0.04 2. Good: 0.04–0.38
3. Moderate: 0.38–0.85 4. Poor: 0.85–1.51
5. Bad: >1.51
The E.I. was calculated according to the following equation:
E.I.=0.279×PO4+0.261×NO3+0.296×NO2+0.275×NH3+0.214×Chla 2.3. Microscopic Analysis
Planktonic unicellular eukaryotes were examined in sedimentation chambers using an inverted epi-fluorescence microscope (Nikon Eclipse TE 2000-S, Melville, USA), with phase contrast. Taxa were identified based on taxonomic keys and relevant papers [31–33]. Light and phase-contrast micrographs of live and Lugol-preserved cells were taken using a digital microscope camera (Nikon DS-L1, Melville, USA). Plankton counts (cells and colonies) were performed using the inverted microscope method [34].
At least 400 individuals in total, and 100 individuals of the most abundant taxa, were counted per sample in sedimentation chambers. Taxa comprising of>10% of the total plankton abundance per sample were arbitrarily considered to be dominant for that particular sample. Population density of 1000 cells mL−1for a particular phytoplankton taxon in a sample was considered as a baseline bloom density in this urban coastal environment. This threshold is based on the Greek eutrophication scale and the total phytoplankton abundance (960 cells mL−1) given as an indicator of bad water quality or eutrophic coastal waters [35]. Potentially harmful plankton taxa identified during the study, were acknowledged according to the IOC-UNESCO Taxonomic Reference List of Harmful Microalgae.
2.4. Data Analysis
Alpha-diversity estimators (the Simpson, Shannon, Evenness, Equitability, and Berger–Parker indices) were calculated with the PAST 2.17c software [36] in all samples. These indices have been reported to better describe general properties of the communities [37] and reflect anthropogenic or environmental variability effects on ecosystem functions [38]. Paired t-tests were applied in PAST 2.17c software to compare the (i) physical and chemical variables and (ii), richness, abundance, and the alpha-diversity estimators between the four sampling sites. Thep-values<0.05 indicated significant differences between pairwise comparisons. Furthermore, pairwise comparisons of sampling sites, based on the relative abundance of individual taxa, were implemented with the Kolmogorov–Smirnov test in the PAST 2.17c software.
The plankton assemblages of the different samplings were compared using the Plymouth routines in the multivariate ecological research software package PRIMER v.6 [39]. The Jaccard coefficients were calculated to develop the matrix based on taxa abundance in order to identify interrelationships between samples and construct cluster and MDS (multi-dimensional scaling) plots. The similarity profile (SIMPROF) permutation test was conducted to determine the significance of the dendrogram branches resulting from cluster analysis.
Network analysis was performed in order to explore strong relationships among plankton taxa, and between plankton taxa and environmental parameters in all samplings. The relationships were characterized through MINE (maximal information-based nonparametric exploration) statistics by computing the maximal information coefficient (MIC) between each pair of taxa, and pairs of taxa and environmental parameters [40], considering abundance values for each taxon. MIC is a non-parametric method which captures associations (linear or non-linear) between data pairs. It provides a score that represents the strength of the relationship. The matrix of MIC values corresponding top-values<0.01, based on pre-computedp-values of various MIC scores at different sample sizes, was used to visualize the networks of associations with Cytoscape 3.5.1 [41]. Furthermore, correlation analysis was conducted in order to investigate the relationships between the plankton taxonomic groups and the E.I., and the inorganic nutrient molar ratios (N:P, Si:N, Si:P).
3. Results
3.1. Environmental Parameters
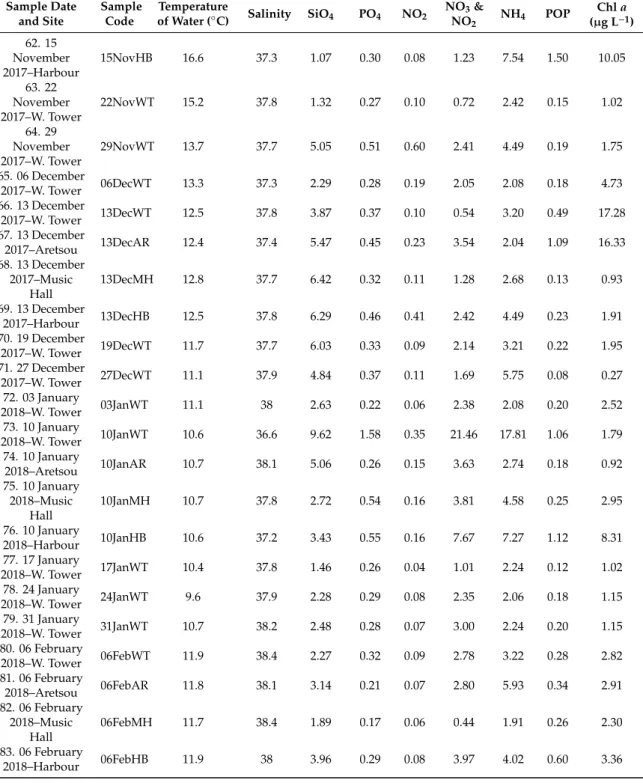
Seawater temperature recorded in the WT sampling site during the period of the study ranged from 9.60 to 29.7◦C and salinity from 32.8 to 38.8 (Table2), mean 37.2. The concentrations of inorganic nutrients (SiO4, PO4, NO3,NO2, NH4), and particulate organic phosphorus (POP) all exhibited strong fluctuations throughout the entire study period, with some extreme high values recorded in all sites, especially in WT (Supplementary Figure S1). In particular, remarkably high values were recorded for all nutrients on 22 March 2017 in the WT, (SiO4: 10.17µmol L−1; PO4: 9.54µmol L−1; NO2: 0.77µmol L−1; NO3and NO2: 7.53µmol L−1; NH4: 160.3µmol L−1; POP: 42.1µmol L−1), followed by high values of most nutrients during the sampling on 28 June 2017 in WT and MH, 20 September 2017 in all sites, and 10 January 2018 in WT. Additionally, the highest value of NH4(32.86µmol L−1) was recorded on 18 October 2017 in HB. The annual means of Chlafor each station were as follows: WT: 2.62µg L−1, AR: 3.11µg L−1, MH: 1.43µg L−1and HB: 3.15µg L−1. Furthermore, Chlashowed marked variability, ranging from 0.27µg L−1on 27 December 2017 in WT, to 17.28µg L−1on 13 December 2017 in WT. The mean inorganic nutrient ratios were 25.1 for N:P, 0.70 for Si:N and 18.4 for Si:P. The maximum N:P (71.9) and Si:P (76.6) ratios in WT was measured on 28 June 2017 while the minimum N:P ratio (10.1) on 13 December 2017 and the minimum Si:P ratio (1) on 22 March 2017. In the rest of the sites, the maximum N:P and Si:P ratios were recorded in August samples and the minimum in November (HB) and December samples (AR, MH). The calculated Si:N ratios were relatively low (<2) in all samples with maximum values coinciding with diatom blooms. All the calculated E.I. values exceeded the value 0.83 in all samples (data not shown), thus were indicative for eutrophication, reaching the highest value during the 22 March 2017 red tide event (49.5).
Considering the common sampling dates conducted in the different sampling sites, no significant differences were found in almost all paired comparisons of environmental parameters, based on t-tests (for a visualization of mean values of environmental parameters in each sampling site, see Supplementary Figure S2). Significant differences were found between sites for NO2(with AR>MH), for NO3and NO2(WT>MH; AR>MH), and for POP (WT>MH; MH<HB) (Supplementary Table S1).
Furthermore, higher ammonia (NH4) concentrations were recorded at HB (Table2), even though no statistically significant differences between sites were found.
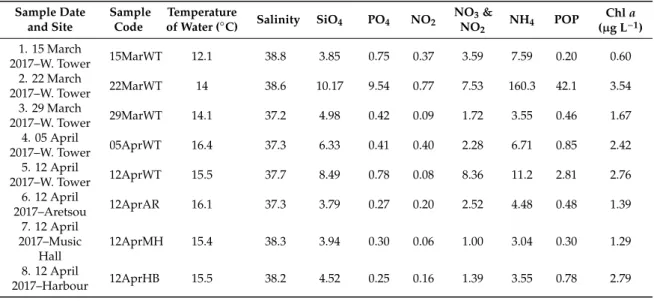
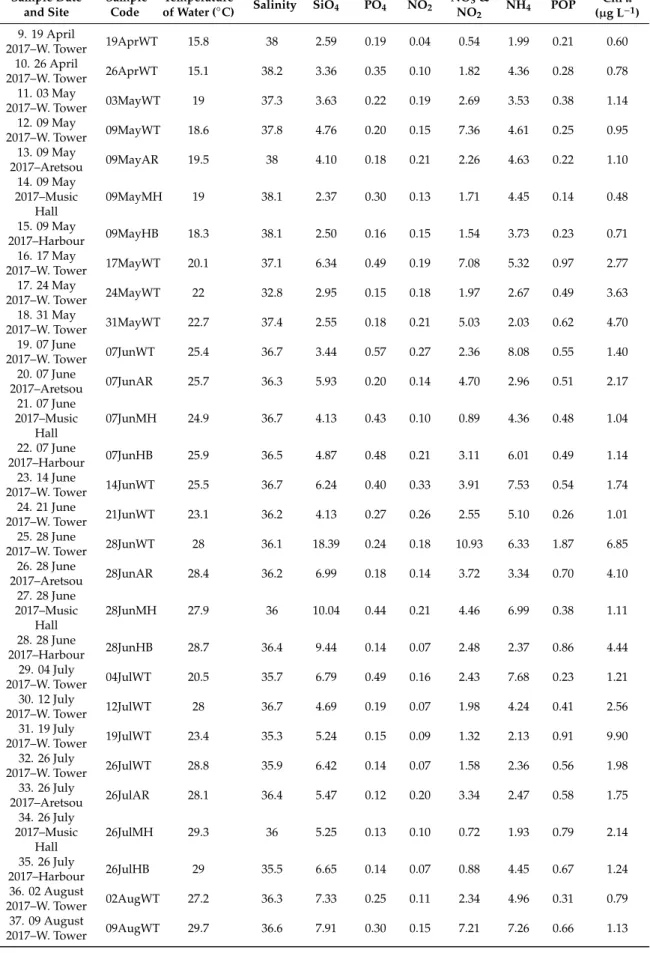
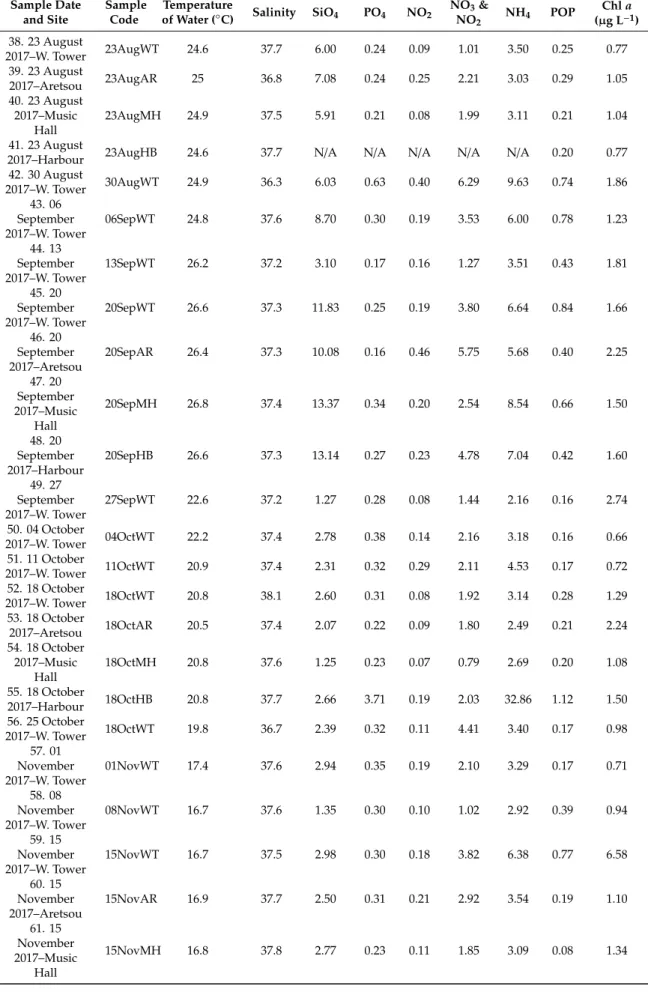
Table 2.Sample dates, sites and coding, and values of abiotic parameters (water temperature, salinity, SiO4, PO4, NO2, NO3and NO2, NH4, POP – Particulate Organic Phosphorus, Chla). All nutrient concentration values are given inµmol L−1. The sampling sites are shown in Figure1.
Sample Date and Site
Sample Code
Temperature
of Water (◦C) Salinity SiO4 PO4 NO2 NO3&
NO2 NH4 POP Chla (µg L−1) 1. 15 March
2017–W. Tower 15MarWT 12.1 38.8 3.85 0.75 0.37 3.59 7.59 0.20 0.60
2. 22 March
2017–W. Tower 22MarWT 14 38.6 10.17 9.54 0.77 7.53 160.3 42.1 3.54
3. 29 March
2017–W. Tower 29MarWT 14.1 37.2 4.98 0.42 0.09 1.72 3.55 0.46 1.67
4. 05 April
2017–W. Tower 05AprWT 16.4 37.3 6.33 0.41 0.40 2.28 6.71 0.85 2.42
5. 12 April
2017–W. Tower 12AprWT 15.5 37.7 8.49 0.78 0.08 8.36 11.2 2.81 2.76
6. 12 April
2017–Aretsou 12AprAR 16.1 37.3 3.79 0.27 0.20 2.52 4.48 0.48 1.39
7. 12 April 2017–Music
Hall
12AprMH 15.4 38.3 3.94 0.30 0.06 1.00 3.04 0.30 1.29
8. 12 April
2017–Harbour 12AprHB 15.5 38.2 4.52 0.25 0.16 1.39 3.55 0.78 2.79
Table 2.Cont.
Sample Date and Site
Sample Code
Temperature
of Water (◦C) Salinity SiO4 PO4 NO2 NO3&
NO2 NH4 POP Chla (µg L−1) 9. 19 April
2017–W. Tower 19AprWT 15.8 38 2.59 0.19 0.04 0.54 1.99 0.21 0.60
10. 26 April
2017–W. Tower 26AprWT 15.1 38.2 3.36 0.35 0.10 1.82 4.36 0.28 0.78
11. 03 May
2017–W. Tower 03MayWT 19 37.3 3.63 0.22 0.19 2.69 3.53 0.38 1.14
12. 09 May
2017–W. Tower 09MayWT 18.6 37.8 4.76 0.20 0.15 7.36 4.61 0.25 0.95
13. 09 May
2017–Aretsou 09MayAR 19.5 38 4.10 0.18 0.21 2.26 4.63 0.22 1.10
14. 09 May 2017–Music
Hall
09MayMH 19 38.1 2.37 0.30 0.13 1.71 4.45 0.14 0.48
15. 09 May
2017–Harbour 09MayHB 18.3 38.1 2.50 0.16 0.15 1.54 3.73 0.23 0.71
16. 17 May
2017–W. Tower 17MayWT 20.1 37.1 6.34 0.49 0.19 7.08 5.32 0.97 2.77
17. 24 May
2017–W. Tower 24MayWT 22 32.8 2.95 0.15 0.18 1.97 2.67 0.49 3.63
18. 31 May
2017–W. Tower 31MayWT 22.7 37.4 2.55 0.18 0.21 5.03 2.03 0.62 4.70
19. 07 June
2017–W. Tower 07JunWT 25.4 36.7 3.44 0.57 0.27 2.36 8.08 0.55 1.40
20. 07 June
2017–Aretsou 07JunAR 25.7 36.3 5.93 0.20 0.14 4.70 2.96 0.51 2.17
21. 07 June 2017–Music
Hall
07JunMH 24.9 36.7 4.13 0.43 0.10 0.89 4.36 0.48 1.04
22. 07 June
2017–Harbour 07JunHB 25.9 36.5 4.87 0.48 0.21 3.11 6.01 0.49 1.14
23. 14 June
2017–W. Tower 14JunWT 25.5 36.7 6.24 0.40 0.33 3.91 7.53 0.54 1.74
24. 21 June
2017–W. Tower 21JunWT 23.1 36.2 4.13 0.27 0.26 2.55 5.10 0.26 1.01
25. 28 June
2017–W. Tower 28JunWT 28 36.1 18.39 0.24 0.18 10.93 6.33 1.87 6.85
26. 28 June
2017–Aretsou 28JunAR 28.4 36.2 6.99 0.18 0.14 3.72 3.34 0.70 4.10
27. 28 June 2017–Music
Hall
28JunMH 27.9 36 10.04 0.44 0.21 4.46 6.99 0.38 1.11
28. 28 June
2017–Harbour 28JunHB 28.7 36.4 9.44 0.14 0.07 2.48 2.37 0.86 4.44
29. 04 July
2017–W. Tower 04JulWT 20.5 35.7 6.79 0.49 0.16 2.43 7.68 0.23 1.21
30. 12 July
2017–W. Tower 12JulWT 28 36.7 4.69 0.19 0.07 1.98 4.24 0.41 2.56
31. 19 July
2017–W. Tower 19JulWT 23.4 35.3 5.24 0.15 0.09 1.32 2.13 0.91 9.90
32. 26 July
2017–W. Tower 26JulWT 28.8 35.9 6.42 0.14 0.07 1.58 2.36 0.56 1.98
33. 26 July
2017–Aretsou 26JulAR 28.1 36.4 5.47 0.12 0.20 3.34 2.47 0.58 1.75
34. 26 July 2017–Music
Hall
26JulMH 29.3 36 5.25 0.13 0.10 0.72 1.93 0.79 2.14
35. 26 July
2017–Harbour 26JulHB 29 35.5 6.65 0.14 0.07 0.88 4.45 0.67 1.24
36. 02 August
2017–W. Tower 02AugWT 27.2 36.3 7.33 0.25 0.11 2.34 4.96 0.31 0.79
37. 09 August
2017–W. Tower 09AugWT 29.7 36.6 7.91 0.30 0.15 7.21 7.26 0.66 1.13
Table 2.Cont.
Sample Date and Site
Sample Code
Temperature
of Water (◦C) Salinity SiO4 PO4 NO2 NO3&
NO2 NH4 POP Chla (µg L−1) 38. 23 August
2017–W. Tower 23AugWT 24.6 37.7 6.00 0.24 0.09 1.01 3.50 0.25 0.77
39. 23 August
2017–Aretsou 23AugAR 25 36.8 7.08 0.24 0.25 2.21 3.03 0.29 1.05
40. 23 August 2017–Music
Hall
23AugMH 24.9 37.5 5.91 0.21 0.08 1.99 3.11 0.21 1.04
41. 23 August
2017–Harbour 23AugHB 24.6 37.7 N/A N/A N/A N/A N/A 0.20 0.77
42. 30 August
2017–W. Tower 30AugWT 24.9 36.3 6.03 0.63 0.40 6.29 9.63 0.74 1.86
43. 06 September 2017–W. Tower
06SepWT 24.8 37.6 8.70 0.30 0.19 3.53 6.00 0.78 1.23
44. 13 September 2017–W. Tower
13SepWT 26.2 37.2 3.10 0.17 0.16 1.27 3.51 0.43 1.81
45. 20 September 2017–W. Tower
20SepWT 26.6 37.3 11.83 0.25 0.19 3.80 6.64 0.84 1.66
46. 20 September 2017–Aretsou
20SepAR 26.4 37.3 10.08 0.16 0.46 5.75 5.68 0.40 2.25
47. 20 September 2017–Music
Hall
20SepMH 26.8 37.4 13.37 0.34 0.20 2.54 8.54 0.66 1.50
48. 20 September 2017–Harbour
20SepHB 26.6 37.3 13.14 0.27 0.23 4.78 7.04 0.42 1.60
49. 27 September 2017–W. Tower
27SepWT 22.6 37.2 1.27 0.28 0.08 1.44 2.16 0.16 2.74
50. 04 October
2017–W. Tower 04OctWT 22.2 37.4 2.78 0.38 0.14 2.16 3.18 0.16 0.66
51. 11 October
2017–W. Tower 11OctWT 20.9 37.4 2.31 0.32 0.29 2.11 4.53 0.17 0.72
52. 18 October
2017–W. Tower 18OctWT 20.8 38.1 2.60 0.31 0.08 1.92 3.14 0.28 1.29
53. 18 October
2017–Aretsou 18OctAR 20.5 37.4 2.07 0.22 0.09 1.80 2.49 0.21 2.24
54. 18 October 2017–Music
Hall
18OctMH 20.8 37.6 1.25 0.23 0.07 0.79 2.69 0.20 1.08
55. 18 October
2017–Harbour 18OctHB 20.8 37.7 2.66 3.71 0.19 2.03 32.86 1.12 1.50
56. 25 October
2017–W. Tower 18OctWT 19.8 36.7 2.39 0.32 0.11 4.41 3.40 0.17 0.98
57. 01 November 2017–W. Tower
01NovWT 17.4 37.6 2.94 0.35 0.19 2.10 3.29 0.17 0.71
58. 08 November 2017–W. Tower
08NovWT 16.7 37.6 1.35 0.30 0.10 1.02 2.92 0.39 0.94
59. 15 November 2017–W. Tower
15NovWT 16.7 37.5 2.98 0.30 0.18 3.82 6.38 0.77 6.58
60. 15 November 2017–Aretsou
15NovAR 16.9 37.7 2.50 0.31 0.21 2.92 3.54 0.19 1.10
61. 15 November 2017–Music
Hall
15NovMH 16.8 37.8 2.77 0.23 0.11 1.85 3.09 0.08 1.34
Table 2.Cont.
Sample Date and Site
Sample Code
Temperature
of Water (◦C) Salinity SiO4 PO4 NO2 NO3&
NO2 NH4 POP Chla (µg L−1) 62. 15
November 2017–Harbour
15NovHB 16.6 37.3 1.07 0.30 0.08 1.23 7.54 1.50 10.05
63. 22 November 2017–W. Tower
22NovWT 15.2 37.8 1.32 0.27 0.10 0.72 2.42 0.15 1.02
64. 29 November 2017–W. Tower
29NovWT 13.7 37.7 5.05 0.51 0.60 2.41 4.49 0.19 1.75
65. 06 December
2017–W. Tower 06DecWT 13.3 37.3 2.29 0.28 0.19 2.05 2.08 0.18 4.73
66. 13 December
2017–W. Tower 13DecWT 12.5 37.8 3.87 0.37 0.10 0.54 3.20 0.49 17.28
67. 13 December
2017–Aretsou 13DecAR 12.4 37.4 5.47 0.45 0.23 3.54 2.04 1.09 16.33
68. 13 December 2017–Music
Hall
13DecMH 12.8 37.7 6.42 0.32 0.11 1.28 2.68 0.13 0.93
69. 13 December
2017–Harbour 13DecHB 12.5 37.8 6.29 0.46 0.41 2.42 4.49 0.23 1.91
70. 19 December
2017–W. Tower 19DecWT 11.7 37.7 6.03 0.33 0.09 2.14 3.21 0.22 1.95
71. 27 December
2017–W. Tower 27DecWT 11.1 37.9 4.84 0.37 0.11 1.69 5.75 0.08 0.27
72. 03 January
2018–W. Tower 03JanWT 11.1 38 2.63 0.22 0.06 2.38 2.08 0.20 2.52
73. 10 January
2018–W. Tower 10JanWT 10.6 36.6 9.62 1.58 0.35 21.46 17.81 1.06 1.79
74. 10 January
2018–Aretsou 10JanAR 10.7 38.1 5.06 0.26 0.15 3.63 2.74 0.18 0.92
75. 10 January 2018–Music
Hall
10JanMH 10.7 37.8 2.72 0.54 0.16 3.81 4.58 0.25 2.95
76. 10 January
2018–Harbour 10JanHB 10.6 37.2 3.43 0.55 0.16 7.67 7.27 1.12 8.31
77. 17 January
2018–W. Tower 17JanWT 10.4 37.8 1.46 0.26 0.04 1.01 2.24 0.12 1.02
78. 24 January
2018–W. Tower 24JanWT 9.6 37.9 2.28 0.29 0.08 2.35 2.06 0.18 1.15
79. 31 January
2018–W. Tower 31JanWT 10.7 38.2 2.48 0.28 0.07 3.00 2.24 0.20 1.15
80. 06 February
2018–W. Tower 06FebWT 11.9 38.4 2.27 0.32 0.09 2.78 3.22 0.28 2.82
81. 06 February
2018–Aretsou 06FebAR 11.8 38.1 3.14 0.21 0.07 2.80 5.93 0.34 2.91
82. 06 February 2018–Music
Hall
06FebMH 11.7 38.4 1.89 0.17 0.06 0.44 1.91 0.26 2.30
83. 06 February
2018–Harbour 06FebHB 11.9 38 3.96 0.29 0.08 3.97 4.02 0.60 3.36
3.2. Plankton Diversity and Abundance
A total of 117 plankton morphospecies were identified in all four sampling sites during the study period (Supplementary Table S2). The taxonomic group of Bacillariophyta (diatoms) had the highest overall species richness as 44% of the total number of taxa belonged to this group, and was followed by Dinophyta (including also mixotrophic and heterotrophic dinoflagellates) (37% of the total number of taxa), Cryptophyta (5%), Haptophyta (3%), Chlorophyta (2%), Dictyochophyta (2%), and Euglenozoa (2%), while other groups (Cercozoa, Chrysophyceae, Telonemida, Xanthophyceae, and Ciliophora) contributed with<2% of the total number of taxa (Supplementary Figure S3). In the four sampling sites, dinoflagellates were more diverse in terms of species richness during March 2017–November
2017, while diatoms appeared to be more diverse, in all sites, during December 2017–February 2018 (Supplementary Figure S3). The other taxonomic groups had a more or less consistent representation that altogether did not exceed in any case 40% of the total number of taxa in a sample.
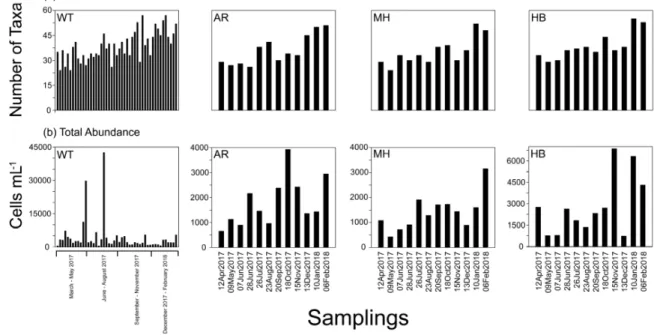
The number of identified taxa varied among samples between 24 (22 March and 19 April in WT, and 9 May 2017 in MH) and 57 taxa on 8 November 2017 in WT (Supplementary Table S3), with the highest values in December–February when the measured water temperature was lower than 15◦C (Figure2a).
High variability was recorded in total cell abundance of phytoplankton reaching a maximum of 42,000 cells mL−1on 19 July 2017 in WT, dominated by the diatomSkeletonema costatum(see Figure2b).
Heterotrophic dinoflagellates dominated by red tide formingN. scintillansexhibited highest values on 22 March 2017 in WT (>3250 cells mL−1). The mean total taxa number and abundance were the only a-diversity estimators that were found significantly different in some paired comparisons between the different sites, based on t-tests; in particular: WT>AR, WT>MH and MH<HB (Supplementary Table S4; for a visualization of mean values of taxa number and abundance values in each sampling site, see Supplementary Figure S4). However, no significant differences in the distribution of the taxa relative abundances between sites were detected according to the Kolmogorov-Smirnov test (p>0.05). The other a-diversity estimators calculated (Simpson, Shannon, Equitability, Evenness, and Berger–Parker), fluctuated during the study, and showed sometimes relatively low values, reflecting high dominance by one (or few) taxa, and high variation between taxa abundances within the community. In particular, the sampling dates with the low Simpson index (1-D) were: 22 March 2017 (0.10 in WT), 5 April 2017 (0.43 in WT), 31 May 2017 (0.22 in WT) and 18 October 2017 (0.29 in AR) (Supplementary Table S3).
Diversity 2019, 11, x FOR PEER REVIEW 9 of 22
< HB (Supplementary Table S4; for a visualization of mean values of taxa number and abundance values in each sampling site, see Supplementary Figure S4). However, no significant differences in the distribution of the taxa relative abundances between sites were detected according to the Kolmogorov-Smirnov test (p > 0.05). The other a-diversity estimators calculated (Simpson, Shannon, Equitability, Evenness, and Berger–Parker), fluctuated during the study, and showed sometimes relatively low values, reflecting high dominance by one (or few) taxa, and high variation between taxa abundances within the community. In particular, the sampling dates with the low Simpson index (1-D) were: 22 March 2017 (0.10 in WT), 5 April 2017 (0.43 in WT), 31 May 2017 (0.22 in WT) and 18 October 2017 (0.29 in AR) (Supplementary Table S3).
Figure 2. Number of taxa (a), and total abundance (b) in White Tower (WT), Aretsou (AR), Music Hall (MH), and Harbor (HB). For sampling codes, see also Table 2.
3.3. Phytoplankton Blooms, Red Tides, and a Mucilage Aggregate Phenomenon
Based on the plankton community composition and abundance during the study period, four major clusters were identified at a similarity level ~ 35% (Figure 3) grouping together the samplings irrespectively of the sample collection site, according to the sampling dates: March–June 2017 (Cluster I); July–October 2017 (Cluster II); November 2017 (Cluster III); and December 2017–February 2018 (Cluster IV). This is in accordance with the results of the t-test paired comparisons of a-diversity indices between sites that showed no significant differences in most occasions. The samples in each cluster were further grouped together based on higher similarity levels (> 40% similarity). These groupings included a small number of samples taken in close dates and were characterized by phytoplankton blooms (> 1000 cells mL−1) of a taxonomic group or a single species, or/and red tides (Figure 3).
Figure 2.Number of taxa (a), and total abundance (b) in White Tower (WT), Aretsou (AR), Music Hall (MH), and Harbor (HB). For sampling codes, see also Table2.
3.3. Phytoplankton Blooms, Red Tides, and a Mucilage Aggregate Phenomenon
Based on the plankton community composition and abundance during the study period, four major clusters were identified at a similarity level ~ 35% (Figure3) grouping together the samplings irrespectively of the sample collection site, according to the sampling dates: March–June 2017 (Cluster I);
July–October 2017 (Cluster II); November 2017 (Cluster III); and December 2017–February 2018 (Cluster IV). This is in accordance with the results of the t-test paired comparisons of a-diversity indices between sites that showed no significant differences in most occasions. The samples in each cluster were further grouped together based on higher similarity levels (>40% similarity). These groupings included
a small number of samples taken in close dates and were characterized by phytoplankton blooms (>1000 cells mLDiversity 2019, 11, x FOR PEER REVIEW −1) of a taxonomic group or a single species, or/and red tides (Figure3). 10 of 22
Figure 3. Cluster diagram according to Jaccard resemblance, calculated based on the non-transformed abundance (cells mL−1) of taxa during the study. Red clades in the dendrogram indicate sections of the plot where the observed profile corresponds to similarities that are larger than those expected under null conditions (> 99% of the confidence envelope), suggesting the presence of true structure within the data. The nodes represent the dominant taxa blooming during the period covered by the corresponding clades.
During the period March–June 2017 a persistent diatom bloom was detected at the White Tower (WT) site, due to the high abundances recorded throughout for the taxa of Leptocylindrus danicus (max: > 7000 cells mL−1 on 24 May) and Leptocylindrus minimus (max abundance: > 26000 cells mL−1 on 31 May). In specific samplings, i.e., on 24 May 2017, the taxon S. costatum additionally showed high concentrations reaching > 1000 cells mL−1. The diatom bloom was accompanied by a Coccolithales bloom between 5 and 12 April 2017 (> 5300 cells mL−1).
On the other hand, conspicuous red tides, macroscopically visible, appeared in the front of the Bay at three occasions, during this period, making the water viscous. The red tides were detected at 22 March, 12 April, and 14–21 June 2017, and mainly consisted of the known red tide forming dinoflagellates N. scintillans and its close relative Spatulodinium pseudonoctiluca. Especially on 22 March 2017, the event was so intense that the sample consisted entirely of N. scintillans cells, reaching 3250 cells mL−1, comprising > 99% of the total abundance. The co-occurrence of these species with bloom-forming, mucilage-producing diatoms, e.g., Cylindrotheca closterium, Chaetoceros spp., L. minimus, L. danicus, S. costatum, the haptophyte Phaeocystis sp. and the dinoflagellate Gonyaulax cf. fragilis, were observed. They were producing or being embedded in mucilage, before and during the development of an extreme aggregation of mucilage, between 28 June and 4 July 2017.
N. scintillans was observed to feed on diatoms, and most commonly on Chaetoceros spp.
During the period July–October, diatoms remained in high numbers, dominated by the taxa Chaetoceros spp. (max: > 6000 cells mL−1 on 19 July), and more rarely C. closterium (max: > 1800 cells
Figure 3.Cluster diagram according to Jaccard resemblance, calculated based on the non-transformed abundance (cells mL−1) of taxa during the study. Red clades in the dendrogram indicate sections of the plot where the observed profile corresponds to similarities that are larger than those expected under null conditions (>99% of the confidence envelope), suggesting the presence of true structure within the data. The nodes represent the dominant taxa blooming during the period covered by the corresponding clades.
During the period March–June 2017 a persistent diatom bloom was detected at the White Tower (WT) site, due to the high abundances recorded throughout for the taxa of Leptocylindrus danicus (max: >7000 cells mL−1on 24 May) andLeptocylindrus minimus(max abundance: >26000 cells mL−1 on 31 May). In specific samplings, i.e., on 24 May 2017, the taxonS. costatumadditionally showed high concentrations reaching>1000 cells mL−1. The diatom bloom was accompanied by a Coccolithales bloom between 5 and 12 April 2017 (>5300 cells mL−1).
On the other hand, conspicuous red tides, macroscopically visible, appeared in the front of the Bay at three occasions, during this period, making the water viscous. The red tides were detected at 22 March, 12 April, and 14–21 June 2017, and mainly consisted of the known red tide forming dinoflagellates N. scintillansand its close relativeSpatulodinium pseudonoctiluca. Especially on 22 March 2017, the event was so intense that the sample consisted entirely ofN. scintillanscells, reaching 3250 cells mL−1, comprising>99% of the total abundance. The co-occurrence of these species with bloom-forming, mucilage-producing diatoms, e.g.,Cylindrotheca closterium,Chaetocerosspp.,L. minimus, L. danicus, S. costatum, the haptophytePhaeocystissp. and the dinoflagellateGonyaulaxcf.fragilis,were observed.
They were producing or being embedded in mucilage, before and during the development of an
extreme aggregation of mucilage, between 28 June and 4 July 2017. N. scintillanswas observed to feed on diatoms, and most commonly onChaetocerosspp.
During the period July–October, diatoms remained in high numbers, dominated by the taxa Chaetoceros spp. (max: >6000 cells mL−1 on 19 July), and more rarely C. closterium (max: >1800 cells mL−1on 20 September). On 19 July and 13 September 2017, the taxonS. costatum, additionally showed high abundances reaching>25,000 and>1500 cells mL−1, respectively.
The diatom bloom was followed by an increase in the abundance of the harmful dinoflagellate Dinophysiscf.acuminata,during November 2017 (Figure3). In particular, on 8 November 2017,D.cf.
acuminatareached 120 cells mL−1, in WT, while up to 350 cells mL−1of this species were recorded at HB on the 15th November 2017.
The high abundances ofD.cf. acuminatain November 2017 were followed by a red tide in all sampling sites during the period December 2017–February 2018. This bloom was dominated by the photosynthetic ciliateMesodinium rubrum, first appearing in the Bay on 29 November 2017, and peaking from 13 December 2017 till 10 January 2018, reaching>1000 cells mL−1on 13 December. The period January–February 2018 was characterized by diatom dominance, i.e., the taxaChaetoceros tenuissimus (max abundance>2000 cells mL−1on 6 February, WT), andS. costatum(reaching 1000 cells mL−1on 3 January, WT).
Based on the IOC-UNESCO Taxonomic Reference List of Harmful Microalgae it can be stated that at least 11 out of 117 plankton taxa found in the present study have been reported as harmful. These taxa are the diatomsPseudonitzschiacf. delicatissima,Pseudonitzschiacf. multistriata,Pseudonitzschia cf. pseudodelicatissima, andPseudonitzschiacf. pungens, the dictyochophyceanVicicitus globosus, the haptophytePhaeocystissp. and the dinoflagellatesD.cf. acuminata,Dinophysis caudata,Karenia brevis, Karlodiniumspp., and the epiphyticProrocentrumcf.lima. In particular, the diatomsP.cf. delicatissima, P.cf. pseudodelicatissima, andP.cf. pungenswere detected in concentrations>500 cells mL−1at the White Tower (WT) site on 19 July 2017, just after the mucilage aggregate phenomenon. Relatively high abundances (270 cells mL−1) were recorded forK. brevisat WT on the 28 June, right in the middle of the mucilage aggregate phenomenon. An extremely high bloom (>10,500 cells mL−1) was observed at the same sampling point one year later (unpublished data).
3.4. Links of Environmental Parameters and Plankton Bloom, Red Tide, and Mucilaginous Aggregate-Forming Taxa
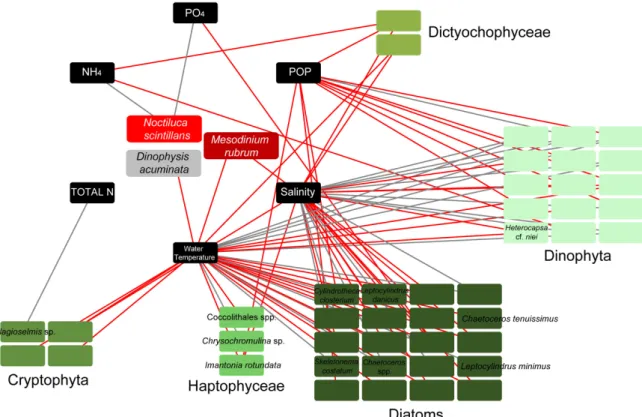
Connections between all detected taxa, including all phytoplankters and red tide/bloom-forming taxa, were investigated according to the MIC correlation coefficient. Only the strong connections between phytoplankters/red tide forming species and environmental parameters were visualized in network analysis (Figure4). The strong connections represented MIC values corresponding to pre-calculatedp-values (withp<0.01), based on the total number of samples. Network analysis showed negative connections between salinity/water temperature and the majority of diatom taxa included in the network, and all Cryptophyta and Dictyochophyceae. However, the diatomsChaetocerosspp., S. costatum, andL. minimus, all mucilage producers, were positively connected with salinity/water temperature. Dinophyta, on the other hand, showed mostly positive strong connections with salinity/water temperature and negative with POP (Figure4). To note, the red tide formingN. scintillans showed strong positive connections with NH4and PO4, while the other red tide forming species, M. rubrum, exhibited negative connections with salinity and water temperature. Finally, the harmful algaD.cf. acuminatadisplayed negative connection with water temperature (Figure4).
Figure 4. Network diagrams of highly significant connections (p-values < 0.01) based on the maximal information coefficient (MIC) scores between dominant taxa (comprising of > 10% of the total plankton abundance in at least one sample) and environmental parameters. Boxes (nodes) with indicated taxa names, represent bloom (detected with abundances > 1000 cells mL−1 in at least one sample throughout the samplings), and red tide forming taxa. To facilitate reading only bloom and red tide forming taxa are indicated. Black lines (edges) depict positive connections, and red edges depict negative connections.
4. Discussion
The reason for our focus on plankton community weekly dynamics of the urban marine system in the Thessaloniki Bay’s front was motivated by the lack of relevant data in this particular system in eutrophication studies of Thermaikos Gulf, despite the recurrent phenomena of harmful algal blooms (HABs) and conspicuous mucilage phenomena. These phenomena are of great ecological importance for the coastal system and have significant socio-economic impact to the city’s residents. After discussing nutrient pressure in the system, species diversity will be discussed, dominance of blooms and red tide forming species, and the key species which were the cause of the mucilage phenomenon verifying results of the marine eutrophication research and the related eutrophication symptoms [26].
4.1. Environmental Conditions
In the study area, a heavily modified marine water body according to WFD, annual mean salinity was 37.2 and close to the highest threshold value (37.5) for type IIA of the Mediterranean coastal water types that have been intercalibrated (applicable for phytoplankton) according to Commission Decision 2018/229/UE. This type of coastal water is considered moderately influenced by freshwater inputs, while the annual salinity average value is close to the boundary value (37.5) for type IIIE.
Phytoplankton metrics have been intercalibrated only for type IIIE in Greece [35].
Throughout the study, nutrients (N and P) which are indication of eutrophication exhibited high values and were among the highest values reported for nutrient-rich coastal areas of the
Figure 4.Network diagrams of highly significant connections (p-values<0.01) based on the maximal information coefficient (MIC) scores between dominant taxa (comprising of>10% of the total plankton abundance in at least one sample) and environmental parameters. Boxes (nodes) with indicated taxa names, represent bloom (detected with abundances>1000 cells mL−1in at least one sample throughout the samplings), and red tide forming taxa. To facilitate reading only bloom and red tide forming taxa are indicated. Black lines (edges) depict positive connections, and red edges depict negative connections.
Dinoflagellates were found to be significantly positively correlated with E.I. (p<0.001,r=0.64), N:P (p<0.01,r=0.31) and Si:P (p<0.05,r=0.26), while Cryptophyceae were significantly negatively correlated with Si:N (p<0.01,r=−0.31) and Si:P (p<0.05,r=−0.22).
4. Discussion
The reason for our focus on plankton community weekly dynamics of the urban marine system in the Thessaloniki Bay’s front was motivated by the lack of relevant data in this particular system in eutrophication studies of Thermaikos Gulf, despite the recurrent phenomena of harmful algal blooms (HABs) and conspicuous mucilage phenomena. These phenomena are of great ecological importance for the coastal system and have significant socio-economic impact to the city’s residents.
After discussing nutrient pressure in the system, species diversity will be discussed, dominance of blooms and red tide forming species, and the key species which were the cause of the mucilage phenomenon verifying results of the marine eutrophication research and the related eutrophication symptoms [26].
4.1. Environmental Conditions
In the study area, a heavily modified marine water body according to WFD, annual mean salinity was 37.2 and close to the highest threshold value (37.5) for type IIA of the Mediterranean coastal water types that have been intercalibrated (applicable for phytoplankton) according to Commission Decision 2018/229/UE. This type of coastal water is considered moderately influenced by freshwater inputs, while the annual salinity average value is close to the boundary value (37.5) for type IIIE.
Phytoplankton metrics have been intercalibrated only for type IIIE in Greece [35].
Throughout the study, nutrients (N and P) which are indication of eutrophication exhibited high values and were among the highest values reported for nutrient-rich coastal areas of the Mediterranean Sea [42–44]. In a recent comprehensive study on various coastal areas of Greece (1995–2007) influenced by anthropogenic activities, mainly by sewage and riverine outflows [45], the Thessaloniki Bay which is one of the most polluted coastal areas of Greece, exhibited the highest PO4(max 6.50µmol L−1) and NH4concentrations (max 15µmol L−1). Comparing to the highest values of nutrients during 1995–2007 [45], the values in this study (max 9.50µmol L−1 and 160µmol L−1for PO4 and NH4, respectively) were even higher [45]. On the other hand, the highest NO3value (21.09µmol L−1) in the urban front of Thessaloniki Bay during our survey was slightly lower than the highest measured NO3 value (23.5µmol L−1) during the period April–May 2012 [46]. Even so, both of them are extremely high for coastal sites, and are indicative of nitrogen pollution due to anthropogenic activities [47].
These outliers can be used as a sensitive tool for assessing water quality in coastal management studies according to Karydis [48], who showed that outliers are more sensitive in characterizing pollution/eutrophication levels than whole datasets, which usually include a large number of low values. The average N:P ratio in this study was higher (mean 25) compared to the N:P ratio (6.40) of the period 1995–2007 [45]. The high N:P ratio during the present study, in combination with the extreme NH4concentrations, may be linked to the relatively high contribution of dinoflagellates, such asN. scintillansandS. pseudonoctiluca, to plankton community biomass [49]. The much higher NH4 values in 2017–2018 in combination with the high N:P ratio indicated nitrogen pollution, an increasing global problem [50]. Agriculture is the largest source of nitrogen pollution to many of the planet’s coastal marine ecosystems [51].
In addition to high nutrient concentrations and ratios, the annual mean values of Chlafor all stations were higher than the values measured in the same area in 2012 [47]. Based on our data, ecological water quality can be classified as bad according to Simboura et al. [47]. Low Chlavalues coincided both with low and high cell abundances in WT and HB. In most samples of WT the low Chlacoincided with high cell densities in spring and summer under high irradiance/day-length and temperature whenL. danicusandL. minimuswere the dominant species. These results may reflect the physiological state of these diatoms on their Chlacontent due to the effect of temperature and irradiance [52,53]. Similarly, low Chlawas measured simultaneously with highLeptocylindrusdensities in HB.
In addition to the evaluation of the eutrophication and the nitrogen pollution of the study area, based on the individual nutrient variations and their extreme values (outliers), the multimetric eutrophication index E.I. [30] is of great interest for coastal management. In our samples, the E.I. values were always>0.83 (mean 2.56 after excluding outliers) indicating a heavily eutrophic system reflecting bad environmental status according to Pavlidou et al. [46]. The poor to bad water quality of Thessaloniki Bay according to the phytoplankton-based indices and the E.I. index used, is indicative of both nitrogen and phosphorus enrichment. There is evidence for Greek coastal waters that phytoplankton-based indices are highly sensitive to nitrogen enrichment while the E.I. index is highly sensitive to phosphorus enrichment [43]. It is noteworthy that according to Pavlidou et al. [46] the E.I. reflected the integral eutrophication status of a water body as a whole and has been proposed as a reliable tool regarding the assessment of eutrophication status, and the implementation of nutrient management strategies under the EU WFD and the EU MSFD.
4.2. Diversity and Composition of the Plankton Community
Various a-diversity indices have been used (Shannon, Simpson, Equitability, Evenness, Berger-Parker) to describe the structure of the community in terms of its species diversity, dominance and evenness. The species pool of the unicellular eukaryotic plankton community reflected by the a-diversity indices [54] was found similar in the four sampling sites, according to pairwise comparisons with t-test (see Table S4 for a-diversity pairwise comparisons). Additionally, the Kolmogorov–Smirnov test showed no significant differences on the distribution of taxa between sampling sites. A seed