Access Regulation and Utilization of Healthcare Services
Nadine Reibling
Claus Wendt
Nadine Reibling Claus Wendt
Access Regulation and Utilization of Healthcare Services
Arbeitspapiere – Working Papers Nr. 113, 2008
Mannheimer Zentrum für Europäische Sozialforschung
Reibling, Nadine:
Access Regulation and Utilization of Healthcare Services / Nadine Reibling;
Claus Wendt. – Mannheim: 2008.
(Arbeitspapiere - Mannheimer Zentrum für Europäische Sozialforschung ; 113) ISSN 1437-8574
Not available in book shops.
Token fee: € 3.00
Purchase: Mannheimer Zentrum für Europäische Sozialforschung (MZES), D – 68131 Mannheim WWW: http://www.mzes.uni-mannheim.de
Editorial Note:
Nadine Reibling is a Ph.D. student at the Graduate School of Economic and Social Sciences in Mannheim. Her areas of interests are comparative health policy, medical sociology, welfare state research, political sociology, and empirical research methods.
Claus Wendt is senior research fellow and project director at the Mannheimer Zentrum für Europäische Sozialforschung (MZES).
Requests for additional inform are very welcome. Please contact: nreiblin@mail.uni-mannheim.de.
Abstract
Regulating patients’ access to healthcare has been used in several countries as a way of controlling patients’ consumption levels. In some countries, provider choice is directly limited through legal regu- lations such as gatekeeping, whereas in other countries patients’ behavior is primarily governed by financial incentives like co-payments to doctor visits. However, empirical studies, mostly conducted in the United States, do not provide a clear answer whether institutional access regulations actually ac- complish a reduction of used health services. The objective of this paper is to assess the impact of access regulations on healthcare utilization in a cross-national framework comparing eleven European countries. While access restrictions are assumed to have an effect on the overall level of utilization, they can also have an impact on the equity of utilization between different socio-economic groups. Our analyses combine institutional indicators on the country level and number of doctor visits on the micro- level from the first wave of SHARE. The results show that access regulations and especially gatekeep- ing systems are associated with a lower level of overall service usage. Gatekeeping systems also reduce inequity in specialist visits across groups with different levels of education. Contrary to theo- retical expectations but in line with earlier studies cost sharing could not be related to inequity patterns across income groups.
Contents
1. Introduction ... 1
2. Access and Utilization... 3
3. Institutional Characteristics of the Delivery System... 6
4. Data and Method ... 17
5. Results ... 21
6. Conclusion ... 30
7. References... 32
Introduction
1Universal access to healthcare is a governing principle of European health systems. In fact, opposed to most other countries, including the United States, European countries have followed through on the promise of universal access to healthcare for their populations (Freeman 2000; OECD 2004). Begin- ning in the 1950s not only in National Health Service but also in Social Health Insurance type of sys- tems establishing equal access to healthcare for all citizens was a primary policy goal in health poli- tics. As a result, Western European countries gradually extended coverage and benefits. However, following the oil price shocks of the 1970s and increasingly since the 1990s, controlling expenditures has dominated the political debate. This led to the realization that universal access does not mean that all types of care are freely available at customer’s demand. Having experienced a steep increase of health expenditure today there is high consensus among policy makers and researchers alike that access to healthcare has to be regulated in order to keep it affordable (Leidl 1999; Gulliford et al.
2003; Breyer et al. 2005).
There are multiple options for regulating consumption in the field of healthcare such as the determina- tion of the overall budget or setting physicians’ remuneration (Saltman and Busse 2002). In the last two decades, however, there has been a trend towards applying micro-economic regulation instru- ments which aim to directly influence patients’ access and care-seeking behavior. The two instruments that have been first of all used for patient regulation are gatekeeping and cost sharing.
Gatekeeping systems regulate the use of services by transferring responsibility for decisions about care to general practitioners, thus limiting individuals access to more expensive specialists (Franks et al. 1992; Scott 2000; Wasem et al. 2003; Pihl et al. 2005). Cost sharing, on the other hand, reintro- duces price mechanisms in third party payer systems in order to encourage patients to use healthcare in a more conscious way and thus more efficiently (Ros et al. 2000; Thomson and Mossialos 2004).
Since cost containment is at the top of the political agenda, efficiency considerations dominate the political discussions on instruments that regulate access to care. This, however, neglects the fact that such measures also have implications regarding equity of access (Saltman and Busse 2002). Equity is based on the notion that there is “a basic human need for care” and that consequently differences in care utilization are only ethical when they are based on differences in need (Hanratty et al. 2007).
Even though most European health systems have some private arrangements that provide superior or quicker care, the universal system in which the total population is integrated is clearly oriented at the principle of equal access to care for equal need (OECD 2004; Hanratty et al. 2007).
1 The research reported here has received financial support from the German Research Foundation. We would also like to thank Gwyn Bevan, Anna Dixon, Monika Steffen, Zeynep Or, Carolyn Tuohy and further partici- pants at The European Health Policy Group meeting in Dublin, April 17 & 18, 2008, Michaela Pfeifer, Monika Mischke and Nicole Biedinger for their helpful comments.
Gatekeeping can improve equity by standardizing the way healthcare is accessed. This way, people with a higher educational level do not have the opportunity to access specialists directly due to their informational advantage as it is the case in free access systems. Cost-sharing, in contrast, provokes concern for increased income inequity in utilization because the burden of co-payments hits lower income groups and the chronically ill disproportionally (Robinson 2002; Holst 2007).
Differences in utilization across socio-economic groups are referred to as horizontal inequity but equity has also a vertical dimension. This refers to the distribution of care across groups with different need levels (“health status”). It points to the norm that resources should be devoted to those who have the highest need. Access regulations can also influence vertical inequity. By regulating access to care especially people with low need levels should be discouraged from entering the system and in particu- lar from receiving specialist care.
These considerations demonstrate the centrality of access regulations not only for the individual pa- tient but also for the overall performance of health systems. Consequently, it is of importance to inves- tigate whether the assumptions about the influence of access regulations on consumption levels and equity hold when tested empirically. Hence, the objective of this study is to analyze how access regu- lations affect patterns of healthcare utilization along the following three research questions:
(1) Is stronger regulation of access associated with a lower level of medical care utilization?
(2) Does a strong regulation of access decrease or increase group differences in utilization due to education or income?
(3) Does access regulation increase differences in the utilization of care by different health groups?
Although the effects of access regulation have been analyzed before, the evidence derives mainly from studies conducted in the United States. However, due to the fragmentation and complexity of the U.S. system, it is questionable whether the results can be transferred to European health systems.
Moreover, in the U.S. regulations are not set at a national or state level. Studies conducted in the U.S.
are therefore small-scaled, often analyzing differences at the level of insurance companies. In Euro- pean health systems, however access regulations are mostly institutionalized at the national level so that the largest part of the variance can be found between countries. Therefore, a cross-national com- parative research design should provide more conclusive evidence for Europe.
The empirical test of our hypotheses is based on the combination of macro-level institutional indicators and micro-level survey data of the first wave of SHARE, a comparative study of people over 50 con- ducted in 11 European countries in 2004. Looking at the elderly is of special relevance for healthcare issues because higher age increases the probability of both acute and chronic diseases. These higher need levels make older people use healthcare most frequently of all population groups. Consequently, the effect of access regulations on utilization levels and costs depends very much on how older people react to or are affected by those.
In section 2, the theoretical relation between institutional access regulations and utilization is outlined.
Section 3 gives an overview of instruments of access regulations, evidence of effects on utilization and a description of our measurement of legal regulations. A description of data, variables and method can be found in section 4. Section 5 includes results of the effects of access regulations on utilization lev- els and within-country differences of utilization. Implications of our research regarding effects of ac- cess regulations as well as for cross-national research in this area are discussed in the final section 6.
Access and Utilization
There are two lines of literature that investigate access to the healthcare system. Medical sociological approaches analyze the care-seeking decisions of individuals. Based on the finding that need or health status cannot explain the variability in using professional care across groups, they investigate which personal attributes influence the decision about seeking care. Comparative health studies also investigate access but on the level of nation states. Instead of looking at the individual, they identify characteristics of the health system that determine access. The purpose of this study is to contribute to a connection between both lines of literature. Therefore, this section concludes with a theoretical explanatory model which integrates access features on the individual and on the system level.
Despite the vast literature on access, little agreement has been reached on how to define it (Oliver and Mossialos 2004). Andersen (1995) discriminates between “potential access”, which refers to indi- vidual and institutional factors increasing the potential for entry into the health system, and “realized access”, which describes the factual utilization of services. In a nutshell: there is a difference between people having access and gaining access (Gulliford et al. 2003).
The study of illness behavior in medical sociological research has stimulated several models and con- cepts of what are the relevant influence factors in the care-seeking decision (Mechanic 1962;
Pescosolido 1992; Young 2004). The dominant framework used in empirical studies analyzing health utilization is the behavioral model of health services use by Ronald Andersen (1973; 1974; 1995).
According to the model, utilization measured by the type and frequency of services consumed is influ- enced by factors on two different levels. On the individual level, variables such as predisposing and enabling factors as well as need are important; on the system level, resources and organization of healthcare are the relevant influence factors. System-level variables can have both a direct effect on utilization as well as an indirect effect via individual-level characteristics.
The micro level components are defined as follows:
• Predisposing characteristics include “demographic, social structural, and attitudinal-belief vari- ables” which increase the probability of a person to enter the health system in case of sickness (Andersen and Newman 1973: 108). Consequently, these variables are present before the mani- festation of any medical condition (Crets 1996). Examples for predisposing characteristics are: sex (demographic), education (social structural) and knowledge about disease (beliefs).
• Enabling variables are factors that make sources available to persons such as income and insur- ance coverage and care available on the community level (Andersen and Newman 1973). These variables are not strictly located on the individual level but on the level of family, household or community (Aday and Andersen 1974).
• Need is the most immediate factor or ultimate cause for healthcare use and therefore refers to “the actual illness problem that the individual is experiencing and the clinically judged severity of this illness” (Andersen and Newman 1973: 110).
These factors are complemented by characteristics of the health delivery system:
• Resources refer to the health personnel and material resources which are available in a health system. Both volume and geographical distribution of these resources play an important role for their accessibility (Aday and Andersen 1974).
• Organization is further subcategorized into entry and structure. Factors that determine “entry” to care are for example travel and waiting time. “Structure” relates to the regulations that determine who treats the patient and how (Aday and Andersen 1974).
Compared to earlier models, the strength of the Andersen model is that it emphasizes the influence of the care delivery system. It highlights the fact that not only individual need but also national health policy and institutional organization of healthcare are crucial determinants of service utilization. Ander- sen (1995: 4) specifically stresses the point that the focus on global measures is fundamental because
“to inform national health policy, global measures provide needed comprehensive indicators of the overall effect of policy change”.
Despite the attention paid to characteristics of the health delivery system in this model, most empirical applications have been focused on the role of the individual level determinants (Gold 1998; Young 2004). In their review of 139 empirical studies that referred to the behavioral model, Phillips and col- leagues (1998: 571) come to the conclusion that only “few studies examined specific measures of the healthcare system or provider characteristics”. This indicates that the usefulness of Andersen’s model for assessing the role of macro-level and institutional variables for utilization of medical services is still understudied. The purpose of this study is to contribute to research in this field by filling this gap and strengthening the importance of health system features for utilization.
Healthcare systems are often compared alongside institutional indicators, access being one of them.
Often access is defined by the source of entitlement or the scope of coverage of the health system.
This is a rather narrow definition of access because “even in systems of universal coverage, serious access barriers remain” (Busse et al. 2006: 4).
More recent cross-country analyses focused on modes of regulations, respectively governance in healthcare systems (e.g. Moran 1999; 2000; Rico et al. 2003; Tuohy 2003; Burau and Blank 2006).
These and further studies partly concentrate on regulations that also affect patients’ access to health-
care services but do not explicitly focus on the question how access regulations might affect the utili- zation of healthcare services.
However, the focus in this study is not on modes of regulation but on specific regulatory mechanisms or instruments. According to Saltman and Busse (2002) these regulatory instruments are one of two dimensions in health sector regulation. On the one hand, there are the policy objectives that regulation is oriented at, such as equity and justice, economic efficiency and safety. On the other hand, there are
“the health sector management mechanisms” which describe “the specific regulatory mechanisms through which decision-makers seek to attain the type of policy objectives (Saltman and Busse 2002:
14). It is these more technical management mechanisms that are shown to influence the access of patients. Two crucial regulatory mechanisms which are assumed and shown to influence access to care are gatekeeping and cost sharing (Gervas et al. 1994; Groenewegen et al. 2002; Saltman and Busse 2002; Busse et al. 2006).
The outlined mechanisms gatekeeping and cost sharing operationalize the dimension of organization of the delivery system in Andersen’s behavioral model. The second dimension of the health delivery system is the resources which capture the supply of services. There is also substantial variation on the supply of healthcare providers among European countries (Wendt and Kohl 2008). The density of providers determines the availability of services for patients. Other aspects of availability are waiting time or average travel distance (Beech 2003). However, there are no comparative data available on these issues that would allow comparing countries. Thus, this study focuses on provider density as a measurement of the availability of resources.
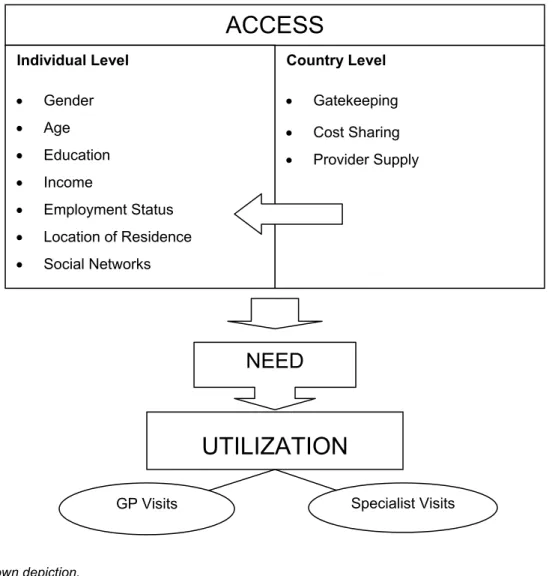
In the first section, it was explained that access should be differentiated from utilization of care. This is done in this study based on the considerations by Andersen (1995) that all enabling factors for the entry into the system refer to having access, while gaining access is operationalized by the use of professional healthcare. The theoretical model assumes a causal relationship between both con- structs: the more enabling factors exist the higher is the utilization of services. Utilization refers both to the frequency and type of care consumed. The focus is on the ambulatory sector, operationalized by the number of GP and specialist visits, because patients’ initiation is most important for these types of services compared to inpatient stays for instance.
As been outlined in the description of the Andersen model, the enabling factors which determine ac- cess exist on two levels. On the one hand, socio-demographic characteristics of the individual influ- ence whether people seek professional healthcare. On the other hand, access regulations and pro- vider supply on the macro-level determine the utilization of health services. Need is the proximate cause for utilization but the access variables moderate whether and which care is used. The focus in this study is on the effects of the institutional regulations on the level of healthcare utilization. More- over, the interaction between country level variables and socio-demographics such as income and education is examined in order to investigate whether equity systematically covaries with these access regulations.
Country Level
• Gatekeeping
• Cost Sharing
• Provider Supply
ACCESS
Individual Level
• Gender
• Age
• Education
• Income
• Employment Status
• Location of Residence
• Social Networks
NEED
UTILIZATION
GP Visits Specialist Visits
Figure 1: Theoretical explanatory model
Source: own depiction.
Institutional Characteristics of the Delivery System
In general, access restrictions are introduced because policy makers expect these to produce cost savings due to a more efficient utilization of resources. The existing lack of efficiency is attributed both to physicians’ initiation of diagnosis and treatment without additional health benefits and patients’
moral hazard behavior. Thus, access regulations can take either patients or providers as their starting point (Flynn et al. 2002). In this paper, we focus on regulatory instruments that try to influence patient behaviour either by legal restrictions such as gatekeeping or by financial incentives such as cost- sharing arrangements.
Gatekeeping
Regulating access through institutional arrangements is commonly known as gatekeeping or family doctors systems (Wendt and Thompson 2004). These arrangements are expected to have positive effects both on efficiency and quality of care due to the informational superiority of the physician com-
pared to the patient. First, it is assumed that by preventing unnecessary procedures utilization of ser- vices and, consequently, costs can be reduced. Second, gatekeepers ensure that patients get the appropriate care in the secondary care market because “GPs usually have better information than patients about the quality of care available from secondary care providers” (Scott 2000). Additionally, gatekeeping GPs coordinate treatments for different illnesses and thus help to prevent unintended interaction effects of different treatments (Pihl et al. 2005).
Although such hypotheses about the effects of gatekeeping on costs and utilization levels have re- mained quite influential, the existing evidence on these aspects provides inconsistent or even contro- versial results. Most of the studies about gatekeeping have been conducted in the U.S., where family doctor systems have been used in managed care arrangements for a long time. In a review of 19 U.S.
studies, Robinson and Steiner (1998) find that some studies show a decreasing, some an increasing and some no effect of gatekeeping on utilitzation. Looking at more recent literature supports the con- clusion of mixed results:
A study conducted by RAND reports higher numbers of total physician visits in a gatekeeper health maintenance organization (HMO) than in the less regulated point-of-service plan (PPO) and no signifi- cant differences with reference to specialist visits (Joyce et al. 2000). Schillinger and colleagues (2000), however, find no differences in primary care visits between people under gatekeeper ar- rangements and people with free access but a significant reduction in specialist visits and both inpa- tient and outpatient care after the introduction of gatekeeping for one group. A German study by Er- linghagen and Pihl (2005) finds more total doctor visits when people state to have a general practitio- ner they see regularly whereas a recent Swiss study (Schwenkglenks et al. 2006) reports a lower number of specialist visits under gatekeeping.
Whereas cross-national studies examining the effects of access regulations on the overall level of utilization are rare, the relation between utilization differences across socio-economic groups and healthcare system features have been extensively investigated by the equity literature, especially by the work of van Doorslaer and colleagues (2000; 2004; 2006). In several cross-sectional analyses of the European Community Household Panel and additional national household surveys, van Doorslear and colleagues have investigated inequities in care utilization between income groups. One general observation in all studies is that poorer people are more frequent users of medical services. This rela- tionship, however, disappears when controls for need are introduced because need or health status is unequally distributed over socio-economic groups. In line with this argument, we assume that both the analyses of utilization levels and within-country differences are only valid after controlling for health and other need variables. The general findings of the studies conducted by van Doorslaer and col- leagues is that GP visits are characterized by (slight) pro-poor inequity, specialist visits, however, show strong pro-rich inequity (van Doorslaer and Masseria 2004; van Doorslaer et al. 2006). Inequity in medical specialist visits is found in nearly all countries irrespective of healthcare system characteris- tics. In addition, they report that the main share of specialist inequity is found by analyzing whether people have seen a specialist at all and not in the conditional number of specialist visits. This brings
them to the conclusion that “inequity here is rather more patient-initiated than doctor-driven, although in countries with gatekeeping roles for GPs it may be GP-initiated. Notable exceptions to this rule are Austria and Denmark, where most of the inequity stems from the conditional number of positive visits”
(van Doorslaer and Masseria 2004).
Since the results by van Doorslaer and colleagues suggest that institutional characteristics have no or only modest effects on utilization levels of different income groups, in our analysis we will not only focus on income but also on education as well as on differences in the effect of health variables across countries. “Education” and “health status” have been selected for the following reasons: Many studies assume that institutional regulations automatically imply certain behaviors such as direct visit of specialists in countries with open access. However, the effect of these institutions is moderated by individual specific variables. It can be argued that for the use of specialist visits education should be crucial because the decision-making process for seeing a specialist includes a lot of knowledge and information seeking procedures in order to interpret conditions and decide upon the appropriate healthcare specialist. This means that higher educated people in countries with free access directly see a specialist more frequently because they feel competent to make their own decision about the appropriate care. Less educated people, on the other hand, might even in countries with no restricted access first visit a GP that takes responsibility for the decision-making process. In countries with re- stricted access, higher-educated people may still have more specialist visits because they can put more pressure on their GPs but the effect should be smaller than in the free access countries.
Access regulation should also create different utilization patterns of different health groups. Restrictive regulations intend to increase efficiency, in other words, reduce moral hazard behavior by denying (specialist) care to people without according need. This means that in countries with less restrictive regulations the difference in the probability of doctor visits of groups with different health status should be much smaller than in countries where strong regulations prevent healthy people from receiving extensive care. As a result, the effectiveness of access regulations cannot only be seen in a reduction of the overall utilization levels but more specifically in lower utilization levels of people in good health.
The previous considerations can be summarized with the following three hypotheses.
H1: The stronger gatekeeping is in a country the lower is the overall utilization level.
H2: The stronger gatekeeping is in a country the smaller are the differences in the utilization of spe- cialist care between groups of people with different levels of education.
H3: The stronger gatekeeping is in a country the lower are the differences in utilization between groups with different health status.
Cost Sharing
In general, cost sharing is defined as private payments by patients that “contribute to the cost of healthcare at the point of use” (Thomson and Mossialos 2004: 19). This is in contrast to insurance contributions which are paid independent of actual use (Holst 2007).
Table 1: Forms of cost sharing
Form Definition
Co-payment The user pays a fixed (small) fee (flat rate) per item or service.
Co-insurance The user pays a fixed or variable proportion of the total cost, with the insurer paying the remaining proportion.
Deductible The user pays a fixed quantity of the costs, with any excess borne by the insurer; deductibles can apply to specific cases or a period of time.
Source: (Thomson and Mossialos 2004: 19; Holst 2007: 24)
Both co-payments and co-insurance imply that for each service used a certain amount has to be paid. For co-payments this amount is fixed for a specific service such as 5 € per prescription while co- insurance specifies payment at a certain percentage. These two forms are dominant in European healthcare systems. The third type of cost sharing, the deductible, is exclusively used in Switzerland.
It means that people have to pay all healthcare costs up to a certain limit. In Switzerland the deducti- ble is 200 € and after it is exceeded a co-insurance rate of 10% applies (van Kemenade 2007). The effect of cost sharing depends not only on its level but also on whether it is covered by private insur- ance and the protection mechanisms installed. In Switzerland it is legally prohibited to cover cost- sharing by private insurance, ensuring that the effect on consumption is not undermined. In other countries, however, co-payments can be covered by private insurance (Tiemann 2006). In France and Belgium, for instance, where relatively high co-insurance rates apply, the main share of the population has private insurance, called “mutuelles”, that cover these extra costs (Couffinhal 2003)2. The effect of cost-sharing on consumption also depends on other protection mechanisms and exemptions. These are implemented in most healthcare systems to protect groups with specific risks such as the poor, the elderly or chronically ill persons. The protection can take the form of exemptions, reduced rates or annual payment caps.
The hypothesized effects of cost-sharing on patients’ consumption behavior are based on the notion of moral hazard, a concept developed in neoclassical economic theory. Moral hazard refers to the effect of insurance on consumption behavior of patients (Zweifel and Manning 2000), namely that it encour- ages utilization which “exceeds socially beneficial levels” (Thomson and Mossialos 2004: 20). Insur- ance is used here in the broader sense of having a third party who pays for consumed health services.
2 In France, about 85% of the population have private health insurance covering co-insurance of the public system. However, coverage of private insurance differs with employment status and income. In the working population for example, coverage is almost 90% while only 60% of the unemployed have private insurance (Couffinhal 2003).
This can be any type of insurance but also coverage by a national health system. For the individual, being covered by insurance creates a lower threshold for utilization because they do not have to pay for the consumed services. They might even not be aware of the price of the goods and services they consume (Breyer et al. 2005). In social insurance systems, the insured might also think that because they have paid their contributions, they should consume services to justify their expenses on health insurance. Through cost-sharing, prices are reintroduced in the third-party payer system, making peo- ple think more about utilization decisions, especially in cases of minor illnesses (Thomson and Mos- sialos 2004; De Graeve et al. 2006). This is supposed to encourage more restrictive use of care result- ing in lower levels of utilization.
Evidence on the effects of cost-sharing abounds but remains unsatisfactory because the studies are hardly comparable (due to different insurance arrangements, time horizons and estimation methods) and contain several methodological problems. Since existing evidence has been reviewed several times, in this section only some of the most recent reviews of the effects of cost-sharing are dis- cussed.
The reference point of all reviews about cost sharing is still the RAND Health Insurance Experiment which was conducted from 1974 to 1982 in the U.S. Its significance is due to the fact that it has been the only large-scale randomized experiment ever conducted: 6,000 people were randomly assigned to insurance plans with different cost sharing regulations. The main result of this study is “that the use of medical care declines as patient cost sharing increases“ (Louckx 2002: 190). This reductive effect of cost-sharing was confirmed by almost all previous and subsequent studies, irrespective of the ar- rangement and country the studies were conducted (Cherkin et al. 1989; Rice and Morrison 1994;
Zweifel and Manning 2000; Robinson 2002; Thomson and Mossialos 2004; De Graeve et al. 2006;
Holst 2007). While the effectiveness of cost sharing in terms of simply reducing the number of visits is widely seen as a proven fact, there is much less consensus on the question how cost sharing affects health and whether its effects differ between different types of services, services with different neces- sity, different income groups and groups with different health status.
Efficiency
As was hypothesized in the theoretical disquisition on cost sharing, micro-efficiency would imply that utilization for less adequate or necessary services decreases more than utilization of necessary diag- nosis and treatment. The RAND study shows that cost sharing reduces both the utilization of inappro- priate as well as appropriate care, including preventive services (Robinson 2002). This result casts doubt on the idea of increased micro-efficiency of cost-sharing. Up to now, no study has shown that this reduction of health services transforms into reduced health. According to results from the RAND health experiment, there are no differences between groups with different insurance arrangements for most health measures except for “diastolic blood pressure, corrected vision and the risk of dying for those who were at elevated risk” (Rice and Morrison 1994: 244). RAND excluded people over 65 and the short duration of the study (five years) thus delimiting the efficiency of modeling on long-term
health effects, especially for the elderly and the chronically-ill cannot be estimated (Rice and Morrison 1994; Holst 2007). If there was a deteriorating effect on health, the expectation of macro-efficiency or long-term cost-savings of cost sharing might also be questionable.
In terms of inequity, the majority of the studies found that poor people reduced their utilization of ser- vices significantly more than the rest of the population (Rice and Morrison 1994; Zweifel and Manning 2000; Thomson and Mossialos 2004). The effect depends both on the coinsurance rate/level of co- payment and existing protective instruments (Thomson and Mossialos 2004). A second group that seems to be disproportionally burdened are the sick or chronically ill. Several studies demonstrate that high users and people with low health status decrease their service use more than others (Cherkin et al. 1989; Zweifel and Manning 2000; De Graeve et al. 2006).
While nobody challenges the fact that cost sharing reduces utilization, many scholars are concerned about unintended effects. These can be as potential decreases in health due to non-received preven- tive and curative services or increasing inequity due to the disproportionally high burden of lower- income people and the chronically ill. Finally, scholars argue that the high administrative costs of user charges might neutralize existing cost-savings (Robinson 2002; Thomson and Mossialos 2004; Wendt 2006; Holst 2007).
Although it was stated in the previous section that the ability to pay is less important in European countries, cost sharing qualifies or challenges this assumption of universal access for certain coun- tries. Where cost sharing plays an important role, income might reemerge as a significant influence factor of healthcare use.
H4: The higher cost sharing is in a country, the lower is the overall level of utilization.
H5: The higher cost sharing is in a country, the higher is utilization inequality between income groups.
Institutional Indicators
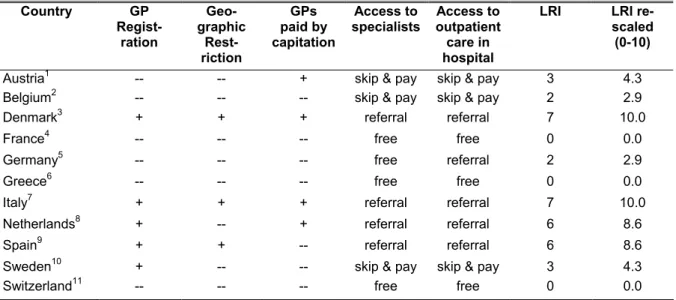
While gatekeeping is often measured as a dichotomous variable the definitions already indicated that gatekeeping can be implemented to different degrees. This is why in this paper an index is used as a continuous measure where each country can be located at based on the extent of access regulation (see Table 2). According to Wasem and colleagues (2003), gatekeeping exists when three necessary characteristics are present: First, people have to register with a GP for a certain amount of time. Sec- ond, the payment system of physicians is based on capitation, and third secondary care can only be accessed with a GP referral.
The first component “registration with a GP” captures whether people are forced to set their choice of general practitioner for a certain period of time. This indicator is one of the constitutive elements of
“gatekeeping” which has been widely used in previous studies for assessing access regulations (e.g.
Gervas et al. 1994; Ettelt et al. 2006; Wendt and Kohl 2008). Registering with a GP transfers respon-
sibility for the coordinating function to a specific agent and prevents at the same time that people ob- tain a second opinion, a phenomenon described as “doctor shopping” (Saltman 1994)3. In their policy brief of the European Observatory, Ettelt and colleagues (2006) demonstrate that the restrictiveness of GP registration depends on whether there is a defined area in which the GP has to be chosen. As shown in table 1, countries which do not have GP restrictions also do not restrict the area of choice.
The combination of GP registration and limitation of geographic area is found in Denmark, Italy, and Spain, which can be defined as the “pure gatekeeping types”. The Dutch gatekeeping system and the Swedish modified gatekeeping system that is heavily based on financial incentives do not restrict choice geographically.
The second of Wasem’s components relates to the payment by capitation. Under capitation schemes, doctors receive a fixed amount for each patient on their list independent of services provided. This type of payment is most often used for gatekeepers because “it motivates doctors to practice in a way that encourages patients to join their list” (Or 2000: 16).
The last characteristic of gatekeeping according to Wasem and colleagues (2003) reflects the control of access to the secondary care market which includes specialists in private practices and health cen- ters as well as specialists working in hospital outpatient departments4. Access to specialists can be regulated in three ways. The most restrictive option is that patients need a referral in order to access secondary care. In this case, there are no legal alternatives to see a specialist without a referral or paying the whole fee out of pocket5. In some countries, people can use a referral but also skip the referral system by accepting a higher co-payment (Ettelt et al. 2006). This procedure is established in Austria, Belgium, and Sweden. While in Austria the specialist visit is free when referred, in Sweden and Belgium a higher than the regular co-payment is charged when people skip the referral system. In Sweden for example people pay 24 € for a specialist visit without a referral but only 13 € when being referred. These “additional co-payments” have to be distinguished from the usual cost sharing ar- rangements which are not tied to referral systems. These are discussed in the next chapter. The least restrictive pole on this indicator is represented by France and Switzerland where people have free (in the sense of not-referral based) access to specialist care.
For introducing these indicators into the statistical analysis, an additive sum index was created that indicates the extent to which gatekeeping has been established. Since the legal regulation index (LRI) is later combined and compared to the cost sharing index, it is used in a rescaled form that ranges
3 How much GP registration restricts patients’ freedom also depends on other factors such as the duration of registration and the regulations for the case people want to switch their GP. Collecting this information in a systematic way for all countries, however, was not possible.
4 Access to inpatient care was not included for two reasons. First, hospital stays are not used as a dependent variable and secondly, irrespective of system type in all countries direct entrance to inpatient care, except for cases of emergency, is restricted. This indicator would therefore show no variance across countries.
5 De facto, there are alternatives in some of these countries. In Spain, for example, many people enter care through the emergency entrance of hospitals because waiting times for specialist visits take very long (Rico and Sabes 2000). Unfortunately, the quantitative importance of these attempts to bypass the regular system is not sufficiently documented and therefore it could not be included in the analysis.
from 0 to 10, shown in the last column. The LRI shows that there is considerable variance in the re- strictiveness of the system beyond the gatekeeper system dichotomy that has formerly been used.
Table 2: Legal Regulation Index Country GP
Regist- ration
Geo- graphic
Rest- riction
GPs paid by capitation
Access to specialists
Access to outpatient care in hospital
LRI LRI re-
scaled (0-10) Austria1 -- -- + skip & pay skip & pay 3 4.3 Belgium2 -- -- -- skip & pay skip & pay 2 2.9
Denmark3 + + + referral referral 7 10.0
France4 -- -- -- free free 0 0.0
Germany5 -- -- -- free referral 2 2.9
Greece6 -- -- -- free free 0 0.0
Italy7 + + + referral referral 7 10.0
Netherlands8 + -- + referral referral 6 8.6
Spain9 + + -- referral referral 6 8.6
Sweden10 + -- -- skip & pay skip & pay 3 4.3
Switzerland11 -- -- -- free free 0 0.0
Note: Coding for index construction -- = 0; + = 1; free = 0; skip & pay =1; referral = 2.
Sources: 1(Hofmarcher and Rack 2001; Hofmarcher 2003; Rosian et al. 2003; Schneider et al. 2004); 2(Kerr and Siebrand 2000); 3(Vallgarda et al. 2001); 4(Or 2002; Sandier et al. 2004); (Alber and Bernardi-Schenkluhn 1992);
5(Alber and Bernardi-Schenkluhn 1992; Busse and Riesberg 2000; Bundesausschuss der Ärzte und Krankenkas- sen 2003; Rosenbrock and Gerlinger 2006); 6(Tragakes and Polyzos 1996; Davaki and Mossialos 2006);
7(Hohmann 1998; Donatini et al. 2001); 8(den Exter et al. 2004; Ettelt et al. 2006; Tiemann 2006); 9(Rico et al.
2000), 10(Hjortsberg and Ghatnekar 2001; Tiemann 2006); 11(Minder et al. 2000)
Cost sharing has been considered a central institutional feature which shapes patients’ access and provides an explanation for cross-national differences in equity of care (Thomson and Mossialos 2004). However, previous work did not go beyond the comparative description of cost sharing ar- rangements in Europe (Ros et al. 2000; Robinson 2002; OECD 2004). The regulations are usually presented in a country specific way (e.g. fixed amounts in case of co-payment, percentage in case of cost-sharing) without taking into account different validation periods and application criteria. However, on this basis the financial burden patients’ face cannot be compared across countries. Using cost sharing as an explanatory factor, as intended in this study, requires instead a single well-defined measurement on which all countries can be located. A financial incentive indicator is proposed which combines information on out-of-pocket payments, cost sharing as well as protection mechanisms.
The indicators used by previous studies are cost sharing of GP visits, of specialist visits, of pharma- ceuticals, of inpatient care and of dental care (Ros et al. 2000; Robinson 2002; OECD 2004; Thomson and Mossialos 2004). For our analyses, we chose only two of these indicators, cost sharing of GP and specialist visits, because they have the most direct effect on the number of doctor visits (including both GP and specialist visits). When people consider seeing a doctor, they are aware that these costs ap- ply with absolute certainty. Consequently, these costs can be considered to have an impact on pa- tients’ decision-making.
The purpose of collecting these indicators is to develop an index which reflects the financial strain that results from cost sharing arrangements. The index is to be created in a way that all countries can be assigned a specific position on it. Therefore, we tried to obtain, if possible, the absolute value that people pay for a doctor visit. In order develop a uniform measurement for cost sharing these absolute values had to be transformed into a different scale due to the following reasons. First, the amount does not adequately reflect the qualitatively important difference between having a co-payment and not having a co-payment. For instance, the difference between 0 and 3 Euro is much more significant than the one between 3 Euro and 6 Euro. The first difference determines whether actual use of care is connected with costs for the patient or available free of charge while the second difference is only a difference in the amount to be paid. The second reason is that for Switzerland and Italy an average amount could only be approximated. Finally, the absolute amounts for one doctor visit can be mislead- ing because they do not take the different periods of validation and the effects of cost sharing maxi- mums into account. In Austria, for instance, an initial charge of 3.63 Euros is paid at the first doctor visit but this voucher is valid for one quarter of the year (independent of the number of visits) as op- posed to Belgium where 4.54 Euros are charged for each visit. Sweden, on the other hand, has an arrangement where co-payments for doctor visits are relatively high but combined with a low out-of- pocket cap that is reached after very few visits.
The strategy chosen for incorporating this complexity in the index was to develop two theoretical sce- narios for each indicator. These scenarios are supposed to capture the impact of cost sharing on both persons with only few visits (“low user”) and people with a high frequency of visits (“high user”). The low user scenario reflects the costs incurring at the first visit, the high user scenario is set at 10 GP and 5 specialist visits.
Even though it is possible to work just with these four scores, it might result in a misleading interpreta- tion of the differences between countries when the protection mechanisms are not taken into account (Mossialos and Thomson 2003). However, only Ros and colleagues (2000) collected information on exemption rules for the poor, the chronically ill, older people as well as on co-payment ceilings. The idea behind the collection of these indicators is that the impact of cost-sharing is reduced the more protection mechanisms are installed. In order to model this, a protection index was created which is used as a weight for the cost-sharing index scores. The score ranges from 0 to 1.
The final financial incentive indicator is now created by using the scores for the four scenarios, the weight constituted by the protection index, and the out-of-pocket payments per capita. The general logic of the index construction is addition. All indicators are scaled from 0 to 2 so that they represent equal shares in the index. The effects of cost-sharing depend highly on the exemptions and other pro- tection mechanisms installed. In a country such as Italy, where in most provinces the poor, chronically ill and older people are exempt from cost sharing, looking only at the institutional scores would overes- timate the average financial strain resulting from the arrangement. Therefore, the index created by adding the scores for the four scenarios is weighted by multiplying it with the protection index. Illus-
trated on the Italy example, two zeros and two twos are added up to 4.0 which is multiplied by 0.6 resulting in 2.4 (see Table 3).
As a final step the out-of-pocket payments (OOP) per capita are added. For this procedure OOPs were also rescaled to a range from 0 to 2. This was done under the assumption that Switzerland should receive the maximum value. The according transformation rule is therefore to divide the origi- nal OOP-value by 1,000 and then to multiply the resulting value by 1.27. The out-of-pocket payments are not weighted since the effects of the protection mechanisms are already included in this aggregate measure which reflects the quantitative effect of all regulations. The mathematical rule for the index creation can consequently be written as:
FII = [(GP1 + GP10 + SP1 + SP5)*Weight] + OOP Table 3: Creation of Financial Incentive Index (FII)
Country GP 1 Score
GP 10 Score
SP 1 Score
SP 5 Score
Protection Index (Weight)
Out-of- Pocket Payments
(OOP)
Financial Incentive Index
(FII)
FII re- scaled
(0-10)
Austria1 1 1 1 1 0.7 0.70 3.5 4.2
Belgium2 1 1.2 1.0 1.1 0.7 0.90 3.9 4.6
Denmark3 0 0 0 0 0.5 0.69 0.7 0.8
France4 1.1 1.2 1.1 1.1 0.7 0.30 3.5 4.2
Germany5 0 0 0 0 0.5 0.48 0.5 0.6
Greece6 0 0 0 0 0.5 0.92 0.9 1.1
Italy7 0 0 2 2 0.6 0.62 3.0 3.6
Nether- lands8
0 0 0 0 0.5 0.30 0.3 0.4
Spain9 0 0 0 0 0.5 0.50 0.5 0.6
Sweden10 1.4 1.4 1.4 1.3 0.8 0.54 4.9 5.8
Switzer- land11
2 2 2 2 0.8 2.00 8.4 10.0
Sources: 1(Hauptverband der Österreichischen Sozialversicherungsträger 2003; Schneider et al. 2004; Hofmar- cher and Rack 2006), 2(Kerr and Siebrand 2000; Schneider et al. 2004; De Graeve et al. 2006), 3(Vallgarda et al.
2001), 4(Couffinhal 2003; Schneider et al. 2004), 5(Schneider et al. 2004; Pfaff and Kern 2005), 6(Tragakes and Polyzos 1996; OECD 2004), 7(Hohmann 1998; Donatini et al. 2001; Giannoni-Mazzi 2003), 8(den Exter et al.
2004; Tiemann 2006), 9(Rico et al. 2000), 10(Anell and Svensson 1999; Schneider et al. 2004; Tiemann 2006),
11(Minder et al. 2000; van Kemenade 2007).
Since we hypothesized that cost sharing and gatekeeping could have similar effects on the overall level of utilization they might work as functional equivalents. In Denmark and the Netherlands, for in- stance, the design of the legal gatekeeping systems is supposed to reduce the consumption of spe- cialist care. However, high co-payments for specialist visits as they are established in Switzerland or Sweden could have the same effect. Consequently, a measurement that is able to explain most of the variance across countries should include both types of regulations. Therefore a regulation index (RI) was created by adding the legal regulation index and the financial incentive index in their rescaled version with a range from 0 to 10 (see table 4).
RI = FII + LRI
Table 4: Creation of Regulation Index (RI) Country FII rescaled
(0-10) LRI rescaled
(0-10) Regulation Index (RI)
Austria 4.2 4.3 8.5
Belgium 4.6 2.9 7.5
Denmark 0.8 10.0 10.8
France 4.2 0.0 4.2
Germany 0.6 2.9 3.5
Greece 1.1 0.0 1.1
Italy 3.6 10.0 13.6
Netherlands 0.4 8.6 8.9
Spain 0.6 8.6 9.2
Sweden 5.8 4.3 10.1
Switzerland 10.0 0.0 10.0
The respective hypothesis for the regulation index is then:
H5: The higher overall degree of access regulation the lower is the overall utilization level.
Figure 2 gives an overview how the countries score on these indices. We can see that to some extent there is an inverse relationship between gatekeeping and cost sharing. In some countries such as Denmark, Spain and the Netherlands access regulation almost exclusively relies on gatekeeping ar- rangements while in Switzerland and France regulation is formed only by financial incentives. Austria, Belgium, Italy and Sweden have a mix of gatekeeping regulations and cost sharing. They could be called modified gatekeeping systems because they mix legally free access to specialists with financial incentives to first see a GP. Overall, the countries with the highest level of regulation are Italy, Den- mark, Sweden and Switzerland while Greece, Germany and France build the bottom end. The strong- est gatekeeping countries are Denmark, Italy, Spain and the Netherlands while the countries with the highest cost sharing levels are Switzerland, Sweden and Belgium. Greece has an exceptionally low level of regulation, however, access to care is restricted by ways that are not covered by these indica- tors such as informal payments (Davaki and Mossialos 2006).
Figure 2: Overview of regulation indices by country
0 2 4 6 8 10 12 14
Austria Belgium
Denmark France
Germany
Greece Italy Netherlands
Spain Sweden
Switzerland
Regulation Index (RI) Legal Regulation Index (LRI) Financial Incentive Index (FII)
Source: own data.
Data and Method
Data
The data that we use for analyzing utilization is the first wave of the Survey of Health, Ageing and Retirement in Europe (SHARE) which was carried out between April and October 20046. The survey contains valid information, for the purposes of this paper, on 11 European countries and Israel7. The population that is covered by SHARE is people over 50 and their partners who were interviewed inde- pendent of their age. As we are interested in inferences to a population of older individuals, we re- stricted our analysis sample to people aged 50 and older which means that all partners being younger have been excluded (N = 26,808). Table 5 shows the number of respondents per country for our analysis sample which ranges from 908 in Switzerland to 3639 in Belgium.
Table 5: SHARE 2004, sample size by country Country N
Austria 1,825 Belgium 3,639 Denmark 1,583 France 2,905 Germany 2,894 Greece 2,625 Italy 2,463 Netherlands 2,772 Spain 2,274 Sweden 2,920 Switzerland 908
Total 26,808
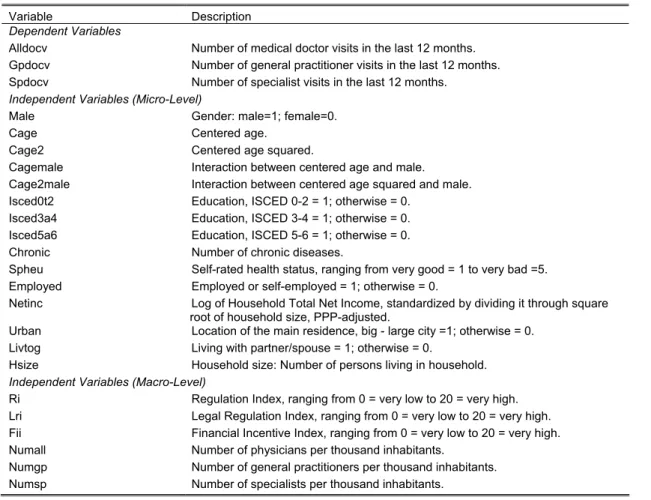
Variables
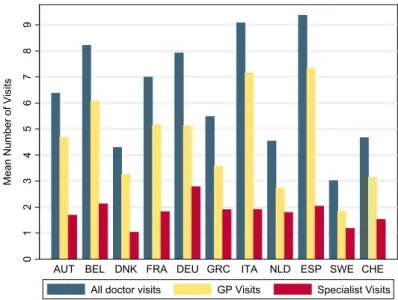
Table 6 gives information about the variables used in the following analysis. As dependent variables we used the number of total doctor visits, the number of GP visits and the number of specialist visits.
Measurement of annual medical doctor utilization was based on the question “When you think about
6 The SHARE data collection has been primarily funded by the European Commission through the 5th frame- work programme (project QLK6-CT-2001- 00360 in the thematic programme Quality of Life). Additional fund- ing came from the U.S. National Institute on Ageing (U01 AG09740-13S2, P01 AG005842, P01 AG08291, P30 AG12815, Y1-AG-4553-01 and OGHA 04-064). Data collection for wave 1 was nationally funded in Aus- tria (through the Austrian Science Foundation, FWF), Belgium (through the Belgian Science Policy Office), France (through CNAM, CNAV, COR, Drees, Dares, Caisse des Dépôts et Consignations et le Commissariat Général du Plan) and Switzerland (through BBW/OFES/UFES. The SHARE data collection in Israel was funded by the U.S. National Institute on Aging (R21 AG025169), by the German-Israeli Foundation for Scien- tific Research and Development (G.I.F.), and by the National Insurance Institute of Israel. Further support by the European Commission through the 6th framework program (projects SHARE-I3, RII-CT- 2006-062193, and COMPARE, CIT5-CT-2005-028857) is gratefully acknowledged. For methodological details see Boersch- Supan and Juerges (2005).
For an overview over the survey contents, see Börsch-Supan et al. 2005. This document and further informa- tion is available from the website http://www.share-project.org/.
7 Israel was excluded from the analysis due to lack of available institutional indicators.
your care during the last twelve months about how many times in total have you seen or talked to a medical doctor about your health? Please exclude dentist visits and hospital stays, but include emer- gency room or outpatient clinic visits.“ The following question specified the number of GP visits: “How many of these contacts were with a general practitioner or with a doctor at your healthcare center?“.
The number of specialist visits is not directly measured by the survey. We subtracted the number of GP visits from the total number of doctor visits and used the residual as number of specialist visits.
This procedure certainly increased the measurement error but was the only way for us to include number of specialist visits in our analysis.
Table 6: Description of Variables Used in Analysis.
Variable Description Dependent Variables
Alldocv Number of medical doctor visits in the last 12 months.
Gpdocv Number of general practitioner visits in the last 12 months.
Spdocv Number of specialist visits in the last 12 months.
Independent Variables (Micro-Level)
Male Gender: male=1; female=0.
Cage Centered age.
Cage2 Centered age squared.
Cagemale Interaction between centered age and male.
Cage2male Interaction between centered age squared and male.
Isced0t2 Education, ISCED 0-2 = 1; otherwise = 0.
Isced3a4 Education, ISCED 3-4 = 1; otherwise = 0.
Isced5a6 Education, ISCED 5-6 = 1; otherwise = 0.
Chronic Number of chronic diseases.
Spheu Self-rated health status, ranging from very good = 1 to very bad =5.
Employed Employed or self-employed = 1; otherwise = 0.
Netinc Log of Household Total Net Income, standardized by dividing it through square root of household size, PPP-adjusted.
Urban Location of the main residence, big - large city =1; otherwise = 0.
Livtog Living with partner/spouse = 1; otherwise = 0.
Hsize Household size: Number of persons living in household.
Independent Variables (Macro-Level)
Ri Regulation Index, ranging from 0 = very low to 20 = very high.
Lri Legal Regulation Index, ranging from 0 = very low to 20 = very high.
Fii Financial Incentive Index, ranging from 0 = very low to 20 = very high.
Numall Number of physicians per thousand inhabitants.
Numgp Number of general practitioners per thousand inhabitants.
Numsp Number of specialists per thousand inhabitants.
Variation in the number of physician visits is explained using need variables such as self-rated health, age, etc and other factors that influence the availability, e.g. urban. The variables of interest to assess differences in equity are education which was operationalized by the ISCED coding, income and health status. Due to no or very few observations in certain categories of the ISCED variable in some of the countries, we collapsed several categories into three dummies. The first dummy includes the ISCED-Groups 0, 1 and 2 which represent pre-primary, primary and lower secondary education. In the analysis, they are used as the reference groups. Isced3a4 contains people with a maximum level of upper secondary and post-secondary but not-tertiary education. The latter category consists of several options such as evening schools and vocational training. The people with a university or other college degree and Ph.Ds are included in Isced5a6.
As income measure we use an imputed variable of Household’s Total Gross Income provided by SHARE and transformed this into net income by subtracting an average income tax valued and social security contributions by household type8. This variable has been PPP-adjusted, standardized by di- viding through the square root of the household size and log transformed to achieve a normal distribu- tion. To assess differences between groups of different health statuses, we use the number of chronic diseases as an objective health measure and additionally self-rated health which is measured on a 5 point-scale.
The following variables were introduced as controls. For gender and age we used different specifica- tions in the logit and negative binomial models. In the logit models we include centered age measured in years, a gender dummy on the interaction term of both variables, for the negative binomials we added age2 and the according interaction term9. Furthermore, we included a variable that differenti- ates between people who are employed or self-employed and people who are not employed (including the unemployed, homemakers, people who are permanently sick or disabled and retirees). Urban is used as a measure of regional inequality. Persons are coded 1 when they live in a big or large city, otherwise they got 0. Finally, we included two variables about the living arrangements of the respon- dents. First, the dummy livtog indicates whether people live with a partner/spouse or as a single.
Household size refers to the number of persons living in the household.
Method
Distributions of the number of doctor visits are usually characterized by overdispersion10 which makes the application of simple poisson models impossible (Jones 2000). The most widely used solution to this problem in doctor utilization research is the application of a two-step estimation procedure (Mullahy 1986; Pohlmeier and Ulrich 1995). This so-called hurdle model estimates in a first step whether people have any or no doctor visit and in a second step the number of doctor visits for the people with at least one visit. In this paper, we combined a logit model and a zero-truncated negative binomial. This is done by the application of a hurdle model. The probability of a zero is given by11:
i i x i
x i
i
y x
e x e
y
iiγ γ
= = = π
= +
= Pr 0
0 1
Pr
( )) (
i = individual
8 We would like to thank Omar Paccagnella for providing us with the code for this procedure.
9 For the specification of age, separate models were run for each of the six dependent variables for each of the eleven countries with six different age gender specifications: (1) gender, age (2) gender, age, gender*age (3) gender, age, age2 (4) gender, age, gender*age, age2, gender*age2 (5) age dummies (50-59,60-69,70-79, older as reference category) (6) age dummies + interactions of dummies with gender. Based on likelihood- ratio-tests, AIC and BIC statistics the solution that worked best for the majority of countries was chosen. How- ever, there were differences in the suitability of these specifications for each country which means that the comparability across countries decreases in some cases the parsimony of the model while in other cases the actual functional relationship is not captured.
10 Overdispersion means that the variance exceeds the mean. This is a precondition for using a poisson distribu- tion where equidispersion of mean and variance is assumed (Long and Freese 2006).
11 In the analyses, we changed the coding for the outcome variable from predicting a zero to predicting not hav- ing a zero (having any visit) for making interpretation clearer.