HYDROGRAPHISCHE NACHRICHTEN
Fachzeitschrift für Hydrographie und Geoinformation 02/2015 HN 100
First International Issue
Hydrography made in Germany
• Bathymetry of Lake Constance
• Extensive sheet pile wall inspection in the Port of Hamburg
• Disputed boundary in the Ems-Dollart estuary
• Peter Ehlers: »In development aid Germany
should adopt a leading role«
Editorial
Dear readers,
Hydrographische Nachrichten is usually published in German; however, I presume that your job de- mands occasional or even daily communication in English with colleagues from all over the world.
Not surprisingly, as the waters we survey are often between countries or even continents and do not know any language barriers. Therefore, this current edition is published entirely in English. You may find it strange at first, but I am sure, you will enjoy it from the very beginning.
Already in the Middle Ages there existed a com- mon working language in seafaring: the so-called lingua franca. People communicated predomi- nantly in Italian with a medley of French, Greek, Arab and Spanish. Fortunately, nowadays there is only one foreign language. English has become the lingua franca in science and technology.
We notice this especially in professional publica- tions. You need to write in English if you want to be read and understood worldwide, or you publish an article right away in an English speaking journal.
During the past years Hydrographische Nachrichten has been presenting some articles in English. Most of them were written by German native speakers, others were contributions by authors from abroad, whose feedback sometimes was: »I wish I could read the rest of your journal.«
So here we go. We are proud to present our first
»International Issue« of Hydrographische Nachrich- ten completely in English. This premiere is at the same time the hundredth edition of our journal, which the German Hydrographic Society has been
publishing for more than 30 years now. We want to celebrate this anniversary with the most compre- hensive and highest-circulation edition ever.
On more than 60 pages you will find exclusively high-quality articles by authors who work and research in Germany. However, thematically we don’t focus on national topics, we rather want to present the wide spectrum and performance of hydrography made in Germany. You will find a lot of Germany in this issue, but also articles about the rest of the world, which we are part of. Although the starting point are German inland waters (Lake Constance, Hamburg Port) we will also look at the frontier relationship with the Netherlands at the Ems, go on to the world oceans and finally land in Micronesia.
We hope that the topics of this edition are of interest not only for our new international readers but also for the German readers. They will have the chance to discover the articles in a different con- text and in a more or less foreign language.
I hope you enjoy the inspiring and informative articles of this anniversary issue. And don’t worry!
The next edition of Hydrographische Nachrichten in June 2015 will again be in German.
Yours,
Lars Schiller
L i - I o n B a t t e r i e s
• Highest capacity
• Easy smart charging
• Maintenance-free
C o n d i t i o n M o n i t o r i n g
• ROV Sensor-packs
• Mari- & Aquaculture
• Offshore Oil+Gas
p C O 2 A n a l y z e r
• Li-COR ® integrated
• Automatic calibration
• FerryBox, Buoy, Deep-sea
approved vendor
pCO
2Analyzer
FerryBox
ROV Sensors
AUV Batteries
Battery Systems
Ocean Engineering
Wir gratulieren zur
100. Ausgabe !
Table of contents
First International Issue
Hydrography made in Germany
Kongsberg EM 2040 multibeam echo sounder and LiDAR point cloud
0 m -5 m
-15 m -20 m -10 m 10 m
height over
NHN
5 m
50 m 100 m 150 m 200 m 250 m 300 m 350 m 400 m 450 m
Kongsberg Mesotech 1171 series imaging sonar and LiDAR mosaic
0 m -5 m
-15 m -20 m -10 m 10 m
height over
NHN
5 m
50 m 100 m 150 m 200 m 250 m 300 m 350 m 400 m 450 m
Derived sketch from multibeam and imaging data showing features of interest
50 m 100 m 150 m 200 m 250 m 300 m 350 m 400 m 450 m
Pos. 11 362m Pos. 10 229 m
Pos. 1 47,5m Pos. 2 63.5 m Pos. 3 77 m Pos. 4 120 m Pos. 5 144 m Pos. 6 162 m Pos. 7 190 m Pos. 8 206 m Pos. 9 224 m
0 m -5 m
-15 m -20 m -10 m 10 m
height over
NHN
5 m
1 2 3 4 5 6 7 8 9 10 11 12 13 14 15 16 17 18
KM Embient and KM Mesotech
Key Wall Inspection 2014 - The Full Picture
Surveying of inland waters
6 Bathymetry of Lake Constance State-of-the-art in surveying a large lake An article by MArtiN Wessels et al.
Underwater inspection and monitoring 12 Extensive sheet pile wall inspection
in the Port of Hamburg An article by isAbell Mücke
Applied research
16 How deep is deep enough?
Anchor penetration tests in the German Bight to optimise burial depth for subsea power cables An article by cHristiAN MAusHAke
Boundary negotiations 20 Ems-Dollart estuary
Did Germany and the Netherlands really agree on the disputed boundary recently?
An article by tHoMAs deHliNG Project and geodata management
24 Big Data
The challenges of large-area bathymetric surveys An article by klAus MicHels
Software solutions
29 Hydrographic applications on a Mac Public domain software solutions An article by HArtMut Pietrek
Automatic object detection
32 Modern multibeam technology Beyond accurate depth measurements
An article by Peter GiMPel and cHristiAN ZWANZiG
Interview
36 »In development aid Germany should adopt a leading role«
An academic discussion with Peter eHlers
Conference report 42 HYDRO 14
Energy & Enterprise in Aberdeen
A report by HolGer kliNdt and iAN HoldeN
Literature
46 Flight into freedom A review by lArs scHiller
History of port surveying
48 The evolution of the Port of Hamburg from a hydrographic perspective
An article by FrANk köster and tHoMAs tHies
History of navigation
54 New perspectives on indigenous navigation tradition
An article by iNGo HeNNiNGs
Philosophy of hydrography
59 What exactly is hydrography?
The IHO delivers an abstract definition only.
It is high time for more graphicness An essay by lArs scHiller
The next issue of Hydrographische Nachrichten will be published in June 2015.
Editorial deadline: 15 May 2015 Advertising deadline: 15 May 2015
Surveying of inland waters
Bathymetry of Lake Constance
An article by MArTIn WESSELS and FLAvIo AnSELMETTI,1 roBErTo ArTUSo,2 rAMonA BArAn,3 GErHArd dAUT,4 ALAIn GEIGEr,5 STEFAn GESSLEr,6 MICHAEL HILBE,1 KArIn MöST,7 BErTHoLd KLAUSEr,8 STEFFEn nIEMAnn,1 roBErT roSCHLAUB,7 FrAnK STEInBACHEr,3 PAUL WInTErSTELLEr,9 ErnST ZAHn10
Lake Constance | Tiefenschärfe | IGKB | lake level | geoid | groundwater intrusions | megaripples | pockmarks
Authors
Dr. Martin Wessels is head of the department
»Sedimentology and Lake Physics« at the Institute for Lake Research in Langenargen which is part of the
Landesanstalt für Umwelt, Messungen und Naturschutz Baden-Württemberg (LUBW) martin.wessels@lubw.bwl.de
In 2014 the by far largest German lake has been newly surveyed. The transnational project is funded by the European Union and delivers a detailed 3D-model of the lake- floor. The German project name is »Tiefenschärfe – Hochauflösende Vermessung Bo- densee«, which in English roughly means: high-resolution survey of Lake Constance.
The German term »Tiefenschärfe« (in optics and photography: depth of field) plays with the meanings of »Tiefe« (depth) and »Schärfe« (sharpness). The result of the sur- vey shall be a clear and
sharp image of the deep and shallow lake- floor. At present the LiDAR and multibeam data are still processed, but first results are pre- sented in this article.
Protection of Lake Constance (IGKB) in 1959 by the member states of Baden-Württemberg, Bavaria, Austria and Switzerland. After a maximum degree of eutrophication in 1980, the lake has recovered and returned to an oligotrophic state with low nu- trients and declining fish yields. Today, the lake is regarded as one of the best studied lakes world- wide and supplies drinking water for about five million people. Independent of this successful re- oligotrophication, Lake Constance remains an eco- system with multiple stressors and conflicts (e.g.
intense leisure activities, ca 55,000 boats, a large diving community, rich archeological history (pile dwellings are UNESCO cultural heritage), use and restoration of shore lines, commercial fisheries, mi- cropollutants, use of thermal energy, etc.), which now are the main tasks for the IGKB.
Historical aspects in yielding bathymetric information
Lake Constance may act as an example for the long term development in bathymetric data, as al- ready in 1825/26 Captain Gasser from the kingdom of Baden made a first bathymetric survey to de- scribe the lake. He used a metal wire to measure 17 profiles crossing the lake. More than 11,000 meas- urements (20 measures/km²) using ›bob plumb- ing‹ then were acquired between 1889 and 1891 (Zeppelin 1893, Hörnlimann 1893). The resulting
»Zeppelin-map« was thereafter used as the basis for intensified research (Earl Eberhard Zeppelin is the brother of the constructor of the airship). As in 1900, the mouth of the Rhine river was artificially shifted 12 km to the east to avoid floodings in the Alpine Rhine valley (Wessels 1998), the construc- tion management office for the Rhine River con- ducted a survey of the Rhine River delta since 1911 every ten years. Initially, mechanic bob plumbings were used along horizontally stretched wires, while later on, hydroacoustic systems, theodolites (e.g. Waibel 1971) and GPS were introduced when available.
Introduction
Large institutions handling hydrographic informa- tion and companies developing tools in collecting and processing bathymetric data have a strong fo- cus on marine environments. Nevertheless, there is a long tradition in collecting bathymetric infor- mation from inland waters, such as Alpine lakes.
With this contribution, we present technical details and results of a state-of-the-art bathymetric survey of Lake Constance showing a number of specific aspects relevant for future surveys of other large lakes.
Lake Constance
Lake Constance (9°30’ E, 47°30’ N) is a large (536 km²) and deep (254 m) lake with ~50 km³ of water volume and a theoretical residence time of approximately 4.5 years. The lake has a catchment area of 11,500 km², mainly located in the Alps and its foreland. The main tributary is the Alpine River Rhine (mean annual discharge of 7.66 km³), which contributes ~64 % of the total average inflow (Gil- fedder et al. 2010) and which strongly determines sediment distribution and lake-floor morphology (Wessels 1995). Strong intra-annual variability of the runoff is reflected by mean water level-fluctu- ations of ca 1.5 m.
Politically, the lake is shared between Germany, Austria and Switzerland. Their boundaries were never defined for most parts of the lake (legal term:
»condominium«), so that there rose the need for cooperation and the development for a number of trans-boundary organisations already in the late 19th century. As the lake is shared between these countries, different local coordinate systems with different lake levels are in use, which refer to Mar- seille (Switzerland), Triest (Austria) and Amsterdam (Germany) and which result in height differences of 32 cm for the same lake level between the grids.
Ecologically, eutrophication problems became aware in the 1950s, which then initiated the foun- dation of the International Commission for the
State-of-the-art in surveying a large lake
1 Institute of Geological Sciences and Oeschger Centre for Climate Change Research, University of Bern
2 Bundesamt für Landestopo- grafie swisstopo, Wabern
3 AirborneHydroMapping GmbH, Innsbruck
4 FSU Jena – Institute of Geog- raphy, Physical Geography
5 Geodesy and Geodynamics Lab., Institute of Geodesy and Photogrammetry, Zurich
6 Lorth Gessler Mittelstaedt GmbH, Konstanz
7 Landesamt für Digitalisierung, Breitband und Vermessung, München
8 Landesamt für Geoinfor- mation und Landentwicklung, Karlsruhe
9 Marum, Bremen
10 BEV - Bundesamt für Eich- und Vermessungswesen, Wien
Surveying of inland waters The EU was approached for co-funding within
the INTERREG-IV project, as INTERREG promotes cross-boundary cooperations in the Lake Con- stance area. A bathymetric survey of such a large inland water with latest technologies is not only a focus for the trans-boundary scientific community, but also for administrative players (e.g. surveying authorities) around Lake Constance. This complex situation (four surveying authorities in three na- tional states), the size of the project (536 km²), and the combination of different latest technologies qualifies our project as a key example in handling these new technologies and huge data volumes.
Costs for our project – entitled »Tiefenschärfe – hochauflösende Vermessung Bodensee« – amount to 612,000 euros (shared between IGKB- member states and co-funded by INTERREG) ex- cluding a lot of in-kind contributions (e.g. costs for ship and staff of the project partners from admin- istrations). Preparations for the project began in December 2012, leading to its completion in the middle of 2015.
Methods
The multibeam echo sounder survey
The bathymetric survey for areas deeper than 5 m was carried out during 76 days from April to Au- gust 2013 using a Kongsberg EM 2040 multibeam echo sounder in a single-head configuration (1° × 1° beam width, 300 kHz standard operat- ing frequency) on RV »Kormoran«. The transduc- ers and ancillary sensors (antennas for RTK-GNSS positioning, GPS compass, motion sensor, sound velocity probe) were incorporated in a portable, rigid mounting attached to the bow of the ship.
Predefined survey parameters included maximum swath angles and minimum sounding densities, depending on water depth, as well as general mission planning. For all areas below 40 m water depth, double coverage (~110 %) was required in order to achieve optimum data quality. Dual swath mode of the EM 2040 was used in order to main- tain a reasonable survey speed while keeping suf- ficient point density and full lake-floor coverage.
In total, an area of 460.6 km² was covered by 2961 survey lines (total length 6,001 km), yielding 7,210,007,325 soundings. Typical achieved sound- ing densities are in average about 15 m–² in the deepest areas (250 m), where swath angles were restricted to ~40° to each side, >20 m–² at 100 m water depth with a swath width of 120° and about 50 to several hundred soundings a m–² in the shal- lowest zones (<10 m), where the full swath (75° to each side) was used.
High spatial and temporal variability of the ther- mal stratification of the lake made it challenging to maintain a valid sound velocity model of the water column. Therefore, a large number of in- dividual sound velocity profiles (602) were taken during the survey, and applying sound-velocity correction turned out to be a crucial step during post-processing. The initial plans to use real-time A new basis for modern research was the survey
of the entire lake between 1986 and 1990, initiated by the IGKB. In this context, echo sounder profiles with a maximum distance of 200 m and photo- grammetric analyses of the shallow-water situa- tion resulted in a 40 m grid for the deeper areas, and 10 m grid for the shallow-water zone (Braun and Schärpf 1994). These data already showed large-scale structures of the lake-floor (e.g. a me- andering canyon resulting from underflows and turbidity currents of the Alpine Rhine River). Be- tween 2008 and 2011, several small surveys used portable multibeam systems (e.g. Böder and Wessels 2009, Wessels et al. 2010) to collect data for high-resolution digital terrain models (DTM) to investigate pockmarks (concave depressions) at the lake-floor or archeological pile dwellings in the shallow water zone.
The latest step to achieve basic cartographic in- formation was a survey to minimise height differ- ences when modelling the geoid between Swit- zerland, Austria and Germany. German authorities (BKG) and the Institute for Lake Research agreed to collect data using a ship-mounted gravimeter (Schäfer et al. 2012).
Intention for a new topobathymetric survey As the pilot multibeam surveys mentioned above showed the potential of modern hydrographic survey systems, the needs for a detailed topo- bathymetric survey were discussed. A working group assigned by the IGKB identified a number of reasons and needs:
• Basic data to evaluate and review long-term environmental changes (climate change, erosional processes within the shallow-water zone, geological risk analysis, etc.);
• Documentation of man-made interventions and precise definition of judicial terms (e.g. 25 m line);
• Planning of lake-shore measures, restoration of shore lines, conservation of archeological sites, measures for the prevention of anthro- pogenic long-term erosion;
• Input data for advanced 3D-modelling (e.g.
for use of thermal energy, intrusion of waste waters);
• Scientific goals (neotectonics, investiga- tion of lake-bottom structures, intrusions of ground water into the lake).
To fulfil these requirements for high-resolution data, the IGKB member states (Baden-Württem- berg, Bavaria, Austria and Switzerland) decided to conduct a state-of-the-art multibeam survey, fol- lowed by an airborne LiDAR survey of the shallow- water zone. Combining both methods, it is possi- ble to generate seamless DTMs from land into the deep areas. Both methods were complemented by an independent quality management. As a high public interest in these data was expected, the whole project should be accompanied by a professional public relation company.
Acknowledgements We thank Kurt Sarembe and Andreas Schiessl, captains of RV »Kormoran«, for their extraordinary endurance with surveyors!
We also thank IGKB and the INTERREG IV-programme of the European Union for funding of this project.
Surveying of inland waters
positioning corrections over a cellular network- based Internet connection (which is in theory available for the entire survey area) with NTRIP had to be abandoned due to the insufficient stability of the connection, and post-processed RTK positions were used instead.
Since the new bathymetric data reveals poten- tially sensitive information (drinking-water intakes, archeological sites), it was decided that these fea- tures should be masked in the publicly available data set. During processing, the relevant sound- ings were classified and flagged, so that raster data sets, both including (equivalent of »digital surface model«, DSM) and excluding these soundings (equivalent of »digital terrain model«, DTM), can be generated.
Investigations of the geoid
The geoid, one of the main research topics in ge- odesy, corresponds approximately to the mean sea surface topography and serves as the reference for height indications like ›above mean sea level‹. The three-dimensional geometry of the lake’s surface has been determined simultaneously with the bathymetric survey.
A GPS-antenna and a down-looking acoustic ranger were tightly mounted on an outrigger to starboard ahead on the RV »Kormoran«. The acous- tically determined distance from the antenna to the water surface is added to the precise GPS-posi- tion of the antenna. In doing so the complete lake’s surface has been sampled at about 3 cm precision in mean height, thus enabling a precise determi- nation of the local geoid (Fig. 1). Disturbances like waves were removed by filtering whereas seasonal and meteorologically induced sea level variations, about 1.7 m during the measuring campaign, have been corrected by gauge data provided by hydro- logical institutions around the lake.
Topobathymetric LiDAR survey
Airborne laser scanning is a new and very effective concept for fast and economic mapping of large areas to collect high-quality, and high-resolution survey data. We combined a high-resolution spatial view at the lake-floor using LiDAR (>10 points/ m²),
with high-resolution aerial (<10 cm/pixel) and thermal images.
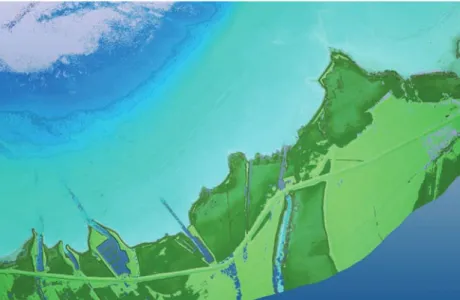
The airborne hydromapping survey of Lake Con- stance (Fig. 2) was completed within three days using the hydrographic scanner VQ820-G of Riegl LMS in March and June 2014. A consistent point cloud was calculated with corrections for the in- dividual scan strips by a strip-adjustment process.
The relative accuracy of this procedure ranges between 0.07 m and 0.1 m (given as standard de- viation). Then the point cloud was geo-referenced to terrestrially measured reference planes, which were distributed around the entire lake (accu- racy about 0.08 to 0.09 m, standard deviation).
The point density after combining all scan strips reaches up to 40 to 50 points/m² and about 20 to 30 points/m² near the shoreline in shallow areas, whereas it decreases to ca 10 to 20 points/m² at a depth of 4 to 5 m. We classified the point cloud into eleven classes (terrain on land/lake, vegeta- tion, etc.) and three classes where remaining gaps had to be interpolated.
In a first step, flaw echoes were automatically filtered and the remaining was then corrected manually. Within an approximately 50 m wide strip along the shoreline, point classification was done manually to ensure a correct mapping of the water-land-boundary as well as correct classifica- tion of complex areas like harbours. The remain- ing foreland area with a distance of 300 m from the shoreline and the underwater area are classi- fied automatically using algorithms and modules implemented in the software HydroVISH. Runtime and water depth correction were also determined within Hydro VISH.
About 22,000 (±2 %) aerial pictures were ac- quired using a mid-format camera (Hasselblad H3DII-39). With these pictures, a digital ortho- photomosaic for the shoreline of Lake Constance is developed. The images are orientated based on an aerotriangulation, and orthorectified using the official DTM (1 × 1 m) of Austria, Switzerland, Bavaria and Baden-Württemberg. About 60 refer- ence points and 20 control points were defined, and their coordinates were extracted from the LiDAR data in order to perform the aerotriangu-
Fig. 1: Lake’s surface departs from an ideal ellipsoidal refer- ence and runs approximately parallel to the geoid. It reflects directly the form of the gravi- tational field (Geodesy and Photogrammetry, ETH Zurich)
Fig 2: Shallow areas captured by hydromapping, deeper areas captured by echo sounder References
Böder, Volker; Martin Wessels (2009): Einsatz hydrographi- scher Sensoren und Verfah- ren zur Untersuchung von Pockmark-Strukturen im Bodensee; in: Geoinforma- tionen für die Küstenzone, Vol. 2, pp. 159–164 Braun, Eberhard; Klaus Schärpf
(1994): Internationale Bo- densee-Tiefenvermessung 1990; Landesvermessungs- amt Baden-Württemberg (ed.), Stuttgart, pp. 1–98 Gilfedder, Benjamin; Michael
Petri; Martin Wessels;
Harald Biester (2010): An iodine mass-balance for Lake Constance, Germany:
insights into iodine specia- tion changes and fluxes in a limnic system; Geochimica et Cosmochimica Acta 74, pp. 3090–3111
Hörnlimann, Jacob (1893): Die Tiefenmessungen und das Kartenmaterial für die Herstellung der neuen Bodensee-Karte; Schrr. Ver.
Gesch. Bodensee, 22, pp. 50–57
Schäfer, Uwe; Gunter Liebsch;
Franz Barthelmes; Hartmut Pflug; Svetozar Petrovic;
Martin Wessels (2012):
SGRAV2012 – eine schiffs- gravimetrische Vermessung des Bodensees; Gravimetrie Workshop, Potsdam 2012 Waibel, Ferdinand (1971): Das
Rheindelta im Bodensee, Seegrundaufnahme vom Jahre 1969; Berichte der Internationalen Rheinregu- lierung, pp. 1–17 …
Surveying of inland waters SAPOS-based real time kinematic GPS-height/tide
correction as well as the applied roll/pitch/heave corrections. Previous and recent digital orthopho- tos and especially ground control point meas- urements are used to validate the LiDAR surveys made within this project.
Public relations activities
Within our public relation activities, a logo and a corporate design was designed by an advertising agency Lorth Gessler Mittelstaedt located in Kon- stanz. These products were already prepared for the kick-off meeting, which was accompanied by a press conference. Journalists had on board of the RV »Kormoran« the opportunity to observe the capacity of the online-visualisation of the multi- beam acquisition software. Later on, a website, a brochure and a small exhibition in a public place in the village of Langenargen were realised. Two fur- ther press conferences and several appointments with journalists produced an outcome of more than 200 contributions in newspapers, websites, radio and TV in four countries.
First results of project »Tiefenschärfe«
A lot of fascinating lake-floor features were already recognised during the surveys and later on refined during processing of data. Only few examples will be presented here as further evaluation will take lation. Afterwards, the pictures are orthorecti-
fied, and a radiometric correction is applied to homogenise the colour distribution of the entire image block. The mosaicking is performed along natural boundaries. Correction of seamlines is carried out only for image boundaries across buildings. The final ground resolution of the or- thophotos is about 7 cm with an accuracy of less than 1 m (CE90).
Quality management
The project »Tiefenschärfe« is attended by an ex- ternal quality management from the beginning (preparation for tender to multibeam and LiDAR data acquisition) to processing and finalising prod- ucts. To ensure a high-quality digital terrain model (DTM) the measured data are verified with several methods. An Innomar SES-2000 light sub-bottom profiler (SBP) run parallel to the multibeam meas- urements. Besides control points and area meas- urements along sub-aquatic archeological sites and bankside constructions like nose-piece, the depth traced with the sub-bottom profiler is used, once sound velocity profile corrected, to validate the multibeam and LiDAR measurements. In addi- tion, cross lines and small double surveys are used for multibeam data verification in order to assure the requested IHO special order. Another task for the quality management is to cross-check the
…
Wessels, Martin (1995): Boden- see-Sedimente als Abbild von Umweltänderungen im Spät- und Postglazial;
Göttinger Arbeiten für Geo- logie und Paläontologie, 66, pp. 1–105
Wessels, Martin (1998): Late- Glacial and Postglacial sedi- ments in Lake Constance (Germany) and their palaeo- limnological implications;
in: Erich Bäuerle and Ursula Gaedke: Lake Constance – Characterization of an ecosystem in transition;
Arch. Hydrobiol. Suppl. 53, pp. 411–449
Wessels, Martin; Ingeborg Bussmann; Stefan Schlömer;
Michael Schlüter; Volker Böder (2010): Distribu- tion, morphology, and formation of pockmarks in Lake Constance, Germany;
Limnol. Oceanogr., 55(6), pp. 2623–2633
Zeppelin, Eberhard (1893): Äl- tere und neuere Bodensee- Forschungen und -Karten;
Schriften des Vereins für Geschichte des Bodensees, 22, pp. 21–45
15Anz-CallFor189x1295dr.Fh10 12.01.2015 9:04 Uhr Seite 1
Call for Projects
Innomar supports science
Innomar Technologie GmbH is pleased to announce active support for the scientific community and calls for student project proposals. We will provide a SES-2000 compact parametric sub- bottom profiler system, on-site training and individual support onboard your survey vessel for three research projects in Europe free of charge.
Parametric Sub-bottom Profiler SES-2000 compact Parametric SBP Transducer
Important dates:
submission of proposal 31/03/2015 end of fieldwork 30/06/2015 submission of report 30/09/2015
Innomar Technologie GmbH Schutower Ringstr. 4
D-18069 Rostock, Germany Phone +49 (0)381-44079-0 Fax +49 (0)381-44079-299
www.innomar.com
What projects can apply?
Any research project at postgraduate level (MSc, PhD) with a hydrographic component can apply. Applications include hydrography, dredging, oil & gas, ports & harbours, re- newables, environmental studies, underwater archaeology and geo-sciences. Field work should not exceed 2 weeks and must be performed in Europe. The project and report must be finished by 30 September 2015.
Who can apply?
Any student at postgraduate level enrolled at a European university or scientific institute can submit a proposal.
What can you expect?
Apart from active support with equipment and training we will invite the student with the most successful project to present the results during the 7th workshop “Seabed Acoustics” in Rostock, Germany in November 2015. The winning project will be published in Hydro International to bring your work closer to a wide audience in the hydrographic community.
What do we expect?
A final report in English must be submitted at the end of the project (max. four A4 pages).
Innovation, commitment and submission on time are imperative.
How to apply?
Surveying of inland waters
some while and final processing of the data is not yet completed. Thus, results and images presented here are still preliminary.
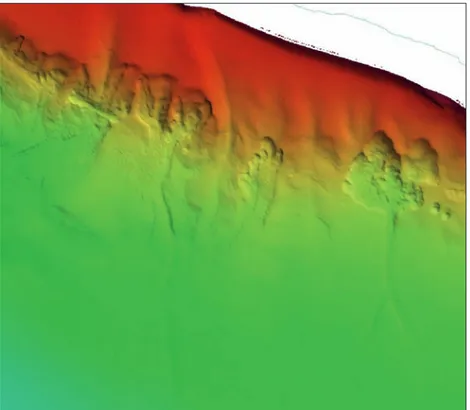
Morphology in the shallow-water zone One of the unexpected results is the morphology in the shallow-water zone of Lake Gnadensee, an isolated and somewhat protected basin of Lower Lake Constance. Here, large portions offshore the shorelines have a hummocky structure or are cov- ered with large but shallow depressions (ca 10 to 50 m diameter, 0.2 to 0.5 m deep, Fig. 3). This was never observed before in any other part of the lake. So far, we speculate, that this protected part of the lake preserved some of the late glacial surface, when the Rhine glacier retreated from the Lake Constance basin. All other shorelines of the lake are much more exposed towards winds and waves, which probably levelled all of these struc- tures at the shoreline. This interpretation is sup-
ported by sub-bottom profiling data that show in other parts of the lake the morphology of the shallow-water zone being strongly homogenised since the Late Glacial.
Indicators for lake-groundwater interactions In deeper waters (about 80 to 100 m) of Lake Überlingen, the fjord-like northwestern arm of the main basin of Upper Lake Constance, large and irregular depressions with sharp upslope edges and smoother lake ward boundaries occur (Fig. 4).
These depressions lack any hints for rock slides or mass movements and are currently interpreted as caused by groundwater discharge into the lake.
In a new project, we will investigate if indeed groundwater-sources (e.g. from nearby molasse- rocks) may contribute to the water budget of Lake Constance. Even though springs within the molasse are often observed, their contribution to the overall water budget of the lake is unknown.
These features are in particular interesting as they may contribute to significant boundary conditions regarding the discussion of fracking technologies in the vicinity of the lake.
Topobathymetry in the shallow-water zone Water levels of Lake Constance usually differ about 1.5 m (max. 3 m) with maximum wave height of up to 2.5 m. This results in a high degree of ero- sion and accumulation which is increased by ship waves and strongly endangering cultural herit- age like pile settlings. Despite these forces which tend to equalise morphology, our new data show a high degree of morphological patterns in the shallow-water zone (e.g. megaripples near the mouth of the River Rhine, Fig. 5). These of course were known (and visible in orthophotos) but with dimensions never investigated in detail in a lake.
Thus, the new data will strongly help to under- stand the functioning of the shallow-water zone in a large lake.
Flight into the lake
Besides the above mentioned basic technologies, a number of existing data sets have to be handled.
To visualise the bathymetry, a virtual flight from the surrounding region into the lake is anticipated, fuelling the high degree of enthusiasm of the pub- lic for the rich underwater landscape, which even- tually will help to protect the entire lake. This flight should visualise the existing data (on land) and the new underwater data (from LiDAR and multibeam) for the public. For that flight, digital orthophotos (DOP) with a resolution of up to 20 cm and DTMs with 1 m grid size were transformed from four na- tional grids into a unique coordinate system. Errors occurring when combining the data sets of differ- ent origin were corrected manually with software solutions that are able to handle the large image files. Once this product is finished, the visualisation is done using two different resolutions: in a first step, DTMs with 10 cm resolution will be covered
Fig. 3: Shallow areas of Gnadensee, a small isolated and protected basin part of Lower Lake Constance have a hummocky structure, prob- ably a remnant of the retreat- ing Late Glacial ice sheet
Fig. 4: Depressions along the slope give hints for groundwater intrusions into Lake Überlingen
Surveying of inland waters
Experiences from our trans-boundary coop- eration of the surveying authorities will help to execute further national surveys, as boundary conditions (e.g. coverage of multibeam swaths) can be well defined and evaluated, and data processing and handling can be better planned.
In fact, new projects are already anticipated in Switzerland that will also combine topobathy- metric LiDAR and multibeam echo sounder data. “
with a 4 m DOP. LiDAR and multibeam data from the lake will then be integrated in a second, high- resolution level, so that, when flying into the lake, the visualisation automatically switches into the relevant level.
Experiences and challenges
Our project resulted in a number of lessons and ex- periences in addition to the lake-floor data. Techni- cally, a project of this size is really difficult to handle, as small freshwater bodies are much more variable compared with fully marine systems. Especially in nearshore regions, water bodies strongly differ spa- tially and temporally, in particular in spring and ear- ly summer, when the lake is rapidly warming. So far, also advanced processing software packages (Caris HIPS and SIPS) still lacks a proper handling of the high numbers of sound velocity profiles in a satis- factory way (we measured 602 profiles). Also, pos- sibilities to handle and classify data which should not be visible in the final products (mainly inlets for drinking water supply and relevant archeological objects) are limited so far.
When processing LiDAR topobathymetric data, there is no solution to achieve lake-floor data in densely vegetated areas. Further, the methods pre- sented will have limitations when used e.g. for veg- etational studies with submerged macrophytes.
Fig. 5: Airborne LiDAR data of the Rohrspitz impressively show the rich morphology in the shallow-water zone with long megaripples parallel to the shoreline
CPU Unterwassertechnik GmbH www.cpu-bremen.de
Kameras ROV
Sensoren
Beleuchtung
Laserscanner
Underwater inspection and monitoring
some limitations such as acoustic shadow zones, which appear at structures with a complex geom- etry. Furthermore, the minimum resolution of the systems is limited by the distance from the trans- ducer to the object and the swath opening angle.
Thus, the use of multibeam systems alone may not lead to the required resolution when mapping key subsea structures.
Hence, a scanning sonar is used for a more de- tailed examination of the subsea structure during the second stage of the inspection. Opposed to multibeam echo sounders, scanning sonars pro- vide, depending on the mode settings, either high- resolution profiling data (profiling mode) or imag- ing data (imaging mode). Imaging data provides high-resolution qualitative information, which can be used for precise visual analysis and two-dimen- sional measurements. In contrast, high-resolution three-dimensional point cloud data, revealed in profiling mode, achieves better data precision and density, as well as reduced shadow zones in com- parison to multibeam point cloud data. Further- more, profiling data is very useful for modelling.
Nevertheless, due to the high time expenditure of profiling measurements (one high-resolution scan can take up to several hours), it is only efficient and economical to conduct these measurements in specific locations of interest. These locations are defined after the analysis of the previously record- ed multibeam and imaging data.
In the third stage of the inspection concept, quantitative (imaging data) and qualitative (multi- beam and profiling data) information are proc- essed and combined, before the data set is ana- lysed and interpreted.
3 The Amsterdamer quay wall survey
For running the three-stage inspection concept, the Amsterdamer Kai, located in the Dradenauhafen in the Port of Hamburg, was selected as the survey site in spring 2014. The investigated quay wall is about 500 m in length and is used as a docking place for freighters and barges. The main task of the project was to examine the condition of the quay wall, which is made up of several fixed sheet piles. Par- ticular attention was paid to the steel plates, which
1 Introduction
Three-dimensional inspections of underwater structures are a specific survey challenge, requiring specialised techniques and methods. In extreme en- vironments, such as a basin in a port, optical sensors and divers might be limited due to a very high par- ticle load in the water column. Divers also struggle with limitations of their working time under water.
Acoustic methods are not affected by these issues, making them an effective, innovative approach for in-port surveys. Methods and techniques are gener- ally customised, depending e.g. on the geometry, the desired resolution and the distance from the investigated object to the transducer. However, the acquisition of high-quality data covering large complex subsea structures in short order, remains a major challenge. Here, a combination of different inspection methods is essential to ensure an opti- mum coverage of the inspected subsea structure.
For this purpose KMEMB introduced a three-stage inspection concept, which provides best possible information and analysis of the inspected object.
The concept is based on a cost-efficient overview survey. This data is used to define specific locations of interest, where a more time-consuming high- resolution survey will be performed. The combi- nation of these methods ensures that the most important areas are covered in fine detail, whilst achieving a full overview of the location. In this arti- cle, we present the results of a survey conducted by KMEMB in cooperation with Kongsberg Maritime in Germany and Kongsberg Mesotech Ltd., supported by Hamburg Port Authority.
2 Three-stage inspection concept of subsea structures
The three-stage inspection concept is based on a multibeam echo sounder survey. Multibeam sys- tems provide coarse, but accurate point cloud data in relatively short time, which makes multibeam mapping an effective and fast method for an over- view inspection of underwater structures. The recorded point cloud data delivers quantitative in- formation and can be used in post-processing for three-dimensional measurements and volume cal- culations. Nevertheless, the method is subject to
Extensive sheet pile wall inspection in the Port of Hamburg
An article by ISABELL MüCKE
quay wall inspection | underwater inspection | MBES | multi-frequency scanning sonar | 3D modelling
Author
Isabell Mücke is Assistant Service Engineer for Kongs- berg Maritime Embient GmbH in Halstenbek
isabell.mucke@km.kongsberg.com
In spring 2014 a survey was conducted in the Port of Hamburg to examine the condi- tion of a quay wall. For this purpose Kongsberg Maritime Embient GmbH (KMEMB) introduced a three-stage inspection concept, which provides, according to the cur- rent state-of-the-art sonar-techniques, best possible information and analysis of the inspected object, while
significantly reducing survey time and costs related to the inspec- tion. On basis of the survey data, a complete picture of the quay wall was created. Several ar- eas of specific interest have been detected, such as bended sheet piles, scouring and dis- torted steel plates.
Underwater inspection and monitoring quency of 1,100 kHz and producing a beam width
of 0.6° × 45°. Every ten metres, scans with range settings of 15 m were performed to ensure good overlap coverage between scans (Fig. 2), whereby the scanning time was approximately 1 minute per scan. The whole quay wall was recorded this way. A data example (screenshot) during imaging survey is shown in Fig. 3. The distances between the individual scans were selected deliberately, in order to produce an image overlap to eliminate in later processing the typical data gaps in the centre of rotation of the sonar head (Fig. 1 and Fig. 2).
Project phase II: Profiling survey
After a short data analysis of the recorded multi- beam and imaging data, a profiling survey was per- were welded on the sheet pile wall to repair former
damage. The shape of the investigated sheet wall is an isosceles trapezoid, with the wide side facing outwards, which makes it susceptible to the forma- tion of shadow zones in sonar data. This had to be considered during planning and measuring. Fur- thermore, KMEMB had to deliver precise, high-res- olution data to determine possible areas of interest (e.g. deformations) and the corresponding location (exact position and depth). In order to meet these requirements, KMEMB used the three-stage inspec- tion concept as a guideline for the survey.
3.1 Method
Following the three-stage inspection concept, a multibeam overview survey was conducted, fol- lowed by a high-resolution survey and the final processing, analysis and interpretation of the com- bined data set.
Project phase I: Overview measurement and extensive recording of qualitative data During the first phase an overview measurement of the sheet pile wall and the adjacent sea-floor was conducted using a Kongsberg EM2040 multi- beam system. The system operates at a frequency of 400 kHz with a beam width of 0.4° × 0.7°. Dur- ing survey the transducer was mounted at a pole on the side of the survey vessel and orientated to- wards the quay wall. Motion data was acquired by a Kongsberg Seapath 330 Inertial Navigation System, and VRS (Virtual Reference Station) corrections were received via GSM modem. The measurement was repeated several times. During the individual measurements, the vessel was sailing along vari- ous profiles with respect to the quay wall, which resulted into varying positions and sizes of shadow zones in the multibeam data. Through the com- bination of these individual data sets, the shadow zones could be reduced during post-processing.
Project phase II: High-resolution survey The multibeam survey was followed by a high-res- olution survey, conducted with a Kongsberg Me- sotech 1171-Series high-resolution, multi-frequen- cy, Fan/Conical Beam Transducer Scanning Sonar (MS 1171). This sonar supports two different modes of operation. It was first used in imaging mode and then in profiling mode. During imaging survey, a fan-shaped acoustic beam is produced to scan a specified area or feature, while during profiling sur- vey a narrow, conically shaped beam generates a single point for each ping.
Project phase II: Imaging survey
For imaging survey, the scanning sonar was de- ployed on a pole, which was adapted to a mobile working platform (man lift). The platform was op- erated on shore, illustrated in Fig. 1. The sonar head was in approximately 1 m water depth during measurement. The sonar was operated with lin- ear frequency modulated (LFM) pulses using a fre-
Fig. 1: Survey configuration in imaging mode
Fig. 2: Scanning positions and procedure in imaging mode
Fig. 3: Screenshot of a data example during imaging survey
Fig. 4: Survey configuration and procedure in profiling mode
Underwater inspection and monitoring
survey was conducted using relative positioning.
The resulting point cloud data was co-registered and geo-referenced in the post-processing phase, using the multibeam data from project phase I.
Project Phase III: Processing
After finishing the data recording, the third stage was devoted to several processing steps to com- bine the recorded quantitative (imaging data) and qualitative (multibeam and profiling data) in- formation. The single imaging scans on the one side and the multibeam profiles on the other side were merged to overview pictures and geo-refer- enced in relation to the quay wall. In addition, the multibeam data were supplemented by laserscan data, which were provided by the Hamburg Port Authority and show the part of the quay wall that is above sea level. Besides that, 3D models were generated using both multibeam data and point cloud data from the high-resolution profiling sur- vey (for high-resolution model see Fig. 5). On this data basis, a complete picture was created and the condition of the quay wall could be analysed.
3.2 Result
The full picture of the quay wall after data process- ing is illustrated in Fig. 6. Several features have been detected, such as bended sheet piles, scour- ing and distorted steel plates. Larger features were identified in the multibeam data, while smaller fea- tures were identified in the imaging data. For in- stance, after analysing the imaging data, small de- formations (2–10 cm) have been detected on the lower part of the sheet piles, which have not been formed in areas where features (e.g. welded steel
plates) were identified. For this purpose the single- axis profiling head was integrated with a Kongsberg Mesotech Heavy Duty Rotator (mechanical second axis drive), which was mounted on a tripod assem- bly. The tripod was placed on the sea-floor with the sonar adjusted parallel to the quay wall, displayed in Fig. 4. This method provides high-resolution three- dimensional profiles. After collecting the single axis profile, the head rotates by the second axis drive through preset increments and the scan process repeats. This generates a grid of profile points from a single position, after which the processed data generates a three-dimensional point cloud. During measurement the operating frequency of the sonar was set to 1,100 kHz with beam width of 1° × 1° and the pulse type to LFM. The step size of the rotator was set to maximum resolution (0.225°). Thereby a point resolution of 1–2 cm was achieved. The time needed for one 45° scan was approximately two hours, whereby about 130,000 data points were col- lected. Due to the tripod deployment method, the
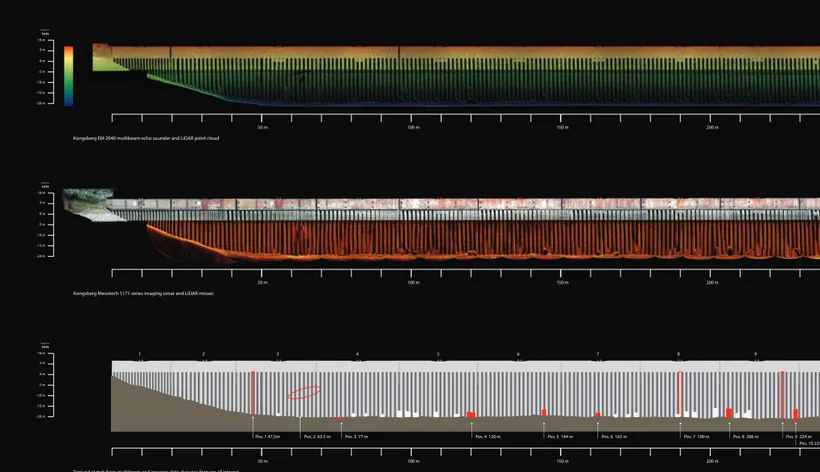
Kongsberg EM 2040 multibeam echo sounder and LiDAR point cloud 0 m
-5 m
-15 m -20 m -10 m 10 m height over NHN
5 m
50 m 100 m 150 m 200 m 250 m 300 m 350 m 400 m 450 m
Kongsberg Mesotech 1171 series imaging sonar and LiDAR mosaic 0 m
-5 m
-15 m -20 m -10 m 10 m height over NHN
5 m
50 m 100 m 150 m 200 m 250 m 300 m 350 m 400 m 450 m
Derived sketch from multibeam and imaging data showing features of interest
50 m 100 m 150 m 200 m 250 m 300 m 350 m 400 m 450 m
Pos. 11 362m Pos. 10 229 m
Pos. 1 47,5m Pos. 2 63.5 m Pos. 3 77 m Pos. 4 120 m Pos. 5 144 m Pos. 6 162 m Pos. 7 190 m Pos. 8 206 m Pos. 9 224 m
0 m -5 m
-15 m -20 m -10 m 10 m height over NHN
5 m
1 2 3 4 5 6 7 8 9 10 11 12 13 14 15 16 17 18
Key Wall Inspection 2014 - The Full Picture
Fig. 5: Data example of high- resolution profiling data (left), and a 3D-model based on high-resolution profiling data
Fig. 6: Result of the Amsterda- mer quay wall survey: imaging data of the wall (upper panel);
multibeam and laserscan data of the wall (centre panel);
2D-model of the wall, showing identified features (lower panel)
Underwater inspection and monitoring
ments and different resolutions make it possible to ensure an optimum coverage of the investigated subsea structure in the shortest time possible. The concept has been structured in such a way that the different restrictions of the individual devices are neutralised when applying these in the over- all concept, which is demonstrated in Fig. 7. The final result exhibits both qualitative and quantita- tive information. The quantitative information is provided by high-resolution imaging data, while qualitative information is provided by multibeam and high-resolution profiling data. The initial in- spection of a quay wall in size of the conducted survey, including the baseline survey with post- processing and identification of features, the de- tailed high-resolution survey with post-process- ing, and the final reporting and documentation, will last about 20 days. The final result will be an illustration like in Fig. 6, without being at risk to miss any feature. Based on this full picture base- line survey, repeated surveys of the identified criti- cal features only utilising the scanning sonar, can be conducted at longer intervals. A repeated sur- vey is estimated to be in the area of 2–3 days only, including post-processing and documentation. “ noticed in the multibeam data. In contrast, the re-
corded point cloud multibeam data allowed the identification of the direction and shape of the de- formation of sheet piles, which cannot be derived from the imaging data. As a final result, the quay wall is illustrated as a 2D-model (see Fig. 6, lower panel) with all identified features. This is used as the basis for the required upcoming work, where for instance divers can be sent directly to the sur- veyed features. Finally, the high-resolution point cloud, derived from the profiling survey, as well as the multibeam data were used for the genera- tion of 3D-models. Due to the limited point cloud density and accuracy, the multibeam data model shows different artefacts and uncertainties. Com- pared to that, the high-resolution profiling model, displayed in Fig. 5, shows significantly less shadow zones and fewer distortions.
4 Conclusion
The three-stage inspection concept offers a wide range of information that is crucial for a complete analysis of an investigated subsea structure. The combination of individual data sets of different sonar systems involving differing time commit-
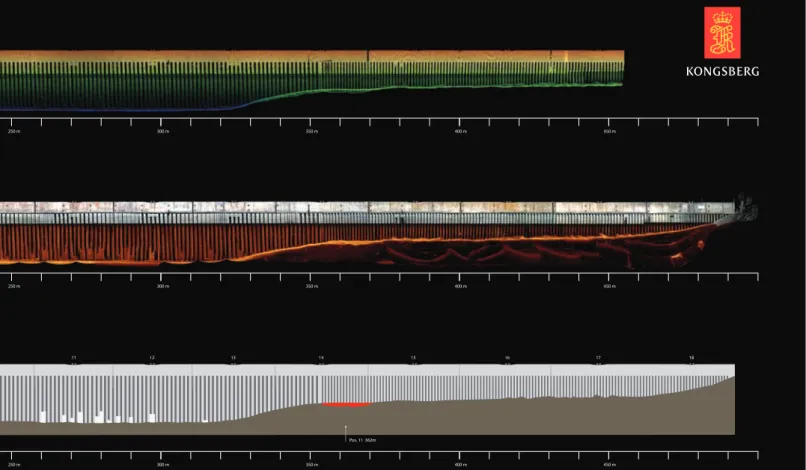
Kongsberg EM 2040 multibeam echo sounder and LiDAR point cloud 0 m
-5 m
-15 m -20 m -10 m 10 m height over NHN
5 m
50 m 100 m 150 m 200 m 250 m 300 m 350 m 400 m 450 m
Kongsberg Mesotech 1171 series imaging sonar and LiDAR mosaic 0 m
-5 m
-15 m -20 m -10 m 10 m height over NHN
5 m
50 m 100 m 150 m 200 m 250 m 300 m 350 m 400 m 450 m
Derived sketch from multibeam and imaging data showing features of interest
50 m 100 m 150 m 200 m 250 m 300 m 350 m 400 m 450 m
Pos. 11 362m Pos. 10 229 m
Pos. 1 47,5m Pos. 2 63.5 m Pos. 3 77 m Pos. 4 120 m Pos. 5 144 m Pos. 6 162 m Pos. 7 190 m Pos. 8 206 m Pos. 9 224 m
0 m -5 m
-15 m -20 m -10 m 10 m height over NHN
5 m
1 2 3 4 5 6 7 8 9 10 11 12 13 14 15 16 17 18
Key Wall Inspection 2014 - The Full Picture
Multibeam survey
Pro Con
• Good survey coverage in short time, provid- ing a geo-referenced overview for future detail scans (profiling)
• Good positioning accuracy
• Small anomalies cannot be identified
• Shadows due to the shape of the structure
Imaging survey
Pro Con
• Very short timed survey per single scan location
• Small anomalies can be resolved
• Scan results are very dependent of scanning head stability (mount- ing is important)
• Only 2D measure- ments are possible
• Slant range distortion
Profiling survey
Pro Con
• Best achievable resolution
• Minimal development of shadow zones
• Generation of exact 3D model possible
• Scan results are very dependent of scanning head stability (mount- ing is important)
• Scan duration may be very time consuming
Fig. 7: Summary of the three inspection methods with pros and cons
Applied research
soil conditions in the German Bight the implemen- tation of a burial depth of 3 m is ambitious from a technical point of view as well as being very cost-intensive. Hence, a discussion between the transmission system operator and the approving authorities about the possibility to reduce the pre- scribed burial depth has been initiated.
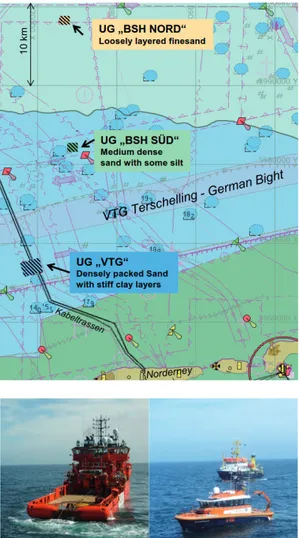
To gain more information on the level of risk in- volved in a possible reduction of the burial depth, a consortium of stakeholders embarked upon a field measurement programme in order to deter- mine the real penetration depths of anchors into the sea-floor. Alongside the transmission system operator TenneT and the approving authority (Wa- terways and Shipping Administration of the Feder- al Government, GDWS), the Federal Maritime and Hydrographic Agency (BSH), the Dutch research institute Deltares and the Federal Waterways En- gineering and Research Institute (BAW) have been involved in the field measurement programme, its documentation and the scientific evaluation of the results. The results of the experiment will poten- tially support and substantiate the enhancement of the regulations for the burial depth of subsea power cables in the TSS. The most relevant regula- tions are formulated in the »Spatial Offshore Grid Plan« which is issued and updated by the BSH for the German EEZ. The plan is being coordinated in consent with other federal agencies like the GDWS for nautical concerns.
Anchor penetration tests
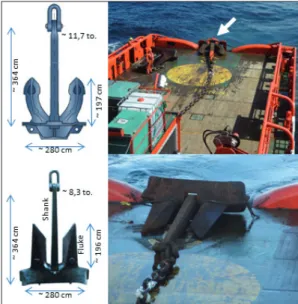
One 8.3 tons AC14 anchor and one 11.7 tons Hall anchor have been selected for the implementa- tion of the anchor penetration tests (Fig. 1). These were accepted to be representative for a 294 m long container vessel of 80,000 dwt, which has been chosen as the design vessel after traffic anal- ysis in the TSS. The anchor equipment like chain, shackles and forerunners gave another 8.7 tons of weight and the total length measured from the anchor to the stern of the vessel is about 140 m.
In process of planning the experimental setup the strong interaction between the behaviour of
Introduction
There are currently 1,500 km of subsea power ca- bles installed in the North Sea and some 1,800 km more are planned. Many of them underlying major shipping channels like the Traffic Separa- tion Scheme (TSS) »Terschelling – German Bight«, which is part of the German Exclusive Economic Zone (EEZ) and one of the busiest waterways worldwide. In areas like this, the goal is to define an optimal burial depth for the subsea power cables transferring energy from the offshore wind farms to the shore. Criteria are (among others):
• Protection of the subsea power cable itself;
• Reduction of time and costs for laying and maintenance;
• Protection of the marine environment;
• Requirements of fisheries and shipping.
One of the issues in this context is to determine the depth, to which ship anchors can endanger buried subsea power cables. To guard against the risk factor arising from anchor manoeuvres in emergency and disaster situations the regulations for the TSS »Terschelling – German Bight« prescribe a burial depth of 3 m below the seabed. Outside this area subsea power cables are buried generally at 1.5 m below the seabed. Due to locally difficult
How deep is deep enough?
An article by CHrISTIAn MAUSHAKE
subsea power cable | grid connection | anchor penetration test | hydrographic survey | German Bight
Author
Christian Maushake works as hydrographer at the Federal Waterways Engineering and Research Institute (BAW) in Hamburg
christian.maushake@baw.de
»How deep does an anchor penetrate the sea-floor?« This question has been exam- ined by a team of scientists and technicians in Germany. The motivation for this large- scale fieldwork was the use of sea cables for shore connections to offshore wind farms in the German Bight. The current regulations prescribe a burial depth of 3 m when sea cables cross shipping channels. The reason for this increase is to guard against the risk factors arising from
anchor manoeuvres in emergency and disaster situations. Conversely, implementing a burial depth of 3 m is techni- cally very ambitious as well as being very cost- intensive.
Anchor penetration tests in the German Bight to optimise burial depth for subsea power cables
Fig. 1: Anchors used for the trials with dimensions: Hall anchor (top), AC14 anchor