Research Collection
Working Paper
Media Slant is Contagious
Author(s):
Widmer, Philine; Galletta, Sergio; Ash, Elliott Publication Date:
2020-10
Permanent Link:
https://doi.org/10.3929/ethz-b-000454192
Rights / License:
In Copyright - Non-Commercial Use Permitted
This page was generated automatically upon download from the ETH Zurich Research Collection. For more information please consult the Terms of use.
Center for Law & Economics Working Paper Series
Number 14/2020
Media Slant is Contagious
Philine Widmer Sergio Galletta Elliott Ash
October 2020
Media Slant is Contagious ?
Philine Widmer
1, Sergio Galletta
2,3, Elliott Ash
21University of St.Gallen
2ETH Zürich
3University of Bergamo
Abstract
This paper provides causal evidence on how partisan news messaging from cable televi- sion influences the content published by newspapers in U.S. localities. We introduce a new parallel corpus of newspaper articles (24M articles in 600+ local newspapers) and transcribed television news shows (40K cable news episodes from Fox News Channel, CNN, and MSNBC) for the years 2005-2008. We measure media influence using a su- pervised learning model that predicts, for a given piece of text, the probability that it comes from a Fox News transcript, rather than from CNN or MSNBC. After validating the measure, we apply it to the local newspaper article texts. Exogenous variation in news viewership across localities comes from relative channel numbering, which we use as instruments. We find that an exogenous increase in local viewership of a cable news network shifts the textual content of local newspapers toward that network’s content.
Televised media slant works not just through persuading viewers, but through influencing other media outlets.
Preliminary working paper. Comments welcome.
?We thank for helpful comments and suggestions Ruben Durante, Claudio Ferraz, Roland Hodler, Eunji Kim, Ro’ee Lee, Josh McCrain, Giovanni Prarolo, Pia Raffler, Jim Snyder, David Yang, and seminar and conference participants at the Harvard Political Economy Seminar, Econometric Society World Congress, Bologna Workshop on Elections, Democracy, and Populism, University of St. Gallen Economics Seminar, and Zurich Text as Data Workshop. Romina Jafarian and Matteo Pinna provided excellent research assistance.
Corresponding author: Philine Widmer.
Email addresses: philine.widmer@unisg.ch (Philine Widmer), sergio.galletta@unibg.it (Sergio Gal- letta)ashe@ethz.ch(Elliott Ash).
1. Introduction
Does exposure to politically biased news messaging distort the news output of other media organizations? This is an important question for social scientists and for pol- icymakers making decisions about media regulation. While the literature shows that partisan media affect voting by citizens and politicians, there is no previous evidence on whether and how national (slanted) media influence media content at the local level.
We seek to provide evidence on this issue using a new corpus of 24 million article snippets from 600+ local newspapers in the United States for the years 2005 through 2008. We combine these texts with a parallel corpus of the full-text transcripts from news shows on Fox News Channel (FNC), CNN, and MSNBC. We add rich metadata on newspaper circulation, television channel positioning and ratings, and political and demographic covariates.
The text data are used to measure the linguistic similarity between cable news and local newspapers. We introduce a novel measure of news influence using a supervised learning model, which produces a prediction about whether a given body of text is from a relatively conservative network (FNC), rather than from a relatively liberal network (CNN or MSNBC). We validate the model and associated predictions.
The model is applied to the corpus of local newspaper articles. For each article, we then have a text-based metric that indexes similarity to language from FNC shows (relative to shows on the other networks). We then aggregate that measure to the level of the newspaper, to get a novel measure of partisan news slant for each newspaper.
We then ask if relative similarity to language in a cable news network increases in response to higher viewership in a newspaper’s market. Cross-sectional or panel data estimates of this relationship would likely be biased. For example, estimates might be confounded if more conservative(-trending) counties have higher Fox News viewership and more conservative(-trending) local news reporting. Hence, to obtain causal esti- mates, we exploit exogenous variation in news exposure across counties coming from random variation in the relative channel numbering of the three cable networks (Martin and Yurukoglu, 2017). We provide a number of checks to validate first stage relevance and exogeneity of the instrument. In particular, the instrument (channel position) is uncorrelated with other local characteristics that are predictive of viewership or are predictive of the relevant dimensions of local newspaper content.
According to our estimates, higher cable news network viewership increases the in-
fluence of a network’s content on local newspaper articles. A one standard deviation increase in viewership increases similarity to a network’s content by about one-third of a standard deviation. This result is robust to a number of specification checks, including controls for local demographics, for local cable television market characteristics, and for text readability metrics (e.g. word length).
Recent discussions in media politics have emphasized the potential for cable news to polarize discourse, given that Fox News is relatively right-wing while CNN and (espe- cially) MSNBC are relatively left-wing (e.g. Martin and Yurukoglu, 2017). We explore this issue in our context by comparing heterogeneous effects on newspapers based on their history of candidate endorsements. That is, we split newspapers into three groups:
those who have historically endorsed Democrats, those who have historically endorsed Republicans, and those without or with mixed endorsements. We find that exposure to Fox News (relative to CNN/MSNBC) tends to polarize language: Historically Re- publican newspapers become more conservative (FNC-like), while historically Democrat newspapers become more liberal (CNN/MSNBC-like). Media slant from cable news is selectively contagious, in a way that increases political polarization in local news dis- course.
The findings add to the literature in political science and political economy on biased media (e.g.Ashworth and Shotts,2010;Prat,2018).1 This literature has produced good evidence that mass media have an impact on election outcomes. Gentzkow et al. (2011) report that the opening of local newspapers boosts voter turnout, while Chiang and Knight (2011) show that a newspaper endorsement for a presidential candidate shifts voting intentions in favor of this candidate. For Fox News in particular, DellaVigna and Kaplan (2007) and Martin and Yurukoglu (2017) document that a quasi-experimental increase in exposure leads to higher Republican vote shares. Cable news can affect voter knowledge about political issues (Hopkins and Ladd, 2014; Schroeder and Stone, 2015) as well as fiscal policy decisions (Galletta and Ash, 2019). Outside the US, Enikolopov et al. (2011) find that Russian voters with access to an independent television station are more supportive of anti-Putin parties.2
We contribute to these strands of the literature by studying a potential channel
1For surveys on the empirical and theoretical literature, seePuglisi and Snyder(2015) andGentzkow et al.(2015), respectively.
2SeePrat and Stroemberg (2013) andStroemberg(2015) for surveys on the political effects of mass media.
through which partisan media may affect electoral outputs, policies, and political knowl- edge: local newspapers. Local news have been shown to be important in increasing citizen engagement and allowing citizens to hold their political representatives account- able (e.g. Snyder and Strömberg, 2010). George and Waldfogel (2006) find that the market entry of a national media outlet (in their case the New York Times) causes lo- cal outlets to focus more on local coverage. Martin and McCrain (2019) show that the acquisition of US local TV stations by the national conglomerate owner Sinclair led to an increased share of national as opposed to local content. Similarly, Mastrorocco and Ornaghi (2020) document that these acquisitions by Sinclair lead to lower coverage of local crime and subsequently to lower violent crime clearance rates. We contribute to these debates by analyzing if higher exposure to national cable news changes the slant of local news content.
Methodologically, this research is innovative in its combination of natural language processing, machine learning, and causal inference, extending the use of text data to understand partisan influences in the media. This literature includes Gentzkow and Shapiro(2010), Gentzkow et al. (2019), andAsh et al. (2017), who analyze divisiveness in congressional language. Our paper is the first to combine text-based methods with an instrumental-variables framework to analyze the diffusion of political messaging. The methods could be useful for economists seeking to use text in a causal framework. As detailed below, we address a number of issues in terms of high dimensionality, lack of interpretability, and omitted variable bias.
More broadly, our work contributes to the long-lasting debate on the importance of (un)biased media in democratic politics – a topic that has become especially important in the current era of extreme polarization and increasing inequality in American society.
2. Data
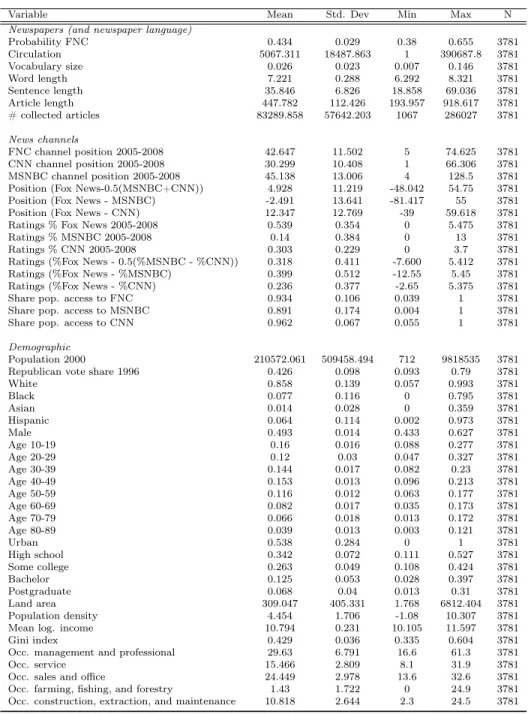
This section enumerates our data sources. The data come from cable news channels and from local newspapers. Our resulting panel is from 2005 through 2008, the years for which we can construct cable news viewership by locality. Summary statistics for all variable are reported in Appendix Table A2.
Figure 1: Example of a local newspaper article snippet
Alameda Times-Star
County outlines ways to lower shelter hostility 8 March 2005
Can Alameda County blunt opposition to current plans to permit emergency homeless shelters at hun- dreds of residential locations in unincorporated com- munities? That appeared likely Monday as county planners suggested ways in which shelters - such as in the land-use game Monopoly - would not automati- cally pass go and neighbors could voice their approval or opposition. [...]
2.1. Local newspaper article excerpts
The first ingredient in our analysis is a corpus of local newspaper articles. Our data source is the news aggregation site NewsLibrary, from which we scraped the headlines and first 80 words of all published articles for various local U.S. newspapers for 2005- 2008. With a set of scripts, we read through the snippets and extract the newspaper name, the title and the plain text of the article, as well as the date. An example of an article snippet is shown in Figure 1. Our main dataset contains 16 million article snippets of on average 80 words each (starting from the beginning of the article) from 305 unique newspaper titles. In the robustness checks, we use a larger dataset of 24 million articles from 682 titles. More information is contained in Appendix C.1.
2.2. News show transcripts for FNC, CNN, and MSNBC
Our second corpus is from the cable news networks. We gather the news show tran- scripts for FNC, CNN, and MSNBC from LexisNexis. The corpus includes transcripts from around 40,000 episodes of prime time shows for the three networks for 2005-2008.
We have a series of scripts that reads through the transcripts and filters out metadata and other non-speech content.
As mentioned, the newspaper article snippets contain approximately the first 80 words of the article. The transcripts tend to be much longer. To make the corpora more comparable, we segment the transcripts into shorter 80-word snippets to match the length of the newspaper article snippets.
2.3. Newspaper-level circulation data
Next, we match each local newspaper outlet to one or more counties. We use audited county-level circulation data from the Alliance for Audited Media, which is available for around 305 unique newspapers (that also appear in the NewsLibrary and the Nielsen channel ratings data). We thus have 3,781 observation units at the newspaper-county level (see Section4) for our main analyses. AppendixC.2describes an alternative match- ing method that results in 682 observation units (that we use for robustness checks).
2.4. Channel positions and viewership
From Nielsen we have data on channel positions and ratings for Fox News Channel, CNN, and MSNBC. These are the same as the data used by Martin and Yurukoglu (2017). First, we have the channel lineup for all the U.S. broadcast operators and the respective zip code areas served. Second, we avail of viewership information representing the share of individuals tuned in to each channel by zip code. This value is proportional to the average number of minutes spent watching a channel per household. As the original data are at the zip code level we follow Galletta and Ash(2019) and aggregate both the ratings and the channel positions at the county level. Specifically, we create county average channel positions weighting the observations by population size in the zip code, while we weight ratings by the number of survey individuals in the zip code according to Nielsen.
2.5. Other demographic covariates
Finally, we have a rich set of demographic covariates from the 2000 census. These variables are measured at the zip code level. To get the aggregate value for the county we weight them by zip code population. Appendix Table A2 lists these variables along with summary statistics.
3. Measuring Media Slant
This section describes how we construct the language measures to be used as outcome variables in our regression analysis. We aim at capturing textual similarity between the newspaper article snippets on the one hand and TV show transcripts on the other. We therefore implement a supervised machine learning approach to predict if newspaper ar- ticle language resembles that from a particular TV station (FNC or CNN and MSNBC).
The approach is related to Gentzkow et al. (2019), who also use a regularized linear model with n-gram inputs.3
3.1. Text pre-processing and featurization
First, we preprocess all texts (newspaper articles and TV station transcripts). We convert them to lower case and remove non-meaningful stopwords (like and or or), all non-letter characters, and extra white-spaces. Second, for each word, we perform stemming (employing the Porter stemming algorithm). Finally, we form bigrams (two- word phrases) from the word stems.
LetM be the set of documents (snippets indexed bym) from the transcripts corpus.
For now, we group CNN and MSNBC together (for notational simplicity, we refer to the CNN/MSNBC label as CNN). Thus the label we will predict is F N Cm: For each transcript snippetm,F N Cm = 1if it comes from a Fox News transcript andF N Cm = 0 otherwise (if it comes from CNN/MSNBC). We produce a balanced sample of documents, with half from Fox, a quarter from CNN, and a quarter from MSNBC.
Let Vk give the vocabulary of bigrams used by a given channelk ∈ {F N C, CN N}.
Let Fkb be the frequency of bigram b on channel k. We construct VF N C and VCN N and then intersect the two, imposing the condition that any bigrambmust appear more than 20 times in both corpora. The resulting set of bigrams is denoted as
V ={b∈VF N C &b ∈VCN N | FF N Cb >20 & FCN Nb >20}
The frequency threshold serves to exclude infrequent bigrams which are highly distinctive for a given channel (such as a moderator’s name or a show name), but carry little substantive political or topical information. This procedure produces a vocabulary V with 65,000 bigrams.
3.2. Classifying transcripts by TV source
Now we will train a machine classifier to predict whether a transcript snippet m comes from FNC or CNN/MSNBC. For evaluating the performance of the classifier, we
3Our different approach reflects a different scientific objective. Gentzkow et al.(2019) are interested in measuring the level of polarization between groups in language. We are interested in forming a predicted probability of the source of a document. Our penalized logistic regression cannot be parallelized by phrase, but it gives better test-sample fit based on our own experiments (Gentzkow et al.(2019) do not report test-set accuracy).
shuffle the corpus and split into 80% training data and 20% test data. We build the classifier in the training set and evaluate its performance in the test set.
We take two steps to further pre-process the features. This is done using the training set to ensure a clean evaluation in the test set. First, we do supervised feature selection to reduce the dimensionality of the predictor matrix. Out of the 65,000-bigram dictionary, we select the 2,000 most predictive features based on their χ2 score for the true label F N C. Second, we scale all predictors in S to variance one (we do not take out the mean, however, as then we would lose sparsity). Let S be the vector of selected and scaled features, indexed by s. LetBsm be the frequency of bigramsin transcript m(and Bm the vector of frequencies for transcript m, of length |S|= 2000).
Our principal classification method is penalized logistic regression (Hastie et al., 2009). We parametrize the probability that a transcript is from Fox News as
\F N Cm = Pr[F N Cm = 1|Bm] = 1
1 + exp(−ψ0Bm)
where ψ is a 2000-dimensional vector of coefficients on each feature. The L1-penalized logistic regression model chooses ψ to minimize the cost objective
J(ψ) =− 1 M∗
M∗
X
m=1
F N Cmlog(\F N Cm) + (1−F N Cm) log(1−\F N Cm)
+λ|ψ| (1) where M∗ gives the number of documents in the training sample.
The rightmost term in Equation (1) is the regularization penalty. We use L1 (Lasso) regularization, as indicated by the L1 norm|·|.4 Lasso mitigates over-fitting of the train- ing set by shrinking coefficients (and setting small ones to zero).5 Regularization strength is calibrated by the hyperparameter λ ≥ 0, selected using five-fold cross-validated grid search in the training set. The optimal penalty in our data is λ∗ = 2, although we got almost identical performance with larger or smaller penalties.
We evaluated classifier performance in the test set, obtaining an accuracy of 0.73 (with a standard deviation of 0.02 across five folds).This performance is much better than guessing (which would produce accuracy = 0.5 in the balanced sample) and comparable
4The L1 norm of a vector is the sum of the absolute values of the vector’s elements.
5We obtained similar prediction accuracy when using an L2 (Ridge) penalty.
Table 1: Test-Set Prediction Performance for Identifying Cable News Source
Predicted CNN Predicted FNC Actual CNN 38.3% (235K) 11.7% (72K) Actual FNC 15.0% (92K) 35.0% (215K)
Notes: Confusion matrix for test-set predictions. Top left gives true positives for the CNN/MSNBC class; bottom right gives true positives for the FNC class; top right gives false negatives for CNN/MSNBC; bottom left gives false negatives for FNC.
with other works in this literature.6 Table 1’s confusion matrix demonstrates the good performance in terms of precision and recall across the two categories. The on-diagonal cells have most of the mass and are quite balanced. Looking at the off-diagonals, we can see that FNC transcripts are somewhat more likely to be classified as CNN (compared to the converse, CNN transcripts being classified as FNC). This error tendency could mean that a subset of FNC transcripts take a straight-news approach (and are classified as CNN).
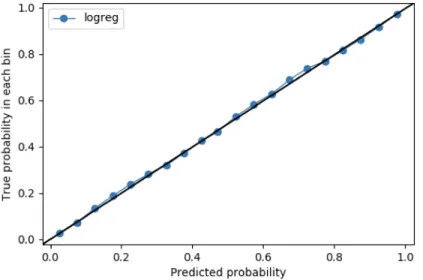
Figure 2 reports the calibration plot for our predictions. The figure shows – for the test set – the binned means (rates) of coming from the Fox News transcripts, conditional on the predicted probability from our model. The 45 degree line indicates how the line would look if the model replicated the distribution in the data – for example, for the set of observations with about 30% predicted probability, we see that about 30% of them are truly from Fox News transcripts. Similarly, this holds for all twenty bins (of 5%
increments). As can be seen in the figure, the fit is remarkably good. The conditional predicted rates are almost perfectly on top of the 45 degree line.
To understand better how the model is making these predictions, we examine the bigram features that are most important for its classification choices. An advantage of logistic regression in this respect is its interpretability: The trained model’s estimated coefficients ψˆ provide a ranking across the 2,000 predictive bigrams in terms of their relative contribution to the predictions. Because the predictors are standardized to the same variance, the coefficients are comparable and roughly interpretable as the relative marginal effect of the associated bigram on the predicted probability that a document
6For example, the prediction accuracy for partisan affiliation in U.K. parliament obtained byPeterson and Spirling(2018): They obtain an accuracy of between 0.6 and 0.8, depending on the time period in the data. Kleinberg et al.(2017) obtain an AUC of .71 in predicting recidivism from criminal defendant characteristics.
Figure 2: Model Predicted Probabilities Accurately Reproduce Test-Set Distribution
Notes: Calibration plot for our predictions. The figure shows – for the test set – the binned means (rates) of coming from the Fox News transcripts, conditional on the predicted probability from our model. The 45 degree line indicates how the line would look if the model replicated the distribution in the data perfectly – for example, for the set of observations with a 30% predicted probability, exactly 30% of them are truly from Fox News transcripts. Similarly, this holds for all twenty bins (of 5%
increments). As can be seen in the figure, the fit is remarkably good. The conditional predicted rates are almost perfectly on top of the 45 degree line.
Table 2: Distinctive phrases associated with Fox News and CNN/MSNBC
FNC CNN/MSNBC
american troop gay communiti crime punish crime alleg immigr author politico report border mexican usmexico border nation economi economi world support gun woman black
Notes: Examples of bigrams with positive (predictive for FNC transcripts) or negative (predictive for CNN/MSNBC) coefficient values in the penalized logistic regression of a label equaling one for FNC snippets (and zero for CNN/MSNBC snippets) on the bigrams used in a snippet.
is from Fox News.
Table 2 shows examples of bigrams with positive (predictive for FNC transcripts) or negative (predictive for CNN/MSNBC) values of ψˆs.7 Fox bigrams allude to intuitively conservative priorities such as the troops, crime, immigration, and guns. CNN/MSNBC bigrams have a more liberal flavor, including mentions of the gay community, women, and minorities. Interestingly, both sets of features include mentions to crime, immigration, and economy. This suggests that the differences in cable-news rhetoric are due in part to framing of topics, rather than just choice of topics.
3.3. Text similarity between newspapers and TV stations
Having validated that our model captures useful information, we can now take it to the newspaper snippets to score their relative similarity to each cable news network.
Let N be the set of newspaper article snippets (indexed by n) and Asn the frequency of predictive bigram sin snippet n. An is the vector of frequencies (of lengthS) for article n. Our prediction ofF N C, \F N C, for snippet n is hence:
\F N Cn = Pr[F N C = 1|An] = 1
1 + exp(−ψˆs0An)
which gives a predicted probability (between zero and one) for how likely each newspaper snippet was generated by Fox News.
Note that, as newspaper article snippets do not come with any label, we cannot evaluate accuracy in predicting newspaper article language. However, we provide some interpretive validation in Appendix C, where we list the news article snippets with the highest and lowestF N C\n. We find that the topical and rhetorical content of the article snippets intuitively reflect intuitions about the ideological commitments of the networks.
In Appendix TableA4, we see that FNC-related articles include defenses of U.S. military involvement in Africa, crime, Bush’s opposition to troop withdrawals, and a Supreme Court case about the Second Amendment (right to bear arms). Articles that are closest to CNN/MSNBC (Appendix TableA5) are about campus groups supporting gay rights, the AIDS crisis in Africa, President Bush’s responsibility for the financial crisis, and HIV in the gay community.
We now have F N C\n as a similarity measure between TV channel language and the
7Appendix TableA1includes a longer list, with 30 bigrams per class.
language in newspaper article n. To link the article-level data to the other datasets at the newspaper level j or the county level i, we aggregate by taking the mean values of the contained news articles. Hence, we define F N C\jik to be the probability (or share) of newspaper j’s snippets to be FNC-like, and likewise F N C\ik for articles in county i, where k indicates state.
3.4. Linked dataset
For the main analysis, we combine our text similarity measures with data on cable news viewership. In our main dataset, there are 305 newspapers circulating in 12.4 counties on average (the median is six counties), resulting in the aforementioned 3,781 observations.
4. Econometric framework
Our main hypothesis is that higher viewership of a cable channel in a county will cause the local newspapers to feature content similar to that channel’s. This section outlines our method to test for this causal relationship.
4.1. Instrumental variables specification
Our main results are at the newspaper-county level (indexed byjik, with j for news- papers, i for county, and k for state). The problem can be formulated as a standard linear regression:
F N C\jik =αk+θFNCViewershipik+Kikβ+Ljikγ+jik (2) where our dependent variable, F N C\jik, is the relative similarity to Fox News for news- paper j issued in county iin a state k. The treatment variable, FNCViewershipik, is the county-level Fox News viewership (averaged over the period 2005 to 2008). In our main analyses, it is specified in relative terms, compared to averaged CNN and MSNBC view- ership.8 We also look at absolute FNC viewership. The regression includes state fixed
8Formally, FNCViewershipikis given by (FNC Viewership - 0.5*(MSNBC viewership+CNN viewer- ship)).
effects (αk), a vector of demographic and cable system controls (Kik), and newspaper- county specific characteristics (Ljik). Finally, jik is the error term. θ is the causal parameter of interest.
There are many political and economic factors that may correlate with both Fox News viewership and the use of Fox News language by local newspapers – in particular, any pre-existing ideological preferences of the county. The potential correlation between FNCViewershipik andjik in (2) would be confounded by these endogenous factors. OLS estimation of this equation is therefore likely to provide biased estimates of θ.
To address this problem, we take an instrumental-variables approach. We require an instrument Zik that is correlated with FNCViewershipik but not with other factors affectingF N C\jik. Inspired byMartin and Yurukoglu(2017), we use cable network chan- nel positioning to construct Zik. In the absolute-position specification, we instrument FNCViewershipik by the ordinal position of FNC in the channel system. In the relative- position specification, viewership is instrumented by the position of Fox News minus the average position of CNN and MSNBC.
We define the first stage regression:
FNCViewershipik =αk+δZik+Kikβ+Ljikγ+ηjik (3) which, combined with Equation (2), can be estimated with two-stage least squares (2SLS) to procure causal estimates for θ.
To facilitate the interpretation of the coefficients, we standardize the instrument, endogenous regressor, and outcome by dividing the original values by the standard devi- ations. All observations are weighted by their circulation. We multiway-cluster standard errors at the county and at the newspaper level.9
4.2. Instrument Validity
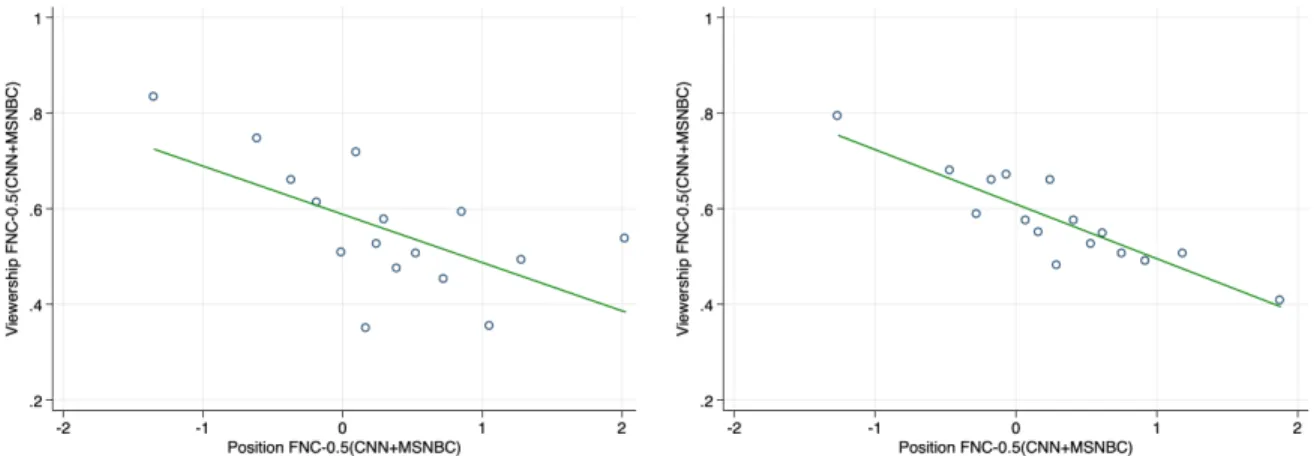
2SLS requires relevance in the first stage. Figure 3 visualizes the first-stage re- lation between the FNC channel position (relative to the averaged position of CNN and MSNBC) and FNC viewership (also relative to CNN/MSNBC). The relationship is strongly negative and similar with (right panel) and without controls (left panel) In the tables below, we report Kleinbergen-Paap cluster-robust first-stage F-statistics.
9We obtain similar results when standard errors are clustered at the state level.
Figure 3: First Stage: Cable Channel Position and Cable News Viewership
Binned scatterplots (16 bins) of standardized viewership of FNC-0.5(CNN+MSNBC) against standardized position of FNC-0.5(CNN+MSNBC). Cross-section with newspaper-county-level observations weighted by newspaper circulation in each county. On the left, state fixed effects are included. On the right, state fixed effects, as well as demographic controls (see Appendix TableA2), channel controls (population share with access to each of the three TV channels), and generic newspaper language controls (vocabulary size, avg. word length, avg. sentence length, avg. article length) are included.
Beyond relevance, 2SLS imposes three requirements for consistent estimates. The first two, exclusion and monotonicity, are not problematic in our context. Exclusion requires that the channel position affects local news reporting only through its effect on cable news viewership. We believe this is a reasonable assumption in our context. The monotonicity assumption is that the channel position influences news viewership in the same direction for all counties. We believe that it is reasonable to assume that increasing the channel position would not systematically increase viewership.
The third assumption, exogeneity, is that Zik is uncorrelated with jik. More con- cretely, we need that the channel position is not endogenously selected with county- specific preferences for conservative or liberal news reporting. The main identification problem is that channel positions could be allocated strategically in response to local factors correlated with conservative news messaging.
Martin and Yurukoglu (2017) provide a detailed discussion and a set of checks sup- porting the exogeneity assumption. Based on qualitative research, they highlight that channel positions have an important arbitrary, historical component, with significant inertia and path dependence. Quantitatively, the instrument is not correlated with Re- publican vote shares before the introduction of Fox News Channel. Galletta and Ash (2019) report a number of additional checks at the county level showing the instrument to be unrelated to demographic characteristics that predict policy preferences or news
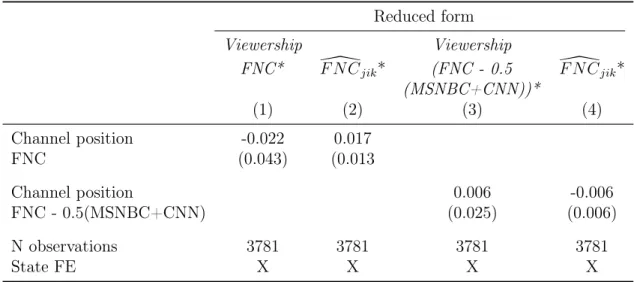
Table 3: Identification checks: Instrument is Uncorrelated with Relevant Covariates
Reduced form Viewership Viewership
FNC* \F N Cjik* (FNC - 0.5 F N C\jik* (MSNBC+CNN))*
(1) (2) (3) (4)
Channel position -0.022 0.017
FNC (0.043) (0.013
Channel position 0.006 -0.006
FNC - 0.5(MSNBC+CNN) (0.025) (0.006)
N observations 3781 3781 3781 3781
State FE X X X X
Notes: Estimates are based on OLS with newspaper-county-level observations weighted by newspaper circulation in the respective county. The dependent variable is the predicted viewership of FNC in column (1), the predicted newspaper language similarity with FNC in columns (2) and (4), and the predicted viewership of FNC relative to averaged MSNBC and CNN viewership in (3). The predictions are derived from regressions that include the full set of demographic controls and state fixed effects. Standard errors are multiway-clustered at the county and at the newspaper level (in parenthesis):
* p<0.1, ** p<0.05, *** p<0.01.
channel viewership.
We apply the same identification checks to the counties in our sample (newspaper- county-level data). As in Galletta and Ash (2019), we use linear regressions with de- mographic characteristics and state fixed effects as covariates to predict viewership and newspaper content. First, we obtain predictions related to viewership: Viewership (FNC- 0.5(MSNBC+CNN))* (FNC viewership minus averaged MSNBC and CNN viewership) andViewership FNC* (Fox News viewership). Second, we form predictions for the prob- ability of newspaper content to be Fox-like: F N C\jik*. In both cases, the asterisk denotes that these variables are linear predictions based on demographics and state fixed effects only. These predictions summarize the variation in viewership and news content that is due to pre-existing cultural, economic, and political characteristics of these counties.
We then regress these predictions on different definitions of our instrumentZik. Table 3shows the results of this identification check. Columns 1 and 2 document that there is no significant relationship between the absolute position of Fox News and the predicted values for viewership or newspaper. Columns 3 and 4 show that there is no significant relationship between relative FNC channel position and the predictions.
As an alternative check for the exogeneity assumption, we produce placebo estimates using newspaper content from before the introduction of Fox News Channel. Specifically,
we estimate 2SLS for our main specifications, but with a different outcome variable:
the predicted text similarity to cable news using local newspaper articles from 1995 and 1996.10 The placebo check estimates, reported in Appendix Table A6, show no significant effects. Reassuringly, there was not a pre-existing Fox-like language dimension in locations that later had a lower Fox channel position.11
Overall, these results support the view that channel positions are not selected or adapted to county characteristics that are otherwise important for our endogenous re- gressor or our outcome. The placebo nulls provide additional support for instrument validity. We therefore have support for the exogeneity assumption and for our 2SLS empirical strategy.
5. Results
This section reports the results. We begin with the main results, which include reduced form and two-stage-least-squares estimates.12 Second, we report robustness checks.
5.1. Main Results
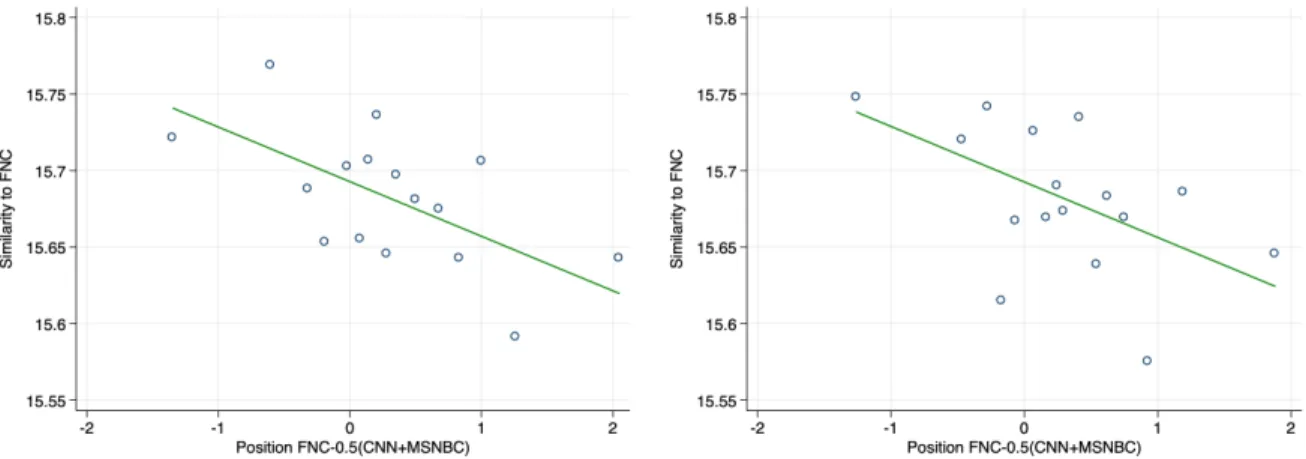
Figure 4 visualizes the reduced-form relationship between the FNC channel posi- tion (relative to the averaged MSNBC and CNN position) and local newspaper content similarity to FNC. In the left part of the Figure, the outcome and the instrument are residualized on state fixed effects. On the right-hand side, we additionally include demo- graphic controls (as listed in Appendix TableA2), channel controls (share of households with access to each of the three channels), and generic newspaper language features (vo- cabulary size, average word length, average sentence length, and average article length).
There is a clear downward relationship, suggesting that easier access to FNC is associated with more FNC-like language in the county’s local newspapers.
10The text similarity scores use the 2005-2008 transcripts (same as above) because FNC and MSNBC did not yet exist in 1995-1996.
11The placebo regressions are based on fewer observations than the main results because some newspa- per titles are not yet available in NewsLibrary in 1995 and 1996. Our main results remain qualitatively similar and are significant at the p<0.01 level if we only use the observations entering the placebo regression.
12As discussed in Section 4, OLS estimates of the relationship between FNC viewership and the presence of FNC-related language in local newspapers do not have a causal interpretation. These are reported in AppendixF.
Figure 4: Reduced Form: Cable News Channel Position and Local Newspaper Content Similarity
Notes: Binned scatterplots (16 bins) of standardized textual similarity with Fox News against standardized position of FNC-0.5(CNN+MSNBC). Cross-section with newspaper-county-level observations weighted by newspaper circulation in each county. On the left, state fixed effects are included. On the right, state fixed effects, as well as demographic controls (see Appendix TableA2), channel controls (population share with access to each of the three TV channels), and generic newspaper language controls (vocabulary size, avg. word length, avg. sentence length, avg. article length) are included.
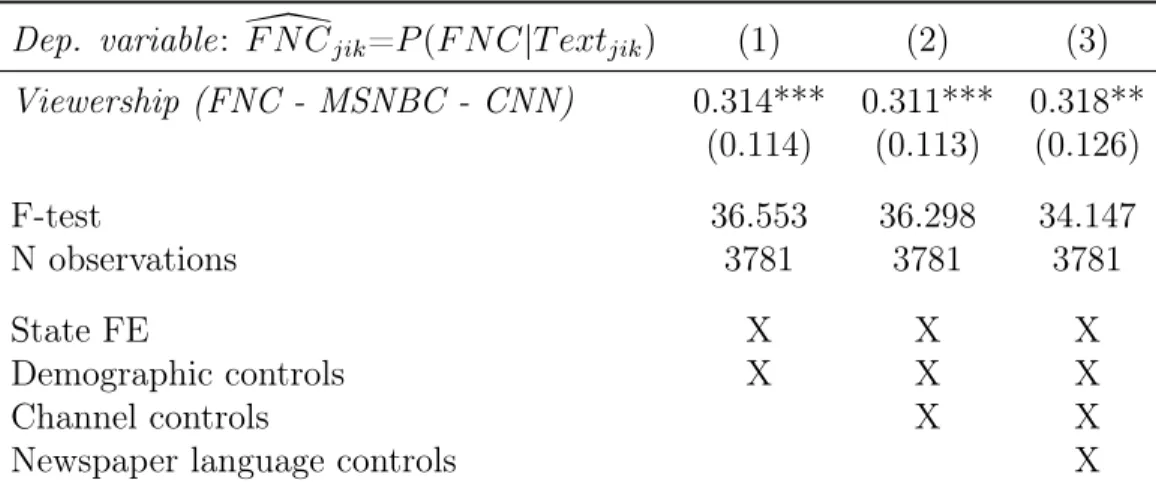
Table4shows two-stage-least-squares estimates of the effect of higher FNC viewership on newspaper language similarity with FNC (the average probability that a snippet from a newspaper is predicted to be from FNC based on the bigrams it contains). The right- hand side variable of interest is instrumented FNC viewership relative to averaged CNN and MSNBC viewership, denoted as Viewership (FNC - MSNBC - CNN)).
All columns include state fixed effects and demographic controls. Column 2 also includes controls for the share of households with potential access to each of the three TV channels. Column 3 additionally controls for generic newspaper language features.
In all three columns, the estimated treatment effects are positive and statistically significant. The magnitudes across columns are highly similar, they range from 0.31 in columns 1 and 2 to 0.32 in colum 3. This means that the channel and language controls do not change the estimates relative to the baseline in column 1 where only state fixed effects and demographic controls are included. All variables are standardized, so the interpretation is as follows: if Fox News viewership (relative to averaged CNN and MSNBC viewership) increases by one standard deviation in county ik where newspaper jik circulates, the similarity of its content with FNC,F N C\jik, increases by 0.31 (0.32).
standard deviations.
These results support the hypothesis that increased exposure to Fox News increases the similarity of language in local newspapers to the language of Fox News. Next, we
Table 4: Cable News Effects on Newspaper Content (2SLS)
Dep. variable: F N C\jik=P(F N C|T extjik) (1) (2) (3) Viewership (FNC - MSNBC - CNN) 0.314*** 0.311*** 0.318**
(0.114) (0.113) (0.126)
F-test 36.553 36.298 34.147
N observations 3781 3781 3781
State FE X X X
Demographic controls X X X
Channel controls X X
Newspaper language controls X
Notes: 2SLS estimates. Cross-section with newspaper-county-level observations weighted by newspaper circulation in each county. The dependent variable is newspaper language similarity with FNC (the average probability that a snippet from a newspaper is predicted to be from FNC):F N C\jik=P(F N C|T extjik).
The right-hand side variable of interest is instrumented FNC viewership relative to averaged CNN and MSNBC viewership: Viewership (FNC - MSNBC - CNN)). All columns include state fixed effects and demographic controls as listed in Appendix TableA2. Column 2 also includes channel controls (population shares with access to each of the three TV channels). Column 3 controls for generic newspaper language features (vocabulary size, avg. word length, avg. sentence length, avg. article length). Standard errors are multiway-clustered at the county and at the newspaper level (in parenthesis): * p<0.1, ** p<0.05,
*** p<0.01.
will run some specification checks and shed light on the mechanisms.
5.2. Specification and Robustness Checks
This section provides a number of specification and robustness checks for the main results on the effect of cable news viewership on newspaper content.
Absolute and Relative FNC Viewership. Appendix Tables A11 to A13 replicate the main results, but using different specifications for the instrument. Instead of FNC viewership relative to CNN and MSNBC viewership combined, we look at FNC viewer- ship relative to CNN and MSNBC separately (Appendix Table A11 for CNN and Ap- pendix TableA17for MSNBC). Appendix Table A13looks at absolute FNC viewership.
Qualitatively, the results are consistent with our main results. All effect estimates enter with positive coefficients, but not all of them are precisely estimated. The instrumented relative viewership measures enter with larger and more precisely estimated coefficients than instrumented absolute viewership. In particular, our main results seem to be driven by higher exposure to FNC relative to MSNBC (more strongly so than relative to CNN).
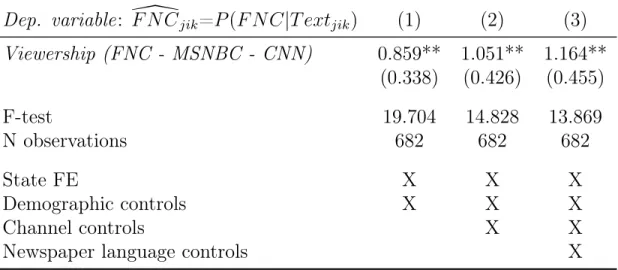
Table 5: Cable News Effects on Newspaper Content (2SLS) – Alternative Matching Procedure
Dep. variable
:
F N C\jik=P
(F N C|T extjik)(1) (2) (3)
Viewership (FNC - MSNBC - CNN)0.859** 1.051** 1.164**
(0.338) (0.426) (0.455)
F-test 19.704 14.828 13.869
N observations 682 682 682
State FE X X X
Demographic controls X X X
Channel controls X X
Newspaper language controls X
Notes: 2SLS estimates. Cross-section with newspaper-level observations weighted their total circula- tion. The dependent variable is newspaper language similarity with FNC (the average probability that a snippet from a newspaper is predicted to be from FNC):F N C\jik=P(F N C|T extjik). The right-hand side variable of interest is instrumented FNC viewership relative to averaged CNN and MSNBC view- ership: Viewership (FNC - MSNBC - CNN)). All columns include state fixed effects and demographic controls as listed in Appendix TableA2. Column 2 also includes channel controls (population shares with access to each of the three TV channels). Column 3 controls for generic newspaper language features (vocabulary size, avg. word length, avg. sentence length, avg. article length). Standard errors are clustered at the state level (in parenthesis): * p<0.1, ** p<0.05, *** p<0.01.
Alternative Matching Procedure. Table 5shows our main specifications, but rely- ing on a different matching of newspapers to counties. We assign each newspaper to a main county based on its name and other metadata. For the circulation, we use more broad-based, but less granular data (Appendix Section C.2). Hence, each newspaper is now only assigned to one county, where its total circulation is assumed to accrue. As Table5shows, with the alternative matching, the coefficients are again highly significant and around three to four times larger than in the main Table4. Appendix TablesA16to A18 confirm the previous finding that the effects are particularly strong for FNC view- ership relative to MSNBC viewership (more so than FNC viewership relative to CNN or absolute FNC viewership).13
Alternative Weighting and Clustering. Appendix Table A14 reproduces Table 4, but with different circulation weights: each county is assigned its respective share of the total circulation of the newspaper across counties. Hence, each newspaper – ranging
13Appendix TablesA16toA18in AppendixJare the alternative matching procedure-based counter- parts to TablesA11toA13in AppendixG.
from the “Butler Bulletin” with a total circulation of around 400 copies to the “Houston chronicle” with around 1.5 million copies – has now a total weight of one in the regression.
With relative weights, the coefficients are still positive, but smaller by a factor of around 2.5 and not significant. We thus conclude that relative circulation weights support our main results in terms of coefficient sign. However, the main results seem to be driven – to a large extent – by giving more weight to more-read newspapers (i.e., adopting a strategy where individual readers are approximated).
Appendix Table A15 I shows our main results again, but with standard errors clus- tered at the state level (instead of multi-way clustered at the county and at the newspaper level). The state-level clustered errors are slightly larger, but the main effects are still significant at the level of p<0.05.
Effects of FNC on Generic Language Features. The politicized nature of the bigrams predictive of FNC versus MSNBC/CNN (see Section 3.2) suggests that it is indeed media slant that spreads from FNC to local newspapers. Alternatively, it could be that more generic (and apolitical) features of the newspaper language change in response to higher FNC exposure. In Appendix Table A19, we do not uncover any statistically significant effect of higher exposure to FNC on generic language features (vocabulary size, average word length, average sentence length, and average article length).14
6. Mechanisms
6.1. Cable News Effects are Larger in Headquarter Counties
Both demand- or supply-driven mechanisms could explain the effects observed in Subsection 5. Newspaper readers, influenced by their cable news consumption, might demand more slanted news content. At the same time, editors or journalists exposed to certain channels may promote similarly slanted content. Without additional assumptions on how news are produced (e.g., where and how editorial decisions are taken or where the journalists are based), it is not possible to conclusively disentangle demand and supply effects. What we can show, however, is that the effects are driven, in particular,
14This null effect is why we include the generic text features as controls in some of our regression specifications. If they had been affected, they would be a “bad control” or “collider”.
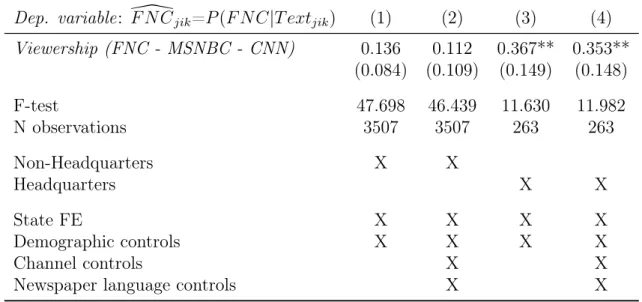
Table 6: Cable News Effect on Local Newspapers is Concentrated in Newspaper Headquarter County
Dep. variable: F N C\jik=P(F N C|T extjik) (1) (2) (3) (4) Viewership (FNC - MSNBC - CNN) 0.136 0.112 0.367** 0.353**
(0.084) (0.109) (0.149) (0.148)
F-test 47.698 46.439 11.630 11.982
N observations 3507 3507 263 263
Non-Headquarters X X
Headquarters X X
State FE X X X X
Demographic controls X X X X
Channel controls X X
Newspaper language controls X X
Notes: 2SLS estimates. Cross-section with newspaper-county-level observations weighted by newspaper circulation in each county. The dependent variable is newspaper language similarity with FNC (the average probability that a snippet from a newspaper is predicted to be from FNC):F N C\jik=P(F N C|T extjik). The right-hand side variable of interest is instrumented FNC viewership relative to averaged CNN and MSNBC viewership:Viewership (FNC - MSNBC - CNN)). Columns (1) and (3) include state fixed effects and demographic controls as listed in Appendix TableA2. Columns (2) and (4) additionally include channel controls (population shares with access to each of the three TV channels), and controls for generic newspaper language features (vocabulary size, avg. word length, avg.
sentence length, avg. article length). Standard errors are multiway-clustered at the county and at the newspaper level (in parenthesis): * p<0.1, ** p<0.05, *** p<0.01.
by the newspaper-county observations where the county coincides with the newspaper headquarters.
Table 6reports the 2SLS coefficients based on reduced samples where we either only consider newspaper-county observations where the county does not coincide with where the immediate owner of the newspaper is based (columns 1 and 2) or only headquarter newspaper-county observations (columns 3 and 4). For example, consider “The York Dispatch”, which serves the counties York, Lancaster, Dauphin, and Adams. It is based in York County.15 In columns 1 and 2 of Table 6, we exclude headquarter counties such as York County in this example (but keep Lancaster, Dauphin, and Adams). In columns 1 and 3, we only include demographic controls, while we also add channel and language controls in columns 2 and 4.
The results suggest that our observed effects are concentrated in headquarter coun- ties. The coefficient signs for non-headquarter counties (columns 1 and 2) are positive
15We assign the city where theimmediate owner of the local newspaper is based – according to the Alliance for Audited Media – to a U.S. county. That is, we do not consider the location of the parent company for newspapers that are owned by a conglomerate.
but smaller (by a factor of two to three) and not statistically significant. In columns 3 and 4, where we look at headquarter counties, the coefficients are larger than the main results (around 11% larger) and statistically significant with p<0.05.
6.2. Cable News Media Slant Polarizes Local Newspapers
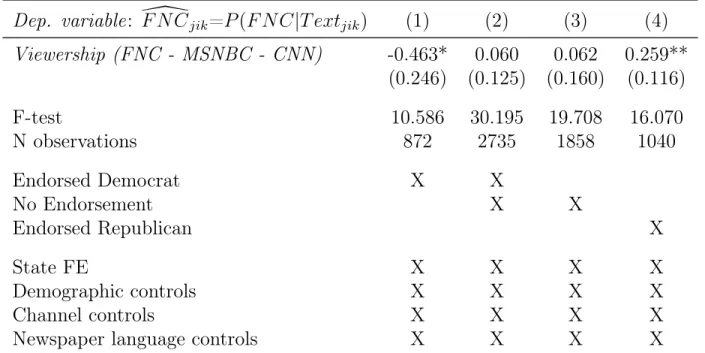
Next, we investigate effect heterogeneity with respect to Presidential endorsements of newspapers in the pre-FNC era. To that end, we distinguish three groups of newspapers based on the 1996 U.S. presidential election endorsements: (1) those that endorsed the Republican candidate Bob Dole, (2) those that endorsed the Democrat candidate Bill Clinton, and (3) those that did not endorse either candidate.16 We think of endorsements as a signal for whether the pre-FNC political leaning of a newspaper was relatively conservative or liberal. The non-endorsers can be seen as politically neutral.
Table 7 shows the heterogeneity analysis. As with the main results, we focus on instrumented FNC viewership relative to averaged CNN and MSNBC viewership: View- ership (FNC - MSNBC - CNN)). All columns include our demographic, channel, and language controls. The difference is subsetting by groups of newspapers according to pre-FNC endorsements.
In column 1, we subset on newspapers that endorsed the Democrat candidate. The negative coefficient suggests that newspapers with a more liberal leaning (according to our measure) become less FNC-like in their reporting, the more exposed they are to FNC (relative to MSNBC and CNN). Conversely, in column 4, for newspapers with a conservative leaning, we see a statistically significant positive effect. Meanwhile, when looking at newspapers with no endorsements (column 3) or combining the Democrat- and null-endorsers (column 2), there is no effect of cable media slant on newspaper content.
Taken together, these estimates provide some evidence that higher exposure to FNC relative to CNN/MSNBC (or vice versa) leads to more polarized local newspaper lan- guage. Newspapers with a right-wing partisan leaning in the pre-FNC era become more right-wing in response to FNC viewership increases. Instead, left-wing papers become more left-wing. This could be due to a market positioning effect, where the conserva- tive papers situate themselves to accommodate FNC-viewer news preferences. In turn, liberal papers respond and situate to accommodate non-FNC-viewer news preferences.
16In this latter group we include newspapers where we could not find an explicit endorsement.
Table 7: Cable News Exposure Tends to Polarize Local Newspaper Content
Dep. variable
:
F N C\jik=P
(F N C|T extjik)(1) (2) (3) (4)
Viewership (FNC - MSNBC - CNN)-0.463* 0.060 0.062 0.259**
(0.246) (0.125) (0.160) (0.116)
F-test 10.586 30.195 19.708 16.070
N observations 872 2735 1858 1040
Endorsed Democrat X X
No Endorsement X X
Endorsed Republican X
State FE X X X X
Demographic controls X X X X
Channel controls X X X X
Newspaper language controls X X X X
Notes: 2SLS estimates. Cross-section with newspaper-county-level observations weighted by newspaper circulation in each county.
The dependent variable is newspaper language similarity with FNC (the average probability that a snippet from a newspaper is predicted to be from FNC):F N C\jik=P(F N C|T extjik). The right-hand side variable of interest is instrumented FNC viewership relative to averaged CNN and MSNBC viewership:Viewership (FNC - MSNBC - CNN)). In column 1 we only consider newspapers that endorsed the Democratic Presidential candidate in 1996 (the pre-FNC era). Column 2 includes newspapers that endorsed the Democratic candidate or did not endorse either candidate (or for which endorsement data is not available). In column 3, we focus on newspapers that did not endorse either candidate (or for which endorsement data is not available). Column 4 considers only newspapers that endorsed the Republican candidate. All columns include state fixed effects, demographic controls as listed in Appendix TableA2, channel controls (population shares with access to each of the three TV channels), and generic newspaper language features (vocabulary size, avg. word length, avg. sentence length, avg. article length). Standard errors are multiway- clustered at the county and at the newspaper level (in parenthesis): * p<0.1, ** p<0.05, *** p<0.01.
7. Conclusion
This research analyzes the causal effect of partisan cable television news content on local printed newspaper content. Using a regularized prediction of whether text comes from Fox News or from competing networks (CNN/MSNBC), we show that exposure to Fox News Channel in the market of a local newspaper increases the linguistic similarity of the newspaper content to Fox News shows, relative to shows on other news networks.
Cable news content influences local news content. Our results add to the literature on the political effects of biased news. We provide new evidence on how partisan media influence not just voting and policy, but also discourse. This means that previous estimates of effects of media could be measuring not just direct effects on primary media consumers, but also indirect effects through diffusion into secondary media sources.
References
Ash, E., Morelli, M., and Van Weelden, R. (2017). Elections and divisiveness: Theory and evidence. Journal of Politics.
Ashworth, S. and Shotts, K. W. (2010). Does informative media commentary reduce politicians’ incentives to pander? Journal of Public Economics, 94(11-12):838–847.
Chiang, C.-F. and Knight, B. G. (2011). Media bias and influence: Evidence from newspaper endorsements. Review of Economic Studies, 78(3):795–820.
DellaVigna, S. and Kaplan, E. (2007). The fox news effect: Media bias and voting. The Quarterly Journal of Economics, 122(3):1187–1234.
Enikolopov, R., Petrova, M., and Zhuravskaya, E. (2011). Media and political persuasion:
Evidence from Russia. American Economic Review, 101(7):3253–3285.
Galletta, S. and Ash, E. (2019). How cable news reshaped local government. Technical report, SSRN.
Gentzkow, M. and Shapiro, J. M. (2010). What drives media slant? evidence from us daily newspapers. Econometrica, 78(1):35–71.
Gentzkow, M., Shapiro, J. M., and Sinkinson, M. (2011). The effect of newspaper entry and exit on electoral politics. American Economic Review, 101(7):2980–3018.
Gentzkow, M., Shapiro, J. M., and Stone, D. F. (2015). Media bias in the marketplace:
Theory. In Anderson, S. P., Waldfogel, J., and Stroemberg, D., editors,Handbook of Media Economics, volume 1, pages 623–645. North-Holland.
Gentzkow, M., Shapiro, J. M., and Taddy, M. (2019). Measuring group differences in high-dimensional choices: Method and application to congressional speech. Econo- metrica, 87(4):1307–1340.
George, L. M. and Waldfogel, J. (2006). The new york times and the market for local newspapers. American Economic Review, 96(1):435–447.
Hastie, T., Tibshirani, R., and Friedman, J. (2009). The Elements of Statistical Larning.
Springer, New York, NY.
Hopkins, D. J. and Ladd, J. M. (2014). The consequences of broader media choice:
Evidence from the expansion of Fox News. Quarterly Journal of Political Science, 9(1):115–135.
Kleinberg, J., Lakkaraju, H., Leskovec, J., Ludwig, J., and Mullainathan, S. (2017).
Human decisions and machine predictions. The Quarterly Journal of Economics, 133(1):237–293.
Martin, G. and Yurukoglu, A. (2017). Bias in cable news: Persuasion and polarization.
American Economic Review.
Martin, G. J. and McCrain, J. (2019). Local news and national politics. American Political Science Review, 113(2):372–384.
Mastrorocco, N. and Ornaghi, A. (2020). Who Watches the Watchmen? Local News and Police Behaviour in the United States. Technical report, Trinity Economics Papers.
Peterson, A. and Spirling, A. (2018). Classification Accuracy as a Substantive Quan- tity of Interest: Measuring Polarization in Westminster Systems. Political Analysis, forthcoming.
Prat, A. (2018). Media power. Journal of Political Economy, 126(4):1747 – 1783.
Prat, A. and Stroemberg, D. (2013). The Political Economy of Mass Media, volume 2 of Econometric Society Monographs, page 135–187. Cambridge University Press, Cam- bridge, UK.
Puglisi, R. and Snyder, J. M. (2015). Empirical studies of media bias. In Anderson, S. P., Waldfogel, J., and Stroemberg, D., editors, Handbook of Media Economics, volume 1, pages 647–667. North-Holland.
Schroeder, E. and Stone, D. F. (2015). Fox news and political knowledge. Journal of Public Economics, 126:52–63.
Snyder, J. M. and Strömberg, D. (2010). Press coverage and political accountability.
Journal of Political Economy, 118(2):355–408.
Stroemberg, D. (2015). Media and politics. Annual Review of Economics, 7:173–205.
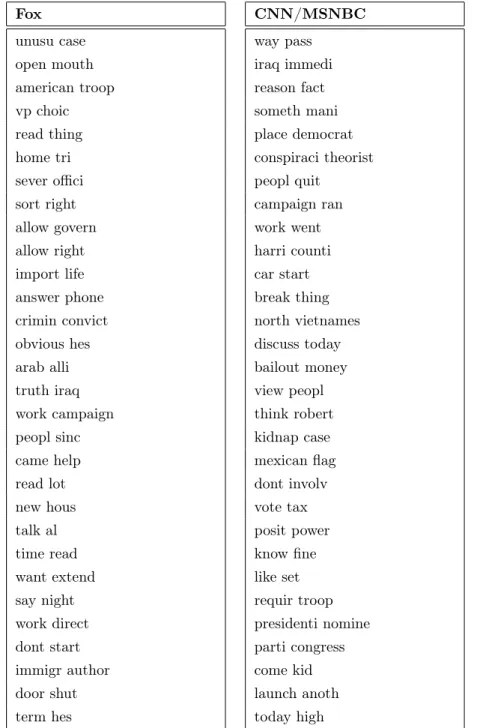
A. Bigrams most predictive for FNC or CNN/MSNBC
Table A1 lists the 30 bigrams which are most predictive for a transcript being from FNC or CNN/MSNBC, respectively. Specifically, we list the bigrams with the largest absolute coefficients in the logistic regression described in Section 3. Coefficients are positive for FNC and negative for CNN/MSNBC.
Table A1: Top 30 of bigrams predictive for FNC or CNN/MSNBC transcripts
Fox
unusu case open mouth american troop vp choic read thing home tri sever offici sort right allow govern allow right import life answer phone crimin convict obvious hes arab alli truth iraq work campaign peopl sinc came help read lot new hous talk al time read want extend say night work direct dont start immigr author door shut term hes
CNN/MSNBC
way pass iraq immedi reason fact someth mani place democrat conspiraci theorist peopl quit
campaign ran work went harri counti car start break thing north vietnames discuss today bailout money view peopl think robert kidnap case mexican flag dont involv vote tax posit power know fine like set requir troop presidenti nomine parti congress come kid launch anoth today high
B. Summary Statistics
Table A2: Summary Statistics
Variable Mean Std. Dev Min Max N
Newspapers (and newspaper language)
Probability FNC 0.434 0.029 0.38 0.655 3781
Circulation 5067.311 18487.863 1 390687.8 3781
Vocabulary size 0.026 0.023 0.007 0.146 3781
Word length 7.221 0.288 6.292 8.321 3781
Sentence length 35.846 6.826 18.858 69.036 3781
Article length 447.782 112.426 193.957 918.617 3781
# collected articles 83289.858 57642.203 1067 286027 3781
News channels
FNC channel position 2005-2008 42.647 11.502 5 74.625 3781
CNN channel position 2005-2008 30.299 10.408 1 66.306 3781
MSNBC channel position 2005-2008 45.138 13.006 4 128.5 3781
Position (Fox News-0.5(MSNBC+CNN)) 4.928 11.219 -48.042 54.75 3781
Position (Fox News - MSNBC) -2.491 13.641 -81.417 55 3781
Position (Fox News - CNN) 12.347 12.769 -39 59.618 3781
Ratings % Fox News 2005-2008 0.539 0.354 0 5.475 3781
Ratings % MSNBC 2005-2008 0.14 0.384 0 13 3781
Ratings % CNN 2005-2008 0.303 0.229 0 3.7 3781
Ratings (%Fox News - 0.5(%MSNBC - %CNN)) 0.318 0.411 -7.600 5.412 3781
Ratings (%Fox News - %MSNBC) 0.399 0.512 -12.55 5.45 3781
Ratings (%Fox News - %CNN) 0.236 0.377 -2.65 5.375 3781
Share pop. access to FNC 0.934 0.106 0.039 1 3781
Share pop. access to MSNBC 0.891 0.174 0.004 1 3781
Share pop. access to CNN 0.962 0.067 0.055 1 3781
Demographic
Population 2000 210572.061 509458.494 712 9818535 3781
Republican vote share 1996 0.426 0.098 0.093 0.79 3781
White 0.858 0.139 0.057 0.993 3781
Black 0.077 0.116 0 0.795 3781
Asian 0.014 0.028 0 0.359 3781
Hispanic 0.064 0.114 0.002 0.973 3781
Male 0.493 0.014 0.433 0.627 3781
Age 10-19 0.16 0.016 0.088 0.277 3781
Age 20-29 0.12 0.03 0.047 0.327 3781
Age 30-39 0.144 0.017 0.082 0.23 3781
Age 40-49 0.153 0.013 0.096 0.213 3781
Age 50-59 0.116 0.012 0.063 0.177 3781
Age 60-69 0.082 0.017 0.035 0.173 3781
Age 70-79 0.066 0.018 0.013 0.172 3781
Age 80-89 0.039 0.013 0.003 0.121 3781
Urban 0.538 0.284 0 1 3781
High school 0.342 0.072 0.111 0.527 3781
Some college 0.263 0.049 0.108 0.424 3781
Bachelor 0.125 0.053 0.028 0.397 3781
Postgraduate 0.068 0.04 0.013 0.31 3781
Land area 309.047 405.331 1.768 6812.404 3781
Population density 4.454 1.706 -1.08 10.307 3781
Mean log. income 10.794 0.231 10.105 11.597 3781
Gini index 0.429 0.036 0.335 0.604 3781
Occ. management and professional 29.63 6.791 16.6 61.3 3781
Occ. service 15.466 2.809 8.1 31.9 3781
Occ. sales and office 24.449 2.978 13.6 32.6 3781
Occ. farming, fishing, and forestry 1.43 1.722 0 24.9 3781
Occ. construction, extraction, and maintenance 10.818 2.644 2.3 24.5 3781