Humboldt-Universität zu Berlin
A Bibliometric Analysis of the Publications of the Cluster of Excellence Image Knowledge Gestaltung in
the Context of Research Assessment
Zur Erlangung des akademischen Grades Master of Arts
Philosophische Fakultät I
Institut für Bibliotheks- und Informationswissenschaft
Vorgelegt von: Tahsin Özdemir
Gutachter:
Prof. Dr. Michael Seadle
Alexander Struck, MA
Table of Contents
Table of Contents ... I List of Figures ... III List of Tables ... IV
1. Introduction ... 1
2. Bibliometrics in Research assessment ... 4
2.1. Citations ... 7
2.2. H-index... 8
3. Arguments against quantitative Indicators in Research Assessment ... 9
4. Data Collection and Processing ... 14
4.1 Selecting the Citation Databases ... 15
4.2. Queries and Variables ... 22
4.3 Data Cleansing ... 26
5. Bibliometric Analysis ... 31
5.1. Publications ... 32
5.1.1. Publication per year ... 32
5.1.2. Publications per Publication Format ... 33
5.1.3. Publications per Research Field ... 34
5.2. Coverage ... 36
5.2.1. Total Coverage ... 36
5.2.2. Coverage per year ... 37
5.2.3. Coverage of Research Field ... 38
5.2.4. Coverage per Publication Format ... 40
5.2.5. Coverage of Authors ... 41
5.3. Citation Analysis ... 42
5.3.1. Descriptive Data ... 43
5.3.2. Citation Rates ... 45
5.4. H-index Analysis ... 48
5.4.1. H-index GS ... 48
5.4.2. H-index WoS ... 49
5.5. Discussion ... 49
6. Conclusion ... 52
7. Bibliography ... 55
8. Attachment ... 60
List of Figures
Figure 1: Composition of disciplines in the publication list of the research center BWG ... 17
Figure 2: Proportion of research fields in the publication lists ... 18
Figure 3: Publication types covered in GS and WoS in a coverage study by Belew, R. ... 19
Figure 4: Proportion of publication formats in the publication lists ... 20
Figure 5: Profile of Peter Fratzl in Google Scholar (Screenshot ) ... 28
Figure 6: Author identifier search option in Web of Science (screenshot)... 29
Figure 7: Exact-match-option using the h-index calculator in Google Scholar (Screenshot) .. 30
Figure 8: Publication output per year ... 33
Figure 9: Proportions of publications formats in the data set ... 34
Figure 10: Publications per year splittet into the three main research categories ... 35
Figure 11: Pie chart visualizing the degree of coverage in Google Scholar ... 37
Figure 12: Publication covered in GS per year ... 38
Figure 13: Coverage of the publications distinguished by the three research categories ... 39
Figure 14: Coverage in GS per publication format ... 40
Figure 15: Boxplot of the citation variable ... 44
Figure 16: Citations (mean) per research field ... 45
Figure 17: Citations (mean) per year ... 46
Figure 18: Citations in total per year ... 46
Figure 19: Citation rate curves for the three research field categories ... 47
Figure 20: The mean value of the h-indices per research field for the data from GS ... 48
Figure 21: The mean value of the h-indices per research field for the data from WoS ... 49
List of Tables
Table 1: Publication output per year ... 32
Table 2: Publication per year distinguished by type of publication ... 33
Table 3: Publication per research field ... 35
Table 4 Coverage of the BWG publication data in Google Scholar ... 36
Table 5: Publication coverage in GS (total) per year ... 37
Table 6: Research fields of the BWG publications covered in Google Scholar... 39
Table 7: Descriptive statistics with the transformed author variable ... 41
Table 8: Authors covered in Google Scholar ... 42
Table 9: Authors covered in Web of Science ... 42
Table 10: Descriptive statistics with the citation variable ... 43
Table 11: Citation numbers higher than zero (> 0)... 44
1. Introduction
This thesis presents bibliometric data of the Cluster of Excellence (Cluster) “Image Knowledge Gestaltung. An interdisciplinary Laboratory” (BWG)1. In order to conduct a bibliometric anal- ysis, this study attempts to measure the coverage of the publications of the Cluster in the citation databases Google Scholar (GS) and Web of Science (WoS). The question arises, if the publica- tions of BWG are covered extensively enough in citation databases, to assess the research center with bibliometric indicators. The purpose of this thesis is to provide insights of the research performance of the Cluster by analyzing the publication data with bibliometric calculations.
In order to have a broader basis to answer the research question, information about the coverage of h-indices are provided for the respective authors in the publication lists in two citation data- bases Google Scholar and in Web of Science. Beside the coverage of h-indices, the actual values for every author in the publication lists will be used to calculate the h-indices with other varia- bles in the data set.
As this thesis will show, I claim, that bibliometric indicators should not be used in an evaluation process of the Cluster of Excellence BWG with the expiration of the Excellence Initiative, but present arguments, when such quantitative indicators can be used to assess research perfor- mance. One reason for the negligence of bibliometric indicators is the potential unavailability of accurate bibliometric data in citation databases. I will not only support my thesis with bibli- ometric results of the research output, but also discuss the negative aspect of quantitative indi- cators in research assessment by citing critical sources regarding this active debate in research policy. There are debates about the applicability and the usefulness of bibliometric indicators in research assessment, especially in certain research areas (Bornmann 2015).
One crucial part of this thesis consists of a coverage study of the publications and the h-indices in the two citation databases Google Scholar and Web of Science, for an adequate coverage in academic databases is a precondition for the retrieval of bibliometric indicators. Therefore, this study answers the question to what extend the publications of this young research cluster are covered in Google Scholar, in order to be able to conduct bibliometric analyzes. Since it has become a standard in many research fields to enrich peer reviews with bibliometrics, the negli- gence of these indicators must follow proven and comprehensive logic.
1The German title of this Cluster is “Bild Wissen Gestaltung. Ein interdisziplinäres Labor”
These quantitative indicators, in this case bibliometric indicators enhance a peer review assess- ment to a so-called informed peer review (Jansen 2015). A general use of bibliometrics in re- search evaluation will be discussed in chapter 3.
For the extraction of bibliometric information, a citation database has to be chosen. In a follow- ing separate chapter, I will discuss why I used Google Scholar and Web of Science for the retrieval of bibliometric indicators. Since I have worked as a student assistant in the internal research library in the time during my master-thesis, I backed up my examination with the man- agement and the editorial staff of the research cluster, especially with regard to the provided publication lists. The bibliometric analysis is based on the publication list of the editorial de- partment. During my research, the management of the cluster taught me details and background knowledge about ongoing evaluation processes.2
First, I provide basic information about the young research cluster Image Knowledge Gestal- tung in the light of the Excellence Initiative and the evaluation process. Then a discussion about the right measurement of research performance follows. Since there are several approaches to measure the impact and performance of research, the main measurements with quantitative and qualitative indicators are analyzed concerning the right evaluation method of an interdiscipli- nary research cluster.
After that, I will focus on bibliometric numbers and information using Google Scholar. In effect, there are some studies conducted, comparing the coverage and the extraction of bibliometric information of different citation databases, such as Thomson Reuter’s Web of Science and Else- vier’s Scopus (Falagas 2007). I will argue, why Google Scholar can be used for this investiga- tion in contrast to the other databases.
Furthermore, when it comes to the researcher’s h-indices, a comparative examination between the results of Google Scholar and Web of Science will be presented. I will show, that Google Scholar provides more data concerning the h-index. To calculate the h-index with GS data, I have used an h-index calculator, which is a software tool for Internet browsers (Ianni, G. et al.
2010).
In the following chapter, I describe in detail the methods and approaches for this examination.
The two main sources of data are the publication list and the staff list of the research cluster.
One important factor of bibliometrics for research evaluation is the calculation of weighted citation rates. For this purpose, I calculate the citation rate with the retrieved data for each dis- cipline for the given years. This must be done, in order to be able to compare the research performance of the different disciplines with each other.
“It is expected that science is at least likely to cite work in the distant past with the social sci- ences next, and the arts and humanities are expected to be most likely to cite from the older literature”
(Barnett 1999)
As this quotation by Barnett shows, a closer look at the citations per discipline is necessary to compare the different citation rates with each other. Also, with regard to the usefulness of bib- liometric indicators for an evaluation, citation rates gain further weight, when considering the interdisciplinary composition of the research cluster and the relative short time frame of three years of publication data.
But beforehand, a general data evaluation will be provided with every variable of the calculation table, in order to understand the composition of the interdisciplinary research cluster and decide which citation database to use.
BWG is only one of four Cluster of Excellence of the Humboldt-University of Berlin (Hum- boldt Universität zu Berlin 2016), in the context of the Excellence Initiative. The Excellence Initiative is a German national research-funding project with the purpose to fund excellent re- search. The following quote taken from the website of the German national funding Organiza- tion Deutsche Forschungsgemeinschaft (DFG) explains the main principle behind this concept:
“The Excellence Initiative aims to promote top-level research and to improve the quality of German universities and research institutions in general, thus making Germany a more attrac- tive research location, making it more internationally competitive and focusing attention on the outstanding achievements of Germany universities and the German scientific community”
(Deutsche Forschungsgemeinschaft 2016a)
An important part of Excellence Initiative is the so-called Clusters of Excellence (in German:
Excellenzcluster). The DFG further explains the concept Cluster of Excellence:
“Clusters of Excellence will enable German university locations to establish internationally visible, competitive research and training facilities, thereby enhancing scientific networking and cooperation among the participating institutions. Clusters of Excellence should form an important part of a university's strategic and thematic planning, significantly raise its profile and reflect its considered long-term priorities.
They should also create excellent training and career conditions for young researchers. In con- junction with the other two funding lines, i.e. graduate schools and institutional strategies to promote top-level research, clusters of excellence will help to increase Germany's attraction as a research location in the long term and improve its international competitiveness”
(Deutsche Forschungsgemeinschaft 2016b)
Basis of this examination are the publication lists of the Cluster BWG from 2012/13 to 2015 for a bibliometric analysis. Since this research center has been established in November 2012 the first publication list comprises 2012 and 2013.
The main tables and figures are incorporated in this examination. Additional tables are attached to this work. All calculation tables used for this study are provided on external medium.
2. Bibliometrics in Research assessment
In this chapter, I consult arguments from different scholars concerning the use of bibliometric indicators for research assessment. Also, the benefits of citation databases are discussed, in the light of reliability and coverage of publication data for evaluations.
“Governments need systematic evaluations for optimizing their research allocations, reorient- ing their research support, rationalizing research organizations, restructuring research in partic- ular fields, or augmenting research productivity” (Moed 2009)
This quote by Moed indicates the importance of research evaluations for the allocation of re- search funds, with respect to the effectiveness of research policy. The question arises, which method to use, in order to get the best results for research assessment.
Since there is no standard for the evaluation of research success with quantitative indicators in Germany, but rather recommendations by funding organizations, such as the Wissenschaftsrat (WR), each research center is evaluated differently. Only the research institutes of the Max Planck Society do have a system “partly based on metrics” (Abbott 2010), but still there is no standard system for the measurement of research performance.
There is an ongoing debate about the use of quantitative indicators in Germany, concerning the measurement of research performance. Germany, unlike other nations in Europe, focuses on the amount of third-party funds as the main quantitative indicator in research assessment. Whereas other countries, mostly from correspondent national funding organizations, use this indicator as
an additional metric, in Germany the third-party fund dominates the debate about quantitative indicators in research assessment (Jansen 2015).
However, there are more and more experts, who strongly recommend using bibliometric indi- cators, in order to measure research performance. For example, Jürgen Gerhards, who works for the Berlin Brandenburgische Akademie der Wissenschaften (BBAW), recommends using more bibliometrics instead of the third-party fund indicator, because it would redress the unjus- tifiable allocation of funds for different research disciplines (Gerhards 2013).
Bibliometrics have become an increasing method to measure research quality. In natural sci- ences for example, it has become a widespread standard and even in the humanities bibliometric starts to gain greater importance, in particular with respect to budget cutting by the funding organizations. However, in Arts and the humanities bibliometric is not as common as in the life- and natural sciences (Bornman 2015).
“Die meisten international vergleichenden Evaluationsverfahren beziehen sich entsprechend in erster Linie auf Publikationen als zentraler Einheit zur Messung von Forschungsleistungen.
Und sie orientieren sich an der Resonanz von Publikationen, wie sie sich in Zitationen manifestieren” (Gerhards 2013).
Still the quotation above shows, that most of the international evaluation systems in research policy relate to the measurement of publications and their citations. The only alternative, when avoiding all quantitative indicators, also bibliometrics, in research assessment would be the peer review evaluation. In fact, peer review is “the most important instrument for assessing scientific work” (Bornmann 2008).
But also, this traditional evaluation method has disadvantages. Opponents of peer review eval- uations often point out to the “complex and expensive and subjective qualitative peer review evaluation processes” (Kostoff 1998).
That is one reason, why quantitative indicators gradually get more awareness in research as- sessment. In Germany, however, the main quantitative indicator is still the third-party-fund- indicator. An often-cited argument for the use of the third-party fund indicator is the fact that project applications must go through an evaluative and critical process until the funding organ- izations accept them. Nevertheless, bibliometric indicators gain more and more awareness, also in Germany and slowly also in research fields of the arts and humanities (Bornmann et al. 2015).
The question arises, which metric should be used to measure research performance and impact.
Whereas publication productivity can simply be measured be publication counts, the so-called impact of publications is far more elaborate to measure. The following quote by Moed, intro- duces the most common method in bibliometrics, namely the citation analysis:
“Citation analysis involves the construction and application of a series of indicators of the “im- pact”, “influence”, or “quality” of scholarly work, derived from citation data, i.e. data on refer- ences cited in footnotes or bibliographies of scholarly research publications.” (Moed 2009) As this quote explains bibliometricians analyze the citations of publications by building cita- tion-based indicators and evaluated these numbers with statistical calculations. The motivation is to provide bibliometric indicators to enhance a peer review evaluation to a so-called informed peer review (Ochsner et al. 2014).
Also, the German Wissenschaftsrat (WR) recommends using informative peer reviews for re- search field from the humanities and arts:
“Dieses informed peer review ist sowohl einer reinen Reputationsbewertung als auch einer automatisierten indikatorenbasierten Bewertung vorzuziehen, da einerseits durch die Indikatorenbasis rein subjektive (Vor-) Urteile auf den Prüfstand gestellt werden und andererseits eine Einordnung und mögliche Relativierung der für sich genommen nicht immer hinreichend aussagekräftigen Indikatoren durch Fachleute stattfindet.”
(Wissenschaftsrat 2011)
This is in fact the main issue of concern, because it is necessary to find the right evaluation method. As Moed (2009) states, “the future of research assessment lies in the intelligent mixture of metrics (including bibliometric indicators) and peer review.” He goes on to claim, that policy makers, committees, who are responsible for peer reviews and bibliometricians should work together, in order to develop new methods for research assessment, which combine qualitative and quantitative indicators (Moed 2009). The following citation by Bornmann criticizes the focus on one single indicator and stresses the importance of the different aspects of performance and impact in research assessment:
“Several indicators are necessary in order to illuminate different aspects of performance and to provide a more adequate and multifaceted picture of reality” (Bornmann 2007).
In fact, for the assessment of research performance of this relative young Cluster of Excellence BWG, the right mixture must be found to ensure an evaluation, which addresses the interdisci-
plinary character of this research center. When we consider the strong representation of disci- plines from the arts and humanities and the sciences in the interdisciplinary composition of the Cluster, the question arises, which assessment method will be best to measure the impact of the research output. This aspect is not only one subject of this thesis, but will also be discussed critically in the next chapter, together with a critical view on quantitative indicators in research assessment.
But first, the main metrics retrieved from the citation databases Google Scholar and Web of Science should be introduced, since they belong to the most important bibliometric indicators for the measurement of research impact.
2.1. Citations
Since the start of bibliometrics as a research method, citations counts are the most important metrics. Citation count is the basis for a number of citation based-indicators, like citation rates or the h-index (Ball and Tunger 2005). In evaluative bibliometrics they are the foremost indi- cators for research assessment (Wang 2013). Even, as mentioned, the excessive use of this in- dicator and its validness for measuring the impact of academic publications is controversially debated among experts (De Bellis 2009). For example, as I will discuss in the next chapter, the context of citations is not always clear or because the numbers must be taken from citation databases, which must have the publication covered first, before they can be used by experts and bibliometricians. Nevertheless, the counting of citations is a simple metric from the refer- ences in the bibliographies or foot- and endnotes.
Of course, it is not adequate to compare the citation counts from two total different research field with each other, since the citation pattern and publication behavior of different research disciplines can vary distinctively. Therefore, different impact factors are created with the cita- tion count indicator. The aim is to have indicators for the evaluation of many authors, journals, publications and research fields (Havemann 2009; Moed 2009).
In this examination, I take the citation numbers from GS and calculate the citation rates of the three main broad research categories (see chapter 4). Another goal is to examine the applicabil- ity of the citation data due to the amount of data covered in the database.
Another important aspect about using citation rates to evaluate research success lies in the dif- ferent citation and publication behavior of different disciplines. Given that a publication needs
a special time window to get cited, there are bibliometric studies, which show, that for example publications from the natural sciences have a shorter citation age than publication from the humanities (Barnett et al 1999; Wang 2013).
When we consider the interdisciplinary composition of the research cluster with a strong em- phasis on the arts and humanities, a fast and only output-focused evaluation would be a wrong attitude toward a discipline, which needs more time to get visible in the scientific communica- tion.
2.2. H-index
Another indicator used in this examination is the so-called h-index, developed by Jorge Hirsch in 2005 (Jacso 2008a). This number is an author-based indicator, measuring the impact of an author’s publication output.
“The h index is seen to have the advantage that it gives a robust estimate of the broad impact of a scientist’s cumulative research contributions” (Hirsch, 2005)
One advantage of the h-index is the simplicity of its calculation. To determine the h-index of an author, all of his or her publications must be ranked by citation counts. Then the h-index is the number, where the ranking position and the amount of citations are equal or below the ranking position, or as Hirsch puts it in his famous work:
„A scientist has index h if h of his or her Np papers have at least h citations each and the other (Np h) papers have h citations each. “(Hirsch 2005)
H-indices are mostly available in citation databases like Web of Science or Scopus (Elsevier 2016a). Since, it is quite easy to calculate the h-index, compared to other bibliometric indica- tors, it is also possible to determine this value manually, presupposed all publications with the amount of references are at hand. But in common practice the h-index is taken from citation databases.
In this thesis, the h-indices of the authors of the publications of the research center are gained from Google Scholar and Web of Science. In the next chapter I will outline the weaknesses of this indicator together with a general critique of the use of bibliometric indicators in the evalu- ation of the Cluster of Excellence BWG.
3. Arguments against quantitative Indicators in Research Assess- ment
This chapter provides arguments against the excessive use of bibliometric indicators in research assessment. First, there is a general skepticism about the informative value of the common in- dicators in bibliometrics. Even the significance of the standard bibliometric numbers, like ci- tation counts are often debated in the discussion about research assessment (Kostoff 1998), (Abbott 2010). Another key-indicator, the h-index is even more criticized even among biblio- metricians (Waltman 2012).
Because of the different publications and citation behavior of each research field, citation counts need to be normalized, in order to be able to compare the impact of publications from different disciplines. This leads to the so-called citation rates. In this study, I calculate the citation rate based on three main research categories by Thomson Reuters Science Citation Indices (Thom- son Reuter 2016a). The database provider categorizes research disciplines for the covered jour- nals in so-called “Citation Indices”. In the tree main categories science, social science and arts and humanities, all relevant research disciplines are listed. For the calculation of the citation rates, I used the definition of citation rates on the company’s official Website:
“A citation rate is the average number of citations received by a group of papers published in one research field in a given year. It is calculated by dividing the total number of citations received by all papers in the group (defined by research field and publication year) by the total number of papers in the group” (Thomson Reuter 2016b).
In many studies, bibliometricians have shown, that the citation rates for publication from the humanities are lower than in other disciplines:
“Fields differ in citation patterns; work that is fundamentally of a historical character will nec- essarily have citations to primary sources that may be quite old” (Barnett 1999).
This means, that every publication needs a certain time until the publication becomes visible in the scientific communication and develop a stronger impact, measured in citations. The peak of citations is reached later in the arts and humanities compared with the other fields. That means bibliometric indicators in research assessments can’t be used immediately after the publication time. This leads Bornmann to claim: “When deciding which years of an institute’s publication record should be included in the analysis, care should be taken that the majority of the papers (if not all) are at least two years old”. (Bornmann et al. 2014 p. 204)
And Wang states: “…there are significant differences in citation ageing between different re- search fields. For studies on one specific field, a tailored citation time window is pre- ferred…a 3-year time window is sufficient for the biomedical research fields and multidisciplinary sci- ences, while a 7-year time window is required for the humanities and mathematics.” (Wang 2013)
The German national science organization, der “Wissenschaftsrat” (WR) advises in its recom- mendations for research assessment, that research center should be assessed with a frequency of five or ten years. This does not count explicitly for bibliometric evaluations, but impact of research output in the form of academic publications also need a certain time frame, in order to be measurable.
“Bei regelmäßig stattfindenden institutionellen Evaluationen sollten diese – gleich ob im außeruniversitären oder universitären Bereich – in der Regel nur alle fünf bis zehn Jahre durchgeführt werden. Bei der Festlegung der Intervalle sollte die Berufungsdauer des Leitungspersonals berücksichtigt werden. Durch größere Evaluationsintervalle wird der Aufwand für die Begutachteten sowie die begutachtenden Personen und Institutionen begrenzt, zudem werden Momentaufnahmen vermieden, mittelfristige Tendenzen sichtbar, und die zwischen zwei Evaluationen erfolgten Veränderungen können sinnvoll bewertet werden.”
(Wissenschaftsrat 2011)
Otherwise important trends and developments in the research activities can be missed, beyond the decisive aspect of visibility of the research publications measured with citations.
This leads us to the fact that the Excellencecluster BWG is only shortly older that three years, which according to the recommendations of the highest entity would be too young to be evalu- ated. Together with the Bornmann statement above, which says that all publications must be at least 2 years old and given that a great share of publications have been published in 2015 an evaluation with publication data would have only minor explanatory power.
Another critical aspect of neglecting bibliometric indicators is the claim by some researchers, like Richard Münz, that the focus on quantitative indicators can hinder creative and innovative research work, because, especially when relating too much on the third-party fund indicator.
“Die Konsequenz einer auf die Erfüllung von Positionen und Reputation ist jedoch die Eindämmung der Vielfalt von Wissen und die Behinderung der Kreativität von Forschung.”
(Münz 2012).
Finally, an evaluation based on quantitative bibliometric indicators can only be used, when there is a sufficient degree of coverage in citation databases. This argument is the subject of exami- nation in this thesis. Publication data must be queried in databases for the retrieval of biblio- metric indicators. A research evaluation is always limited by the time frame of the investigation.
In this case, the time frame starting with the establishment of the Cluster of Excellence in late 2012 (November 2012) until the end of 2015. A significant share of publications in the bibliog- raphies of these years must be covered in citation databases in order to create comprehensive indicators. A complete coverage of bibliographies is in most cases improbable, but on the other hand reviewers and bibliometricians expects a decisive part of coverage, as this quote by Born- mann indicates:
“The meaningfulness of bibliometric data for research evaluation ultimately depends on the coverage of the publications in the databases selected. What is not covered by the databases can also not be evaluated.” (Bornmann 2015)
This leads to the question of a determined degree of coverage. Since there is no official standard, every evaluation based on bibliometric indicators must be transparent concerning the data sources.
When calculating the coverage of publications in a citation database, the question arises, to which extend the coverage of publications in a database has to be, in order to be useful for the assessment of research facilities with bibliometric indicators. I state, that a bibliometric analysis of the publication output of a research facility will be too limited if not even half of the data can be extracted from databases. When there is only a short percentage of the publication covered in the database the creation of indicators would be impossible or at least almost meaningless for the purpose of measuring the impact of the research publications. In this case, the biblio- metric analysis will be restricted to a general publication count analysis. However, the exami- nation of publication coverage in the respective citation databases can also be informative for a research assessment.
Information from citation databases can be used to build multiple indicators. The total coverage of publications indexed in citation databases is only the precondition of a comprehensive eval- uation enriched with bibliometric numbers. On the other hand, one can argue that also the cov- erage of research publications in citation database can be seen as indicator of research quality, because of the potential extraction of bibliometric numbers.
Therefore, the degree of coverage necessary to conduct a bibliometric analysis needs to be de- fined. As mentioned above, I state that bibliometric indicators should not be included in the research assessment of the research center BWG, when not half of the publications are covered in a citation database.
Beside citation counts Google Scholar and Web of Science are contributors to data and metrics, that can be used not only to evaluate papers and journals, but also a whole research facility and every scientist in particular with the help of the h-index. The coverage of h-indices must also be considered for an evaluation.
The publication data must be accordingly represented in databases, in order to build main indi- cators, which can further be processed to new variables. Using data from databases, which only comprises approximately a third of the publication production of a research center, would not be very useful. The reasons for the lack of information from the database is in this case the main point of concern. For, the goals of research evaluations have all in common, that they seek visibility and impact in the scientific communication.
As mentioned, this examination is intended to conduct a bibliometric analysis and looks at the coverage of bibliometric indicators for the use in a full-fledged evaluation of a young research cluster of the Humboldt-University of Berlin. Because of the perspective from a national re- search program, which funds “excellent” research, the reasons for ignoring bibliometric num- bers in an evaluation must be clear. Additionally, the avoidance of efforts to retrieve, process and analyze publication data of a research center can direct the focus to qualitative indicators and aspects of research activities.
In common use, bibliometric numbers are not used solely for the decision-making, but instead added to peer review reports. In this sense, a need for a complete coverage of publications in databases is not even necessary. But the bigger the share of publications from the bibliographies covered in databases the more the data contributes to valid statements.
A further aspect concerning the omission of bibliometric indicators in the context of citation databases is the language of the publications. Together with the research field, these two aspects influence the probability of coverage in citation databases, since it is known that for example ISI-based database only covers a small percentage of publication in German language (Born- mann et al. 2015).
Also, books, one main publication format in the humanities, are also not yet adequately covered
by Thomson Reuter (Thomson Reuter 2016c). Because citation analyses are mostly conducted with journals as publications, the decision to conduct a bibliometric analysis must consider the dominant publication format of the research output. In chapter 4, I present information about the exact representation of the amount of disciplines in the publications lists and show that journals only present a third of the total publication format. This is why a strong focus on bib- liometric indicator would not be advisable, due to the expected limitation of available data.
However, quantitative indicators, in particular bibliometric indicators also have general disad- vantages. When it comes to solely counting the citations of publications, the meaningfulness of the numbers must be questioned for many reasons. For example, citations don’t tell in what context the publications had been cited (Stellenbosch University 2014). It must also be consid- ered, that negative reasons of citations cannot be excluded from the numbers. Also, there is no distinction between citations, which are crucial to the citing publications and others, which are more irrelevant to the main aspects of the publications. This lack of weighted citations, leads to the question of normalization of the numbers. Since there are differences in citations patters and publication behaviors in the different research disciplines, these factors must be taken into ac- count in evaluative bibliometrics.
Another weakness of citation counts, as basis for an evaluation, is the common use of self- citations (Jacso 2008b). Nevertheless, as Hirsch states the effect of the h-index is much lesser than on the citation count indicator:
“Finally, in any measure of citations, ideally one would like to eliminate the self-citations. Alt- hough self-citations can obviously increase a scientist's h, their effect on h is much smaller than on the total citation count.” (Hirsch 2015)
One main aspect of concern in this study, regarding the use of the h-index from Google Scholar and Web of Science, is the fact that the h-index has a bias towards already established and older authors:
“The H-index, an appealing construct, is highly biased towards “older” researchers with long careers and those active in fields with high citation frequencies and provides an incomplete picture of a group’s actual citation impact.” (Moed 2009)
For example, the h-index of one authors increasing over time, also without publishing any fur- ther research work (Glänzel 2006), (Waltman 2012). As it is known, that the given object of examination, namely the Cluster of Excellence BWG consists of many young scientists, high
h-indices should not be expected. Another weakness of the h-index is that because of the men- tioned differences in citation patterns of the disciplines only authors from the same research field and also with the similar age can be compared with each other (Marx 2015).
This is why these indicators should be used with care, if at all, in the research assessment of this Cluster. Nevertheless, a bibliometric analysis will be conducted in this examination to prove this thesis.
4. Data Collection and Processing
In this chapter I delineate the approach and methodology for the data collection. Therefore, two factors are indispensable for the approach. First, this study examines the coverage of the publi- cation data in citation databases. Second, the aim is to use the extracted bibliometric indicators to evaluate the suitability of these indicators in research assessment.
The first approach for the retrieval of bibliometric indicators for a potential evaluation is the selection of the right data source. Nowadays there are several providers of academic databases.
Common citation databases are Elsevier’s Scopus, Google Scholar and to Thomson Reuter’s Web of Science. After selecting the database for the collection of bibliometric information, que- ries must be conducted on the basis of the publication list. The aim is to create a new variable and set the values accordingly. Again, we can separate two different kinds of queries in order to retrieve the two main bibliometric indicators, namely citation counts and h-indices. The title query is used for measuring the coverage of publication in Google Scholar and using the citation numbers for a bibliometric analysis. Author names are queried in both databases Web of Science and Google Scholar for the calculation of the h-indices.
Considering the coverage study, all academic publication titles in the bibliographies from 2012/2013 to 2015 were queried in Google Scholar. In this case a new variable in the calculation table must be created with two values representing the positive and negative result of the query.
The query should incorporate the full title, in order to avoid similar matches. The identification of the entry is the main point of concern, so that all metadata of the entry must be checked, before setting the value in the variable accordingly. But beforehand, an explanation follows, why I used Google Scholar and Web of Science as data sources for a bibliometric analysis.
4.1 Selecting the Citation Databases
In the following, I present arguments, why Google Scholar is the most potential candidate, in terms of providing bibliometric data of the publication of the Cluster, in order to measure the coverage and to conduct a citation analysis. As mentioned above, the selection of an appropriate citation database also concerns the h-index. For this purpose, not only is Google Scholar used to calculate the h-indices of all authors from the publication lists, but the same author names were also queried in Web of Science, in order to determine which of the both databases provide a more comprehensive degree of coverage of the h-index.
To find out which database would provide the most data for the bibliometric analysis, it is nec- essary to get an overview of the research publication of the Cluster. One aspect of the publica- tion policy of this young research center is the recommendation to publish Open Access (OA) (Bild Wissen Gestaltung 2016a). When considering, that Web of Science does not cover OA- publications broadly (Falagas et al 2007), it should be excluded as the source for the retrieval of bibliometric indicators of the research publications of the Cluster. According to McVeigh (2007) OA – Journals make up “approximately 1% of the 20,000 journals in ISI Web of Knowledge”. Further the author reports, that only highly cited OA-Journals are covered in WoS.
On the other side, there are numerous studies about the coverage of Open Access literature in Google Scholar, because Google does not give details about the coverage numbers (Orduna- Malea et al 2014). Also Jamali (2015) claims, that GS “plays a major role in finding free full- text versions of articles”.
However, in its coverage policy GS claims that it “includes journal and conference papers, the- ses and dissertations, academic books, pre-prints, abstracts, technical reports and other schol- arly literature from all broad areas of research … a wide variety of academic publishers, pro- fessional societies and university repositories, as well as scholarly articles available anywhere across the web. Google Scholar also includes court opinions and patents” (Google 2014) In this sense it can be concluded, that GS covers more open OA articles, than WoS. Google Scholar was launched in 2007 and has gained more awareness by researchers since then, be- cause of its fast-growing collection of academic bibliographic data. Another reason to use GS for bibliometric analyses is the free availability of the citation database.
Nevertheless, in the following I provide a concise introduction of the citation database Web of Science, formally known as ISI (Ball and Tunger 2005), because of its importance in biblio- metrics and due the fact that a coverage study of the h-index is also subject of this thesis.
Traditionally, bibliometric calculations have been done with the bibliographic data of the Insti- tute for Scientific Information (ISI), which was founded by Eugene Garfield in 1960 (Thomson Reuters 2008d)
“The ISI has historically been the exclusive provider of citation analysis data. However, other providers of scholarly analysis of citations have emerged. Scopus (Elsevier B.V., New York, NY) and Google Scholar (Google, Inc, Mountain View, CA) have challenged ISI as the only source of citation data.” (Thompson et al. 2009)
ISI was then the only reliably source for academic bibliometric information. Now there are more databases for academic publications. The ISI-based Web of Science by Thomson Reuters is still one of the most used for bibliometric studies (Moed 2009).
However, there are other citation databases now competing with Web of Science, as the quota- tion above by Thompson suggests. One commonly used database is Elsevier’s Scopus, which was introduced in 2004 (Elsevier 2016b).
This means, before the selection of the database, the research fields of the publications have to be analyzed. Thompson (2009) goes on to state that: “…the same search done on all 3 databases would probably generate 3 different results from the available citation networks. This must be kept in mind when evaluating faculty citation counts using different sources”.
This means, before a bibliometric analysis can be done, the right database must be chosen, to get the most useful result from the bibliometric evaluations. The expectation, that one citation database would have all data covered necessary for the analysis is on the other hand also unre- alistic and improbable, in particular, when we consider the fact, that a significant share of the given publications are recent publications from 2015 and from the arts and humanities.
Therefore, a first look on the publication list of the research facility and on the composition of the interdisciplinary research projects are necessary in order to decide, which database would give sufficient data for an evaluation.
The following table shows the composition of the publication data from 2012/13 – 2015 with respect to the allotted research fields. The information of the researcher’s disciplines is taken
from the staff list of the official website of the research center. This information served as a basis to transform it into the subject categories of Web of Science.
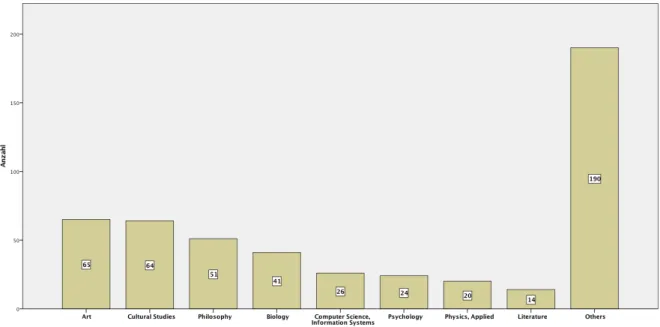
Figure 1: Composition of disciplines in the publication list of the research center BWG
This bar chart above (Figure 1) indicates, that most of the publications can be allotted to arts and humanities. Followed by disciplines from the sciences (Biology, Physics etc.) and also Psy- chology, which is counted as social science in the ISI citation index. There are a lot of other disciplines, but which much less frequencies. Therefore, they are summed up in the bar chart as “Other”.3
In order to have a more broad and comprehensive view on the composition of the BWG publi- cations in relation to its disciplines, I transformed the values for the disciplines into the subject categories of Web of Science and allotted these categories to the three main research fields (science, social sciences and arts and humanities), based on ISI’s Citation Indices (Thomson Reuters 2016). In order to have explicit terms, I refer to these three categories as research fields in all calculations.
3 For a detailed view of the frequencies of the disciplines see attachment
Figure 2: Proportion of research fields in the publication lists
This diagram (Figure 2) shows that most of the publications are from the arts and humanities with about 60%. Publications from the sciences make up about 31% of the publications list.
Circa 8,7% of the publications are from the social sciences.
Another important aspect for the consideration of the right citation database, are the publication types of the publications.
According to Mongeon (2014), there is a shortage of journals in the fields of arts and humanities compared to social sciences and the life and natural sciences. Moreover, there is a more con- siderably lack of journals in German language. Also, monographs and edited volumes, which still are important publication formats in humanities and arts, are not extensively indexed by citations databases like Web of Science. As Münz (2012) states, in the Social Science Index of WoS there is still little coverage of German titles:
“Dabei ist das Grundproblem die Repräsentatitivität der bibliometrischen Daten. Der oft verwendete Social Science Citation Index erfasst weit überproportional englischsprachige Fachzeitschriftenaufsätze und damit nur einen Bruchteil der realen, in den Sozialwissenschaften noch stark national und in Sammelbänden und Monographien stattfindenden Diskurse.” (Münz 2007)
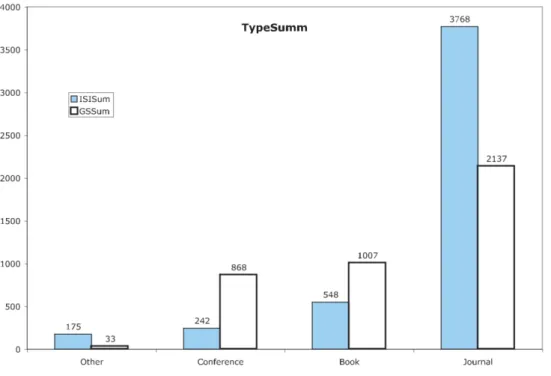
This Figure below (Figure 3), taken from „Scientific impact quantity and quality: Analysis of two sources of bibliographic data” (Belew 2005 p. 9), shows the difference of coverage of pub- lication types between Google Scholar and ISI Web of Science.
Figure 3: Publication types covered in GS and WoS in a coverage study by Belew, R.
In his paper, Belew (2005) criticizes the use of the ISI-based database in certain points. Not only, was there a lack of conference proceedings and books, but also regarding journals, he states, that ISI only covers the “most important” ones and not as many as possible (Belew 2005).
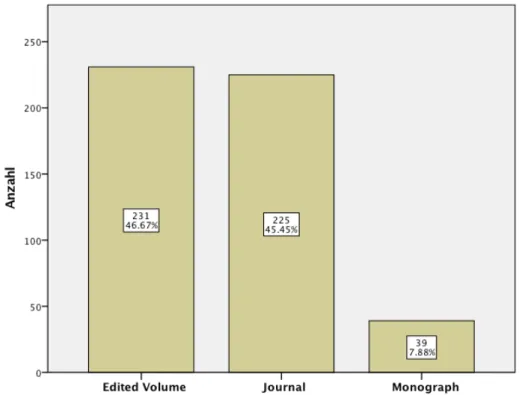
With respect to the types of publications, this following bar chart shows the format of research publications in three categories: journal, and edited collections. The bar chart below (Figure 4) shows the proportions of the publication formats in the publication lists:
Figure 4: Proportion of publication formats in the publication lists
Since, edited volumes and monographs are both book publications, the majority of the publica- tions are books and less than half of the publications are journal articles. Conference proceed- ings were also categorized as edited collections, because many authors contribute articles to a specific topic. Although one can argue that some contributions to a conference proceedings might as well be published as a paper in a separate journal, but that can also be true for book chapters. When comparing the numbers with the coverage study above between Google Scholar and ISI, one can refer that Google Scholar has the potential to provide more data, concerning the main publication format of all publication in the data set.
Another fact about the coverage is the time, which is needed for the database to index the latest publications, for this examination deals with new publications within the years of 2012/13 until 2015.
Furthermore, one principle stated in the publication policy of the research cluster is to publish open access. Considering this aspect, a data source should be selected which also covers open access publications.
As seen Google Scholar provides a lot of data. With its inclusion of Open Access-journals, it
Finally, also Bornmann (2015) recommends not using Scopus or WoS for the research fields of humanities and the social sciences because these fields are often “nationally and regionally”
oriented (Bornmann 2015). This would mean, that these publications are not sufficiently cov- ered in WoS and Scopus.
This claim is also supported by Horst Bredekamp, the founder of the Cluster of Excellence Bild Wissen Gestaltung and prominent author in art history, which plays an important part in the interdisciplinary research work: “Weil seit 1830 … die Kunstgeschichte im deutschen Sprachraum zuerst zum Universitätsfach geworden ist, hat von etwa 1830 an die deutsche Sprache eine gewisse Dominanz erlangt.” (Bredekamp 2012 p. 201).
Another argument Bornmann provides, is the already mentioned aspect of publication behavior in the humanities and social sciences:
“In the area of humanities and social sciences, publication tends predominantly to be in the form of books or monographs, which are essentially excluded as database documents (source items) for WoS or Scopus. Thus, typical publications in the humanities and social sciences are only insufficiently captured by these databases” (Bornmann 2015)
On the other side, Google Scholar is also known to index books (Bornmann et al. 2016). Its important project and service Google Books is one example of the coverage of books. Together with its comprehensive indexing of academic publishers Google Scholar can be seen as more advantageous than WoS or Scopus (Jacso 2008a)
These quotations prove that WoS and Scopus are not suitable for a bibliometric analysis with the given publication data of the research center BWG. So, it can be said, that Google Scholar has the best potential to sufficiently cover the publications.
With the given arguments above, it can be assumed, that Web of Science will not cover the publications of the research cluster as extensive as Google Scholar for the retrieval of biblio- metric indicators. Also, Google Scholar can be a useful database for exploring information, which is not covered in the traditional database like Web of Science.
Because of the given arguments, I decided to get the necessary data from Google Scholar in order to measure the coverage and conduct a bibliometric analysis. The author name searches in Web of Science will be used to prove, that there is even less data, concerning the BWG publications in this traditional citation database. This is one reason, why I suggest neglecting bibliometric indicators in the research assessment of this Cluster.
As discussed in the previous chapter, a citation analysis with GS will be more informative, when enough time has passed. In this case I argued, that at least five years should pass before conducting an elaborate research assessment with bibliometric indicators and that it should be considered, that all publication must be at least two years old. Only then, the measurement of the impact of research works with quantitative can be more informative and comprehensive.
Nevertheless, in the next chapter I outline the approach and the method of the data analysis. I will describe all aspects of the data collection and the processing of the data with the variable in the calculation tables. Additionally, I will discuss the problems relating to the cleansing of the data.
4.2. Queries and Variables
This chapter presents the method and approach to the research question. Also, all findings of the bibliometric study will be presented and discussed. After having selected the databases, namely Google Scholar and Web of Science, the next step is to create the calculation table. All calculations, evaluations and visualizations have been done with Microsoft Excel (Microsoft 2014) and SPSS (IBM 2015). For reproducibility, the data sets used in this examination will be provided on external digital medium.
Another basis of this study is the staff list, which is publicly available via the official website of the research center (Bild Wissen Gestaltung 2016b). This data source is used to determine the disciplines of the authors. As mentioned, the information about the disciplines are again transformed into the three main subject categories of the ISI-database, namely science, social science and arts and humanities. The more detailed categorization of the disciplines from the official website has also been used for the calculation above (Figure 1). This has showed the proportions of the main disciplines of the given publications. In this case the result has been necessary to find the right citation database. Because some publications have a multidiscipli- nary character, so that more than one discipline could be assigned to the publications, I decided to transform the disciplines into broader research categories, eliding some interdisciplinary pub- lications. Nevertheless, the detailed information about all publications regarding the disciplines, including multidisciplinary publications can be found in the attachment.
When transforming the discipline into the ISI Citation Index categories, I used only one cate-
interdisciplinary character. This is not only necessary for identifying the proportion of disci- plines of all given publications, but also for the purpose of calculating citation rates per research field, as I will show in an own chapter.
As said, the basic approach of retrieving bibliometric values in this study consists of searches in Google Scholar and Web of Science. This study can be divided into two sections, namely the coverage of academic titles in citation databases and the extraction of bibliometric indicators.
Furthermore, the searches can also be differentiated between a title search and an author name search.
So far, the title query allows the creation of two new variables, namely the coverage variables for titles and the variable for citations.
In turn, the author name searches result in the values for the h-index and the information about the coverage of authors in the two databases GS and WoS.
As seen, there is not much need for cleaning the result list of the search engine, when querying publication titles, since the only values to set are “yes” or “no” for the coverage study. The level of this variable is either categorical or processed to numerical values for other calculations.
In the next step, I queried every name of the authors, who are member of the Cluster in both citation databases Google Scholar and Web of Science. Other coauthors, who are not affiliated with the research center, are respectively not subject of this study. The aim of this method is to retrieve the h-index from the two databases GS and WoS. This study takes more effort in both, the ensuring of the right query and the data cleansing of the result list of the search engine.
However, the data cleansing part of this examination follows in the next chapter, with critical arguments and issues regarding the cleansing and the refinement of the result list of author- name-queries.
This means for the calculation, that two new variables can be created, one for the h-indices in Google Scholar and the other one for Web of Science. Every absence of authors in the database is marked as missing value. There are also cases, where you can find authors with one or a few titles, but still with an h-index of zero, ensuring to calculate the overall coverage of the h-index in both databases.
As seen, four new variables are created with two different queries-types in two different data- bases. I will also show, that for the coverage of publications, there is no need to query all titles
in another database, since with the coverage of h-indices in another database like Web of Sci- ence, the general coverage of publications can be approximately inferred.
Considering the retrieval of the h-index, all author names in the staff list were queried in the format: last name, name using the option “exact match”. In some cases the exact match option was not used to consider different spelling variants. For the calculation of the h-index, I used a browser plug-in called “Scholar H-index Calculator for Google Chrome ad Firefox™” (Ianni 2010). This browser plug-in calculates the h-index and other author metrics like the g-index automatically and instantly after each query, based on the entries in the result list.
Beforehand, an overview of the used variables in the calculation table is necessary.
In the beginning, I started to create variables in Excel, based on the publication list of the re- search center. For this I used the following variables:
1. Author
Although, I also created variables for every coauthor in the publication list, calculations for this examination focus the one author, who is member of the Cluster of Excellence, because in some cases there were authors, who are not affiliated with the research center. Author name queries were conducted in the two databases GS and WoS to calculate the h-indices. In cases were more than one author are member of the research cluster, both author were queried in the database.
This means a differentiation between first author and coauthor was not made, since this thesis examines the usefulness of the main bibliometric indicators, namely citation of the publications and the h-index of authors in the publication list.
• Title
• Pub-year
The publications range from the year 2012/2013 to 2015. Because the research center has started its work, in November 2012, there are only few publications allocated to this year. Alt- hough in the original publication list, from the years 2012 and 2013, contained more publica- tions, I only counted publications, from principal investigators, which are topical related to the alignment of the interdisciplinary research work and had a certain influence on the creation of
output. The problems with the identification of research publications for the measurement of research performance, is the subject of the next chapter.
• Edited volume
• Journal
• Monographs
The categorization of publications is done separately, but can mostly be inferred directly from the bibliographic information. Usually, bibliometric analyses are done with journal articles.
Because one argument against the usage of bibliometric indicators in research assessment con- cerning the research center BWG is the high amount of book publications in the humanities and social sciences, it is useful to split the publications into journal articles and books. In this case, I also divided the category book into monographs (usually by one author) and edited volume (here I categorized contributions to volumes and the volume itself in the same category). As mentioned, this is rather a formal distinction, which again has an informative character. In fact, volumes and monographs will be treated as books throughout the calculations.
• Citation
As discussed in previous chapters, the citation indicator was created with the values retrieved from Google Scholar. Self-evidently this variable is scaled metrically. It is noteworthy to say, that there is the distinction of publication with the value zero and cases when the publications were not indexed in Google Scholar. For the citation analysis, it is important to identify covered publication without citations, beside the overall coverage in Google Scholar.
• H-index GS
• H-index WoS
These values of the metric variables are retrieved from GS and WoS. Author name queries were conducted in the two databases. As described, the two indicators are analyzed and compared with each other to determine the usefulness of these indicators in research assessment.
• In Google Scholar
This variable is the result of title queries in Google Scholar. All titles in the publication lists from 2012/13 until 2015 were searched in Google Scholar. The variable has only two values: 1
= covered in Google Scholar 0 = not covered in Google Scholar
With this variable, the coverage of publications in Google Scholar can be measured. Due to the update frequencies of Google Scholar, the result can increase, when more time has passed (Fal- agas 20107, p 339). The result of this study stems from the May 2016.
• Discipline
• Research Field
In bibliometric analysis, it is common to calculate citation rates with the respective disciplines or research fields. For this purpose, the discipline of each publication on the list has been en- hanced with the information about the author’s discipline from the staff list of the research center. As explained, the information about the disciplines have been transformed into the main three research areas based on three citation indices of Thomson Reuter. These indices are called art and humanities-, social science-, and science citation index. All disciplines in the staff list were searched in the indices and then transformed into the respective superordinate concept.
However, the discipline variable is also used for more detailed data evaluations for example to decide, which citation database to use, as explained in a previous chapter.
4.3 Data Cleansing
In this chapter, aspects regarding data cleansing will be discussed. There are problems regarding the title- and the author-name-queries in the databases. In particular, there are two aspects of concerns, namely the definition of academic publications and the identification of authors with common names.
The first problem in the data cleaning process occurred, when I searched the titles of the publi- cations in Google Scholar. Since the original lists were not always clean of non-academic re- search work, like blog entries or interviews in newspaper, I deleted these works from the cal-
conference posters or DVD’s. Although, these “publications” do pose relevant research output also in the context of an evaluation, they are not suitable for citation analyses.
In this respect, a definition of academic publication is useful to determine, which titles to use in the queries. This aspect gains more importance, when we consider the fact that Google Scholar also covers grey literature and websites, which often are blogs (Courtault 2010), (Had- daway 15).
In order to distinguish authentic academic publication from other research output, I used the recommendations by the library of the University of Mannheim (Benz 2006). Of the nine crite- ria for determining research publications, the main aspects I checked were the usage of refer- ences and the publication format. This verification ensures, that only those publications are queried, which are academically relevant for a citation database.
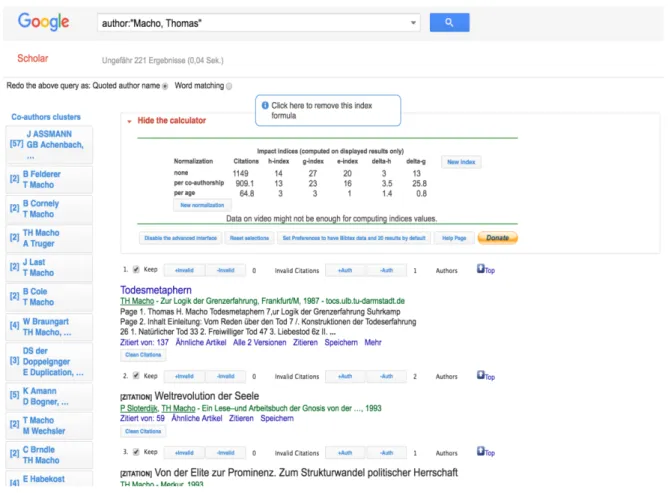
Another aspect concerning the title searches in Google Scholar is the identification of the right publication in the result list. When there were numerous entries in the result list, I used the option “exact match” offered by the h-index calculator and by the advanced search option of GS. This method returns all matches based on the exact order of the queried string. This mini- mizes the possibility of wrong results. Then, I identified the publication by the title, the author name(s) and the publication format.
Even more important and problematic is the identification of authors, when querying author names in citation databases, especially with common names. As Thompson (2009) states this problem is wide spread in bibliometrics:
“Methodological issues, such as misspelled author names, homographs (ie, scientists with the same names in different disciplines), inconsistent use of author initials, or author name changes are potential problems.” (Thompson 2009)
Although Web of Science offers a search with author identifiers, not every author is registered by respective identifiers services. Moreover, Google Scholar does not offer author id searches.
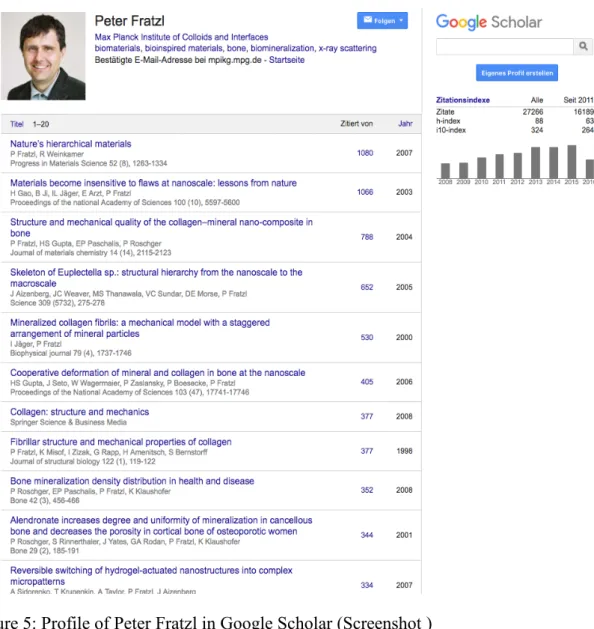
Only when authors register in Google Scholar and claim their publications, authors can be iden- tified. But of all the authors in the publication lists, there were only few authors who could be identified because they have registered in Google Scholar.
Figure 5: Profile of Peter Fratzl in Google Scholar (Screenshot )
As we can see in the screenshot (Figure 5), the numbers about citations are provided together with the h-index calculated by Google Scholar. But unfortunately, the registration of authors in GS are more exceptional than common praxis, so that bibliometricians and scientometricians often need additional software to calculate h-indices on the basis of GS data.
One advantage of retrieving the h-index in Web of Science is the option of author name searches with unique identifiers, avoiding any miscalculations of the h-index. WoS offers two author identifiers, namely ORCID (ORCID 2015) and ResearchID (Thomson Reuters 2016e), the lat- ter is a service also owned by Thomson Reuters. Nevertheless, in practice the queries in WoS were done rather with the names, than with the identifiers, because, as I will show in the next chapter, only a small percentage of authors from the publication list are covered in Web of
Figure 6: Author identifier search option in Web of Science (screenshot)
In this screenshot above (Figure 6), one can see the option to search with author identifiers in the drop-down menu of WoS. But for this examination, I have not used the option, since not all authors sign up for providers of identifiers. It would facilitate the author name searches, when author identifiers are more widespread in the academic community. But, as the following quote by Bornmann (2007) explains, not only must there be unique identifiers, but also other relevant information should be known to identify the author:
“The h index for a scientist can be found easily in Web of Science only if the scientist can be identified uniquely by name or if accurate publication lists can be pulled up in Web of Science by using a combination of the author name and address, or affiliation, search field”
(Bornmann and Daniel 2007)
On the other hand, results in Google Scholar for an author name search often contain irrelevant or false data, increasing the h-index sometimes to unrealistic heights, in particular when com- pared with the results from WoS. In these cases, often with common names, the identification of the author and his or her affiliated research work was the most important challenge in the cleansing process. The h-index calculator extension allows the use for an exact match search option. This option helped to identify the coverage of a specific publication and also the iden- tification of the general works covered by a specific author, which is needed to calculate the h- index. Additionally, a thoroughly analysis of the result list was needed to exclude publications, which could not be allotted to the queried author. The calculator program offers the option to
de-select entries in the result list for this purpose. By excluding irrelevant and redundant entries in the result list, the calculator ignores these results and recalculates the h-index accordingly.
The creator of the tool claims that the h-index is calculated based on the information displayed in the result list (Ianni 2010).
These cases only occurred with authors who have published a high amount of cited papers. New junior scientists, who also represent a big share in the publication list, where often not even covered in Google Scholar.
But for the other cases, I queried the author names in the ISI-Database, to compare the retrieval of the h-indices of the two databases.
Figure 7: Exact-match-option using the h-index calculator in Google Scholar (Screenshot)
The screenshot above (Figure 7) shows an author-name-search with the mentioned option of
“quoted author name” by the calculator software. As mentioned, this search option can also be used in the advanced search option of GS. As one can see in the figure every entry can be unmatched as described above.