grown in steady state cultures under varying conditions of temperature, light and nutrients
- Implications for the interpretation of oxygen isotopes from sedimentary biogenic opal as proxies of environmental variations
I n a u g u r a l - D i s s e r t a t i o n
zur
Erlangung des Doktorgrades
der Mathematisch-Naturwissenschaftlichen Fakultät der Universität zu Köln
vorgelegt von
Krystyna Kowalczyk
aus Kolobrzeg, Polen
Jülich 2006
Berichterstatter: Prof. Dr. Ulrich Radtke
Prof. Dr. Gerhard H. Schleser
Tag der mündlichen Prüfung: 08. Februar 2006
Isotopenzusammensetzung von Schalen und Zellgewebe von Kieselalgen aus stationären Kulturen unter verschiedenen Temperatur-, Beleuchtungs- und
Nährstoffbedingungen
-Schlussfolgerungen für die Interpretation von Sauerstoffisotopen biogener Silikate aus Sedimenten als Proxies von Umweltvariationen
Zusammenfassung
Der biogene Opal aus Kieselalgenschalen wurde in letzter Zeit vermehrt als Paläotemperatur-indikator vor allem dann benutzt, wenn Karbonate als Träger klimatischer Information nicht zur Verfügung standen. Im Hinblick auf terrestrische Gewässer stellt sich aktuell die Frage, ob und inwieweit diese Paläotemperaturskala auch im limnischen Bereich angewendet werden kann. Weil die jahreszeitlichen Variationen in Seen wesentlich höher als in Ozeanen sind, treten bei der Interpretation der ermittelten Signale andere Probleme auf. Die Frage nach Entstehung und der Zusammensetzung von Isotopensignalen ist daher eine große Herausforderung um zu einer korrekten Interpretation zu kommen. Im natürlichen Milieu ist die gezielte Untersuchung einzelner Umweltparameter auf Grund der sich ständig verändernden Bedingungen nahezu unmöglich. Deshalb wurde der Entschluss gefasst, Laboruntersuchungen durchzuführen, bei denen gezielt unter bestimmten vorgegebenen Parametern experimentiert werden konnte.
Im vorliegenden Fall wurde entschieden, mit dem Einsatz stationärer Algenkulturen einen möglichen Zusammenhang zwischen Sauerstoffisotopenvariationen und verschiedenen Umweltgrößen zu erarbeiten. An Hand der Arbeit sollte überprüft werden, ob verschiedene Diatomeenarten unter gleichen Bedingungen gleiche Sauerstoffisotopenverhältnisse aufweisen (Artabhängigkeit), ob Variationen der Wassertemperatur zu Veränderungen des Isotopenverhältnisses führen (Temperaturabhängigkeit), ob Variationen der Lichtintensität und Nitratkonzentration (Nährstoffe) zu Veränderungen des Isotopenverhältnisses führen, und ob gewisse biologische Prozesse (z.B. Wachstumsrate) zu Abweichungen vom rein physikalischen Isotopenaustausch führen können.
Die Versuchsreihen mit den Diatomeen wurden in zwei Fermentern durchgeführt. Um die Versuche durchzuführen, mußte eine Beleuchtungseinheit mit natürlichem Lichtspektrum konstruiert werden. Für die Untersuchungen wurden zwei Diatomeenstämme ausgewählt, die sich morphologisch unterscheiden. Dies waren:
Fragilaria crotonensis aus der Ordnung Pennales und Cyclotella meneghiniana aus
18, 21 und 24°C durchgeführt. Zunächst wurde der Einfluss verschiedener Nitratkonzentrationen im Medium (10.5, 21, 52.5 und 105 mg/l) auf das Verhalten der Diatomeen überprüft. Außerdem wurden Versuche bei verschiedenen Lichtintensitäten (200, 500, 1100 und 1700 µmol Photonen m
-2s
-1) durchgeführt.
Auf Grund der Ergebnisse wurde für beide Arten ein Zusammenhang zwischen dem Isotopenwert des Opalsauerstoffs und der Wassertemperatur gefunden. Dabei hat sich gezeigt, dass die Temperaturkoeffizienten nicht artabhängig sind. Für Fragilaria crotonensis wurde im Temperaturbereich von 15- 24°C ein Temperaturkoeffizient von ≈ -0.28 ‰/°C ermittelt. Für Cyclotella meneghiniana, ergab sich mit einer Wachstumsrate von 0.34 d
-1im Temperaturbereich 15-21°C, ein Temperaturkoeffizient von ≈ -0.27 ‰/°C. Dieselbe Art, lieferte bei einer Wachstumsrate von 0.2 d
-1im Temperaturbereich 9-18°C, ebenfalls einen Temperaturkoeffizienten von ≈ -0.27 ‰/°C.
Die Untersuchung des Einflusses der verschiedenen Nitratkonzentrationen zeigte keine Änderung der Sauerstoffisotopenfraktionierung im biogenen Opal. Der Befund ist von großer Bedeutung für Rekonstruktionen der Wassertemperatur mittels der Sauerstoffisotopenverhältnisse von Diatomeenschalen die aus verschiedenen Seen gewonnen werden. Denn verschiedene Seen werden sich normalerweise in ihrer chemischen Zusammensetzung unterscheiden.
Zusätzlich konnte gezeigt werden, dass verschiedene Lichtintensitäten die Sauerstoffisotopen-fraktionierung während des Schalenaufbaus signifikant beeinflussen, allerdings ist der Effekt nicht sehr groß. Der Lichtkoeffizient (φ) beträgt
≈ 0.05 ‰/100µmol Photonen m
-2s
-1. Der Effekt der Lichtintensität ist gegenläufig zum Temperatureffekt, und führt offensichtlich zu einer Dämpfung des Isotopensignals.
Änderungen der Lichtintensität sollten also bei der Interpretation der Sauerstoffisotopenverhältnisse vom Kieselalgenopal berücksichtigt werden.
Die in dieser Studie entdeckten speziesspezifischen Effekte beziehen sich auf die Absolutwerte der Fraktionierung, haben jedoch keinen Einfluss auf die Temperaturkoeffizienten, welche speziesunabhängig sind. Die untersuchten Diatomeenarten waren also durch verschiedene Fraktionierungswerte charakterisiert.
Offensichtlich spielt die Wachstumsrate bei der Fraktionierung eine entscheidende
Rolle.
Abstract
The oxygen isotopes of diatomaceous silica from marine and freshwater sediments are frequently used as indicators of the palaeotemperature development, particularly in cases where calcareous microfossils are rare or absent. With regard to terrestrial waters it is unknown whether or not palaeotemperature scale can be used in a limnic ecosystem. Due to the fact that the seasonal variations in lakes are larger than in oceans, specific problems arise when working with freshwater sediments. Thus, an understanding of the contribution of the various factors (e.g. temperature, light, nutrients, competition) influencing the formation of isotope signals in biogenic opal is a prerequisite for the accurate interpretation of environmental processes. Since it is impossible to examine the influence of a single parameter under natural ecosystem conditions due to permanent changes of the environment, laboratory experiments with single diatom species are needed.
Therefore, the aim of this study was to investigate the correlation between the oxygen isotope variations in biogenic opal and different environmental parameters using steady state cultures with diatoms. It should be examined whether or not the different diatom species grown under identical conditions show equal oxygen isotope ratios (species relationship), if variations of the water temperature induce variations of the oxygen isotope ratio (relationship with temperature), variable parameters such as light intensity and nitrate concentration influence the isotope ratio, and if vital effects (e.g. growth rate) lead to variations of the oxygen isotope ratio.
The experiments with diatoms were carried out using two fermenter systems. An illumination unit, constructed especially for the experiments, produced the necessary natural light spectrum. For the study two diatom species were chosen, which were morphologically different. These were the pennate form Fragilaria crotonensis and the centric form Cyclotella meneghiniana. The diatoms were grown at temperatures of 9, 12, 15, 18, 21 and 24°C. Subsequently, the influence of various nitrate concentrations of the medium (10.5, 21, 52.5 and 105 mg/l) was examined. Moreover experiments with various natural light intensities (200, 500, 1100 and 1700 µmol photons m
-2s
-1) were performed.
Based on the data obtained from the experiments, a negative linear correlation
between the oxygen isotope ratio and the water temperature was found for both
diatom species. The temperature coefficients obtained in this study were not species-
specific. The temperature coefficient determined for Fragilaria crotonensis within the
temperature range of 15 - 24°C was ≈ -0.28‰/°C. For Cyclotella meneghiniana grown at a growth rate of 0.34 d
-1employing temperatures in the range of 15 - 21°C, the temperature coefficient was ≈ -0.27‰/°C. The same species grown at a growth rate of 0.2 d
-1and operating in a temperature range of 9 - 18°C also resulted in a temperature coefficient of ≈ -0.27‰/°C.
Varying nitrate concentrations examined in this study did not influence the oxygen isotope fractionation between diatomaceous silica and water. This finding is very important for further applications of the oxygen isotope ratio of diatom valves for reconstruction of the water temperature, since varying nitrate concentrations in lakes will not mask the temperature effect.
It was also found, that variations in the light intensity influence the oxygen isotope fractionation during diatom valve morphogenesis. The light coefficient (φ) was
≈0.05‰/100 µmol photons m
-2s
-1. The effect of the light intensity is opposite to the effect of the temperature and leads to a partial suppression of the fractionation effect induced by temperature. Thus, the effect of the light intensity should be taken into consideration in reconstructions of the water temperature.
Species-specific effects found on the basis of this study are distinctly expressed in the amount of the oxygen isotope fractionation despite equal water temperature. On the one hand, different growth rates caused differences in the fractionation of a single diatom species. On the other hand, there were also differences in the fractionation between diatom species grown with the same growth rate. Thus, for reconstructions of the water temperature, it is important to separate the valves of single diatom species from e.g. a plankton sample.
The results of this study increase hitherto existing information about the relationship
of the oxygen isotope fractionation between diatomaceous silica and water. The new
findings from this study should help in the interpretation of the stable oxygen isotope
ratios of diatom valves.
ZUSAMMENFASSUNG III
ABSTRACT V
LIST OF FIGURES IX
LIST OF TABLES XI
LIST OF ABBREVIATIONS XIII
1. INTRODUCTION AND GOALS OF THE STUDY 1
2. THEORETICAL BACKGROUND 3
2.1 Stable oxygen isotopes, nomenclature and fractionation processes 3
2.2 Stable oxygen isotope of biogenic silica 7
2.3 Stable carbon isotopes and fractionation processes 9
2.4 Isotope signatures of nitrogen in algae 11
2.5 Diatoms 12
2.5.1 Cell division 13
2.5.2 Cell cycle and formation of the cell wall 14
2.5.3 Silicic acid uptake 15
2.6 Culture principles 16
2.6.1 Basic principles of batch culture 16
2.6.2 Basic principles of continuous culture 18
3. METHODS 22
3.1 Biological methods 22
3.1.1 Choice of test diatoms 22
3.1.2 Growth medium 22
3.1.3 Batch culture experiments 24
3.1.3.1 Water tank 24
3.1.3.2 Carbon dioxide supply 24
3.1.3.3 Illumination unit 25
3.1.3.4 Culture tubes 25
3.1.4 Fermentation 25
3.1.4.1 Sterilisation of the vessel 26 3.1.4.2 Inoculation of the fermenter 26
3.1.4.3 Aeration of the vessel 26
3.1.4.4 Illumination unit and light intensity 27 3.1.5 Sampling of diatoms and dry mass determination 28 3.1.6 Determination of the optical density 29
3.2 Isotope analyses 29
3.2.1 Mass spectrometry 29
3.2.2 Oxygen isotope composition of biogenic silica 31 3.2.3 Determination of the oxygen isotope composition of the growth medium 32 3.2.4 Determination of the oxygen isotope composition of organic matter 33 3.2.5 Carbon isotope composition of organic matter 33 3.2.6 Nitrogen isotope composition of organic matter 34
3.3 Chemical analyses 34
3.3.1 Element analysis of diatoms 34
3.3.2 Element analysis of medium and diatom suspension 35
4. RESULTS 36
4.1 Nitrate availability and growth of Fragilaria crotonensis 36 4.1.1 Nitrate availability and productivity of Fragilaria crotonensis 38
4.1.2 Element composition of Fragilaria crotonensis dry mass and C:N:Si ratios 39 4.1.3 Changes of nitrate concentration and stable carbon isotope fractionation by
Fragilaria crotonensis 42
4.1.4 Nitrate concentration and nitrogen isotope discrimination by
Fragilaria crotonensis 43
4.2 Temperature variations and growth of Fragilaria crotonensis under
nitrate-saturated conditions 45
4.2.1 Changes of the temperature and productivity of Fragilaria crotonensis 47 4.2.2 Changes of the temperature, element composition of Fragilaria
dry mass and C:N:Si ratios 47
4.2.3 Changes of temperature and stable carbon isotope fractionation by
Fragilaria crotonensis 50
4.2.4 Changes of the temperature and stable nitrogen isotope fractionation by
Fragilaria crotonensis 51
4.3 Growth of Cyclotella meneghiniana 52
4.3.1 Productivity of Cyclotella meneghiniana 55 4.3.2 Element composition and C:N:Si ratios 56 4.3.3 Carbon isotope fractionation for two different growth rates 59 4.3.4 Changes of temperature, growth rate and nitrogen isotope fractionation in
Cyclotella meneghiniana 61
4.4 Effect of light intensity on growth of Cyclotella meneghiniana 63 4.4.1 Productivity of Cyclotella meneghiniana grown at various light intensities 65 4.4.2 Light intensity, element composition and Si:C:N ratios 66 4.4.3 Light intensity and the carbon isotope fractionation during growth of
Cyclotella meneghiniana 69
4.4.4 Light intensity and the nitrogen isotope fractionation during growth of
Cyclotella meneghiniana 70
4.5 The stable oxygen isotope values of the water from continuous cultures 71 4.6 Stable oxygen isotope composition of biogenic silica from fresh water diatoms 73
4.6.1 The reproducibility of the stable oxygen isotope ratios of samples
taken during steady state conditions from the fermenter 74 4.6.2 Nitrate availability and stable oxygen isotope ratios of biogenic silica from
Fragilaria crotonensis 74
4.6.3 Temperature and stable oxygen isotope ratios of biogenic silica from
Fragilaria crotonensis 76
4.6.4 Temperature, growth rate effects and stable oxygen isotope ratios of
biogenic silica from Cyclotella meneghiniana 76 4.6.5 Light intensity and stable oxygen isotope ratios of biogenic silica from
Cyclotella meneghiniana 78
5. DISCUSSION 80
5.1 Analytical precision 80
5.2 Temperature dependent oxygen isotope fractionation 81 5.3 Oxygen isotope fractionation and nitrate availability 85 5.4 Oxygen isotope fractionation and light intensity 87 5.5 Oxygen isotope fractionation, growth rate and species-specific effects 91
5.6 Complexity of continuous cultures 95
6. RESUME AND OUTLOOK 97
7. REFERENCES 99
DANKSAGUNG 109
APPENDIX
ERKLÄRUNG GEMÄß §ABS.10 DER PROMOTIONSORDNUNG
Fig.1: Schematic overview of the diatom structure with its cell walls 12 Fig.2: Mitotic division of the diatom cell and formation of new cell walls 13 Fig.3: The diatom cell in girdle view showing the reduction in size 14 Fig.4: Diatom cell cycle and arrest points due to silicon starvation 15
Fig.5: Model of diatom growth in batch culture 17
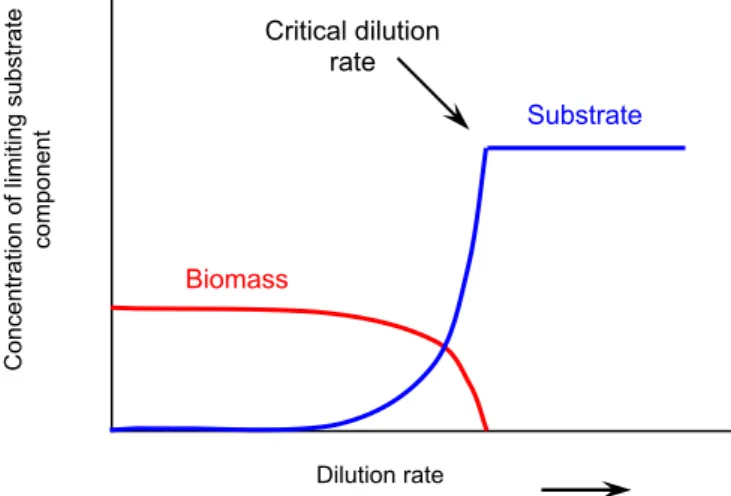
Fig.6: Schematic view of the fermenter 19
Fig.7: The behaviour of biomass and substrate concentration in a fermenter
plotted against the dilution rate 19
Fig.8: Establishment of the steady state condition in the fermenter 20
Fig.9: Batch culture set-up with illumination unit 24
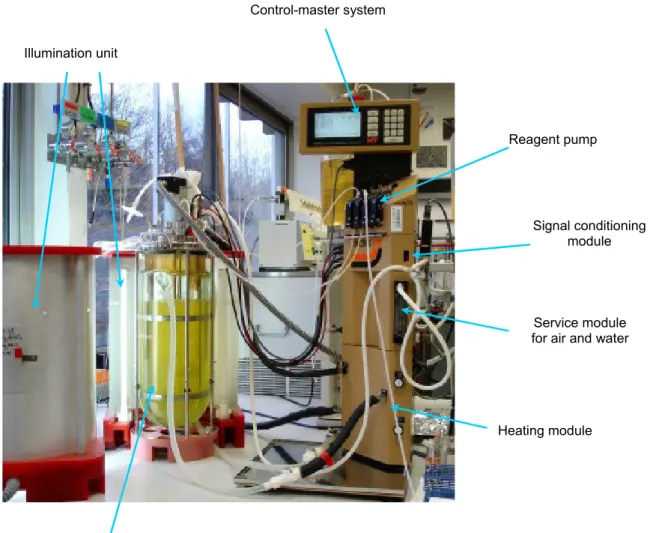
Fig.10: Fermentation set-up with illumination unit 27
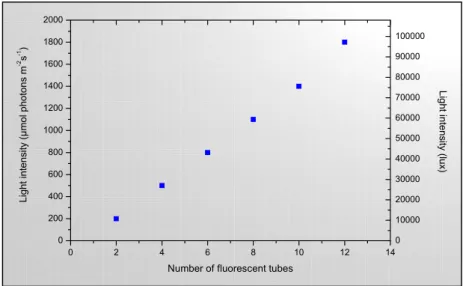
Fig.11: Capacity of the illumination unit used for continuous culture experiments 28
Fig.12: Schematic view of the mass spectrometer 30
Fig.13: Productivity of Fragilaria crotonensis depending on various nitrate concentrations
in the inflowing medium 38
Fig.14: The C, N, Si content of Fragilaria crotonensis dry mass relative to the productivity
for various nitrate concentrations of the inflowing medium 40 Fig.15: The cell length of Fragilaria crotonensis at various nitrate concentrations of the
inflowing medium 40
Fig.16: The C/N, Si/N and Si/C ratios of Fragilaria crotonensis versus nitrate
concentration of the medium 41
Fig.17: The dependence of the carbon isotope fractionation on various nitrate
concentrations of the inflowing medium 43 Fig.18: The nitrogen isotope fractionation versus various nitrate concentrations
of the inflowing medium 44
Fig.19: Productivity of Fragilaria crotonensis versus temperature 47 Fig.20: The C, N, Si content of Fragilaria crotonensis dry mass relative to the
productivity for various temperatures 48
Fig.21: The C/N, Si/N and Si/C ratios of Fragilaria crotonensis dry mass
versus temperature 49
Fig.22: Relation between pH and relative proportions of inorganic carbon
species in solution 50
Fig.23: The dependence of the carbon isotope fractionation of Fragilaria crotonensis
on various temperatures 50
Fig.24: Nitrogen isotope fractionation in Fragilaria crotonensis versus temperature 52
Fig.25: Productivity of the steady state main culture experiment V8 and repetition
tests with Cyclotella meneghiniana at different growth rates 55 Fig.26: The concentrations of C, N and Si from Cyclotella meneghiniana dry mass
depending on growth rate 57
Fig.27: The C/N, Si/C and Si/N ratios of Cyclotella meneghiniana versus
growth rate and temperature 59
Fig.28: The carbon isotope discrimination of Cyclotella meneghiniana grown
at various growth rates and temperatures 60
Fig.29: Nitrogen isotope discrimination of Cyclotella meneghiniana versus
temperature and growth rate 62
Fig.30: Productivity of Cyclotella meneghiniana grown under various light intensities 65 Fig.31: The C, N and Si content of Cyclotella dry mass relative to productivity
as a function of the light intensity 67 Fig.32: The Si:C:N ratios of Cyclotella meneghiniana dry mass versus the light intensity 68 Fig.33: The carbon isotope discrimination of the Cyclotella grown under various
light intensities 70
Fig.34: The nitrogen isotope discrimination of Cyclotella meneghiniana grown under
various light intensities 71
Fig.35: The δ18O values of the medium from the fermenter derived from
experiment Nr 15 with Cyclotella meneghiniana 73 Fig.36: Temperature dependent oxygen isotope fractionation of diatomaceous
silica from Fragilaria crotonensis and Cyclotella meneghiniana 82 Fig.37: The oxygen isotope fractionation between biogenic silica and water from
experiment Nr 5 with Fragilaria crotonensis grown for various nitrate concentrations
of the medium 87
Fig.38: Dependence of the oxygen isotope fractionation in biogenic opal
on the light intensity 89
Fig.39: The oxygen isotope fractionation of biogenic silica from Cyclotella meneghiniana
shown for two different growth rates 91 Fig.40: Dependency of the oxygen isotope fractionation at various temperatures
on growth rate 93
Tab.1: The growth medium used for continuous culture experiments with
Fragilaria crotonensis and Cyclotella meneghiniana 23 Tab.2: Different nitrogen concentrations of the stock solution 3 from table 1 used in
the growth medium for Fragilaria crotonensis and Cyclotella meneghiniana 23 Tab.3: Results of steady state culture experiment Nr 5, using Fragilaria crotonensis.
The culture was run for various nitrate concentrations of the medium 37 Tab.4: The C, N, Si content and C:N:Si ratios of dry mass selected from samples of
Fragilaria crotonensis accumulated during steady state conditions of experiment 5.
Diatoms were grown for different nitrate concentrations 39 Tab.5: Results of steady state culture experiment Nr 5 and Nr 7, using Fragilaria crotonensis.
The culture was run for different temperatures using the nitrate concentrations
of the medium of 105 mg/l 46
Tab.6: Element composition of selected samples of Fragilaria crotonensis dry mass collected during steady state conditions of experiment 5 and 7.
Diatoms were grown at different temperatures 48 Tab.7: Results of steady state culture experiment Nr 8, using Cyclotella meneghiniana.
The culture was run for different temperatures and growth rates 53 Tab.8: Results of steady state repetition experiments using Cyclotella meneghiniana 54 Tab.9: The concentrations of C, N and Si in selected samples from Cyclotella meneghiniana
dry mass accumulated during steady state conditions of main experiment V8 and repetition experiments – V6, V14 and V15. Diatoms were grown at different
temperatures and growth rates 56
Tab.10: Results of steady state culture experiment Nr 15, using Cyclotella meneghiniana.
The culture was run for different light intensities 64 Tab.11: Element composition of selected samples from Cyclotella meneghiniana dry mass
accumulated during steady state conditions of experiment Nr 15.
Diatoms were grown at different light intensities 66 Tab.12: The δ18O values of the laboratory water, freshly prepared medium and medium from
fermenter of the individual experiment 72
Tab.13: The reproducibility of the δ18O values of biogenic silica from samples of Cyclotella
meneghiniana taken during steady state conditions from the fermenter system 74 Tab.14: Stable oxygen isotope ratios of biogenic silica from experiment Nr 5 with Fragilaria
crotonensis grown for various nitrate concentrations of the medium 75 Tab.15: Stable oxygen isotope ratios of biogenic silica from Fragilaria crotonensis
grown for various temperatures 76
Tab.16: Stable oxygen isotope ratios of biogenic silica from Cyclotella meneghiniana
grown for temperatures and two growth rates 77 Tab.17: Light intensity in Lake Holzmaar throughout the year 2003 78 Tab.18: Stable oxygen isotope ratios of biogenic silica from experiment Nr 15
with Cyclotella meneghiniana grown for various light intensities 79
Tab.19: The fractionation between biogenic silica and water from experiment Nr 5
with Fragilaria crotonensis grown for various nitrate concentrations of the medium 86 Tab.20: Stable oxygen isotope ratios of biogenic silica from experiment Nr 15
with Cyclotella meneghiniana grown for various light intensities 88 Tab.21: A numerical example for a possible combined light-temperature fractionation effect
calculated for temperature variations in Lake Holzmaar during a summer day 90 Tab.22: The stable oxygen isotope fractionation (ε) of biogenic silica from
Cyclotella meneghiniana and Fragilaria crotonensis relative
to the temperature and growth rate 92
List of abbreviations
a) isotopic abbreviations
α – fractionation factor; shows magnitude of an isotope shift
δ [‰] – the relative difference in the isotope ratio between a sample and the standard in parts per thousand or per mil
Δ13C [‰] – the difference between the δ13C of organic matter and the δ13C-value of the corresponding source value, i.e. CO2.
Δ15N [‰] - the difference between the δ13C of organic matter and the δ13C-value of the corresponding source value
ε – fractionation; represents changes in isotope composition
φ [‰/100 µmol photons m-2s-1]– light coefficient; shows the permil change of the oxygen isotope ratio per 100 µmol photons m-2s-1 of light intensity change
τ [‰/°C] – temperature coefficient; shows the permil change of the oxygen isotope ratio per 1°C of temperature change
b) abbreviations in steady state cultures
D [d-1] – dilution rate of the fermenter F [l d-1] – flow rate of the fermenter
G [d] – doubling time; time after which the biomass has doubled K’ – equilibrium reaction constant
μ [d-1] – growth rate of an organism
µm [d-1] – maximal growth rate of an organism
P [mg l-1d-1] – productivity of an organism; an increment of the biomass per time unit, in other words, it is the growth rate multiplied with biomass
S – substrate
V [l] – fermenter volume X [mg] – biomass
Y – yield coefficient; indicates the degree of the substrate utilisation during formation of the cells
1. Introduction and goals of the study
Palaeoclimatology as a discipline has developed exponentially in the last 25 years.
Knowledge in the field of palaeoclimatology is valuable in its own right. It is essential to progress our understanding of the role of the physical environment as a force driving evolutionary and ecological changes (e.g. Stenseth et al., 2002). In addition, developments in other fields have allowed palaeoclimates to be studied at levels of resolution that were not possible before. Understanding palaeoclimate is the key to comprehend the long-term processes in the climate system of our planet (e.g.
Zachos et al. 2001, Rahmstorf 2002). Moreover, it is of great significance for
distinguishing between natural climate changes and the climate changes caused by
humans. The geologic record of climate change continues to be the best source of
information on the Earth's climate system. It provides a record of trends in climate
and its variability in the recent past that can extend beyond the paltry human time
scales on which climate has been measured directly. If we can understand climatic
conditions that have not existed during the history of recorded climate, we gain a
more fundamental understanding of the climate system than is attainable through
studies based solely on modern conditions. Understanding climate change over the
full variety of temporal and spatial scales recorded from geologic archives contributes
to knowledge of the fundamentals of climate dynamics. This knowledge is essential if
we are to model future climate with confidence. Analyses of proxy data (from ice
cores, corals, ocean and lake sediments, tree rings etc.) and model studies are
complementing one another. Within the set of proxy data stable isotopes constitute
an important tool in climatic investigations. Examples are the δ
18O records from ice
cores (e.g. Dansgaard et al. 1993, Stuiver et al. 1995), the δ
18O-values from
carbonate shells of foraminifers (e.g. Shackleton 1987, Mulitza et al. 2003), the δ
13C
records from tree rings (Zimmermann et al. 1997, Treydte et al. 2001), the δ
18O data
from carbonates of lacustrine sediments (e.g. Dutkiewicz et al. 2000) and the δ
18O-
values from biogenic silica (e.g. Shemesh et al. 1992). Stable isotope geochemistry
has been used increasingly in the palaeoclimate community since the work of
McCrea (1950) and Urey et al. (1951) highlighted the potential for oxygen isotope
composition to be used for palaeotemperature reconstruction. But not only the
oxygen isotopes are subject of environmental investigations. For plant biologists,
ecologists and environmental chemists the carbon and nitrogen isotopes are likewise
of great importance. The developed theoretical framework and the empirical database for the use of isotopes to study plants and animals can help to find patterns and mechanisms at the level of single organisms. This knowledge will help to trace e.g. food webs and to follow whole ecosystem cycling in terrestrial as well as marine ecosystems. Terrestrial isotope records have the potential to provide a much higher time resolution for palaeoclimate studies than most other records, but the isotopic systematics of these structures must be understood in much greater detail. E.g., up to now monitoring and calibration studies are not conducted in many lakes. In Central Europe an almost ideal research object constitutes Lake Holzmaar, which is a small soft water lake. The varved sediments, deposited in this lake, offer a well-dated high- resolution record (Negendank et al. 1990). Unfortunately, the sediments of the soft water Lake Holzmaar do not contain carbonates, which normally serve as a surrogate for climatic information. However, diatom valves, accumulated in the varved material, can be used as alternative proxy material. Some time ago an empirical correlation between the marine temperature and the δ
18O values of biogenic silica was suggested as a palaeotemperature scale (Labeyrie 1974, Juillet-Leclerc & Labeyrie 1987). The question which has always been discussed was to what extent this palaeotemperature scale can be applied to limnic systems.
This experimental work constitutes a contribution to our field studies conducted in Lake Holzmaar. On the basis of continuous cultures using diatom species occurring in Lake Holzmaar the following questions were raised:
• Is the water temperature reflected in the oxygen isotope ratio of biogenic silica?
• Is the fractionation between diatom silica and water species-specific?
• Is the fractionation influenced by other environmental factors e.g. nutrients, light intensity?
• Are there vital effects like growth rate involved in the oxygen isotope fractionation process?
Answers to these questions should help in understanding the processes which
influence the oxygen isotope ratio of diatomaceous silica in natural environments. As
such answers to these questions can be decisive for climate reconstruction if oxygen
isotopes from valves are to be used as a palaeothermometer.
2. Theoretical background
2.1 Stable oxygen isotopes, nomenclature and fractionation processes
Oxygen has three stable isotopes, namely
16O,
17O and
18O having the following abundances:
16O=99.763 %,
17O=0.0375 % and
18O=0.195 %.
Because the abundance of
17O is very low its detection requires a considerable technical effort and, therefore, it is commonly not used in oxygen isotope investigations. For studies in which the oxygen isotopes are used the
18O/
16O ratio will usually be determined and related to the international standard V-SMOW (Vienna Standard Mean Ocean Water).
In this respect the so-called δ-value plays a decisive role. Initially the isotopic composition of oxygen was given in terms of differences of
18O/
16O ratios relative to the SMOW standard (Standard Mean Ocean Water). This standard is, however, nowadays superseded by the internationally used, almost identical V-SMOW standard (Vienna-SMOW) which will be quoted throughout this study.
The isotopic composition of a sample is expressed in per mil relative to V-SMOW and denoted as δ. The relevant expression is given by:
S St 18
St
R - R
δ O (‰)= 1000
R ∗
in which R
Sis the
18O/
16O ratio of the sample and R
Stis the corresponding
18O/
16O ratio of the standard. Thus, a δ-value is the relative difference in the isotope ratio between a sample and the standard in parts per thousand or per mil (‰). The sign of a δ-value depends upon the isotope ratio of the sample relative to the standard (being positive when R
S>R
Stand negative when R
S<R
St).
Isotope fractionations appear in nature in many ways, e.g. across phase boundaries during kinetic processes etc. Basically they show up during different kinds of chemical reactions and physical processes. Generally, molecules with different isotopic masses have different reaction rates whereby the molecules containing the lighter isotope show a higher mobility and a higher reaction rate. There are principally three categories to be considered:
1. Isotope exchange reactions leading to a redistribution of isotopes from an
element amidst different molecules which contain the corresponding element.
2. Reactions operating in one direction (unidirectional) in which rates depend on the isotopic composition of reactants and products.
3. Physical processes such as e.g. evaporation and condensation, adsorption and desorption, melting and crystallisation or diffusion of molecules due to concentration or temperature differences.
The magnitude of an isotope shift is generally expressed by means of the fractionation factor α:
B B A - A R
R α =
in which R
Ais the
18O/
16O ratio (or generally the ratio of the heavy versus the light isotope) of substance A and R
Bis the
18O/
16O ratio of substance B.
The R-values of the fractionation factor α need, however, to be transformed into δ- values because the ratio of isotopes from an element can not be determined directly.
δ-values can be determined mass spectrometrically. From the definition of δ it follows:
S St 3 St
R - R
δ= 10
R ∗ rearranging results in:
R
Stδ
*10
-3= R
S- R
St| + R
StR
St(1 + δ
*10
-3) = R
SIf the ratio of substance A is denoted by R
S,Aand the ratio of substance B by R
S,Bthe two equations are then given by:
R
St(1 + δ
A*10
-3) = R
S,AR
St(1 + δ
B*10
-3) = R
S,BNote, that the corresponding δ-values are given by δ
Aand δ
B, respectively and that
the standard which is used, is identical in both cases. From these equations the
fractionation factor α follows by dividing the two expressions:
St A* -3
A-B -3
St B*
R (1+δ 10 ) α =
R (1+δ 10 )
This leads to:
A-B A
B
1000+δ α =
1000+δ (1)
Under natural conditions changes of the isotope composition are rather small and therefore, α is normally close to 1. This has led to the introduction of the fractionation ε, defined as:
α
A-B= 1 + ε
A-Bwith |ε| << 1
Taking into account equation 1 the following equation evolves for the fractionation between the two phases A and B:
A A-B
B
1000+δ 1 + ε =
1000+δ
A B
A-B
B
1000+δ -1000 - δ ε =
1000+δ
A-B A B
B
δ - δ ε =
1000+δ
As mentioned, ε is very small. It has, therefore, been agreed that the value should be given in per mil as in the case for the δ-value. Multiplying by 1000 results in:
A B 3 A-B
B
δ - δ
ε (‰)= 10
1000+δ ∗
A-B A B-3 B
δ - δ ε (‰)=
1 +10 ∗ δ (2)
In many cases 10
-3*δ
B(δ
Bgiven in per mil) is very small, i.e. |10
-3*δ
B| << 1 and, thus, ε can to a good approximation be written as:
A-B A B
ε ≈ δ - δ
, the difference δ
A– δ
Bwill normally be given as Δ. (3)
In general changes of the isotope composition will be given either in terms of the fractionation factor α or as the fractionation ε. Both equations are in use internationally. Frequently lnα is used instead of α, the reason being a direct relation of lnα with temperature. For the relation of α and ε this leads to:
A-B A-B
lnα = ln(1 + ε ) , with |ε| << 1, resulting in:
A-B A-B
lnα ≈ε
and in terms of per mil it follows:
A-B A-B
1000 lnα ≈ε
in this case ε is given in per mil.
Finally this results in:
A B
A-B A-B -3 A B = A,B B
δ - δ
Δ1000 lnα ε = δ - δ
1 + 10 δ
≈ ≈
∗ (4)
For simplicity reasons this study will primarily concentrate on ε, however, a conversion to α can easily be performed. Most important, the fractionation factor α is temperature dependent, as is the fractionation ε:
α
A-B= α(T) and ε
A-B= ε(T)
Thus, from the magnitude of the isotope fractionation it should in principle be
possible to determine the temperature conditions, which prevailed at the formation
time of the substance in question, provided the initial isotope value is known (the
corresponding source value). The higher the temperature is, at which a reaction
proceeds, the smaller is the fractionation factor α as well as the fractionation ε.
Relating to the temperature, the subject of interest is the so-called temperature coefficient τ, which can be defined as:
τ Δε
[‰/°C]
= ΔT or in the exact form: τ 1000 ln α
2/α
1= ΔT
With α
2being the fractionation at temperature T
2and α
1the fractionation at temperature T
1. This coefficient shows the permil change of the oxygen isotope ratio per 1°C of temperature change (τ [‰/°C]).
2.2 Stable oxygen isotopes of biogenic silica
Ratios of stable isotopes are one of the most useful “detective” tools for understanding physical, chemical, and biological processes in nature, especially for events that occurred in the distant past. The potential of the stable oxygen isotopes of biogenic silica as proxy was hitherto rarely exploited. In many cases the temperature reconstruction on the basis of opaline oxygen isotope values provides a very promising tool in palaeoclimatological research. But its application has been restricted due to difficult and not totally reliable analytical techniques (Juillet 1980;
Labeyrie & Juillet 1980; Labeyrie & Juillet 1982). However, biogenic silica can serve as a climate archive where biominerals such as carbonates are not available. Many aquatic plants e.g. diatoms, chrysophytes, silicoflagellates and radiolarians build up amorphous siliceous structures (i.e. valves, cysts, skeletons) which are frequently found in marine sediments as well as lake sediments. Juillet-Leclerc & Labeyrie (1987) developed a palaeotemperature scale, based on δ
18O
SiO2values of marine biogenic silica extracted form the upper part of sediment cores. Juillet-Leclerc &
Labeyrie (1980, 1982) highlighted two main problems concerning diatom valves.
Firstly, separation from the sediment and secondly analytical difficulties associated with the separation of water molecules and OH groups from the silica surface.
Achievement of a clean sample is indispensable to produce a reliable relationship between water temperature and the oxygen isotope composition of biogenic silica.
Although the existence of a correlation was experimentally confirmed, different authors determined different isotope fractionations depending on the pre-treatment of samples and the extraction technique used for the oxygen isotopes (Juillet-Leclerc &
Labeyrie 1987; Matheney & Knauth 1989; Schmidt et al. 1997; Brandriss et al. 1998;
Schmidt et al. 2001; Moschen et al. 2005). The investigations resulted in temperature coefficients which according to different authors varied from -0.19 to -0.50 ‰/°C (Juillet-Leclerc & Labeyrie 1987; Matheney & Knauth 1989; Clayton 1992; Shemesh et al. 1992; Shemesh et al. 1995; Brandriss et al. 1998; Moschen et al. 2005). The reasons of these discrepancies remain up to now unclear.
According to the isotope theory the temperature signal stored in diatom valves should remain unchanged. Schmidt et al. (1997), however, found a distinct difference between the δ
18O of diatoms from sediments and the δ
18O of fresh diatoms. Possibly the isotope exchange processes with ambient H
2O during diatom sedimentation may control the oxygen isotope composition of diatoms deposited in sediments (Rimstidt
& Barnes, 1980; Gallinari et al., 2002; Rickert et al, 2002). It is also possible, that metabolic processes associated with the cell cycle of living diatoms may have an influence on the oxygen isotope ratio and, thus, species-specific effects can not be excluded. Storing of a δ
18O signal by diatoms occurs in the course of the valve formation. Prior to the development of a daughter cell the diatom cell transports silicic acid into the silicon deposition vesicle (SDV) and it is possible that during this cycle an additional metabolic effect (biological effect, β) appears apart from the physical equilibrium reaction. Besides temperature environmental factors, such as light or e.g.
nutrients, can influence the cell metabolism and thus, the oxygen isotope ratio of silica. Detailed information about these processes derived from laboratory experiments is still missing. Knowledge about the possible processes involved could help in the interpretation and calibration of the isotope thermometer.
According to present day knowledge the oxygen isotope composition of biogenic silica deposited by aquatic organisms depends primarily on the temperature and the isotopic composition of the water. The δ
18O value of the water constitutes the starting point for oxygen isotope fractionation during biogenic silica formation (source value).
This dependence can simply be written as:
δ
18O
H4SiO4= f (T, δ
18O
H2O) → δ
18O
SiO2= f (T, δ
18O
H4SiO4, β)
where T is the temperature, δ
18O is the isotope value according to the corresponding
index and β is a biological parameter. Hydration between water and dissolved silicic
acid proceeds in isotopic equilibrium. This isotopic distribution at equilibrium is a function of the free energy of the reaction as well as temperature:
K'
16 18 18 16
12
Si O + H O
2 2←⎯→
12Si O + H O
2 2The isotope fractionation between biogenic silica and water is supposed to be an equilibrium reaction with an equilibrium reaction constant K’ being related to the fractionation factor α as follows:
1 1 1
2 2 2
2
12 2
18 16 18 16 18 16
2 2 2 2 SiO
18 16 18 16
16 18
2 2 H O
2 2
[Si O ] [H O] [Si O ] / [Si O ] [ O/ O]
K ' = = = α
[H O]/[H O] [ O/ O]
[Si O ] [H O]
= ∗
∗
SiO2 / H2Owhere α
SiO2 / H2O= const., for T = const.
2.3 Stable carbon isotopes and fractionation processes
In nature two stable carbon isotopes exist, namely
12C and
13C with the following abundances:
12C= 98.89% and
13C= 1.11%. As in the case of the oxygen isotopes, carbon isotope shifts are described by δ-values and given in the form of differences of
13C/
12C related to a standard. For carbon isotopes the internationally adopted reference is CO
2obtained from a fossil belemnite from the Pee Dee formation of South Carolina, USA. It is denoted as PDB (Craig, 1957) and has the following isotope composition:
13C/
12C
PDB= 0.01124. All δ
13C values in this investigation will be related to this standard.
The carbon isotope fractionation both in terrestrial and aquatic plants takes place during photosynthesis as plants take up CO
2into their cells. Generally two steps are relevant in biological carbon fixation. The first step is the diffusion of CO
2into the intercellular air spaces and/or diffusion of carbon dioxide into particular intracellular compartments. The second step is the biosynthesis of cellular components:
1 2
2 (external) 2 (internal)
CO ←⎯→ CO ⎯⎯→ organic compounds
The diffusion process (1) is reversible, whereas the enzymatic carbon fixation (2) is
irreversible.
In aquatic environments fractionation of carbon occurs not only during diffusion and assimilation. There is also a fractionation occurring during the dissolution of carbon dioxide in the water and during the dehydration of CO
2to bicarbonate (Mook et al.
1974, Zhang et al. 1995). The concentration of dissolved CO
2in water is relatively low compared to the atmosphere, and strongly temperature dependent, so most species of aquatic plants are adapted to the uptake of CO
2via passive diffusion and bicarbonate ion production (active transport across the diffusion layer)
Environmental conditions such as water movement, light intensity and temperature control the development of aquatic plants and show the dominant influence on their isotopic carbon composition.
1. Water movement. The low diffusion rate of CO
2in water creates severe limitations for the carbon uptake. In addition the carbon influx is restricted by the boundary layer (BL) surrounding the plant cells. The thickness of the BL plays a decisive role for the transport of carbon dioxide and may create a barrier blocking the uptake. Greater water velocity, i.e. movement reduces the BL thickness.
2. Light. Many studies have shown that light intensity affects the metabolic rate of aquatic plants and simultaneously the carbon isotope composition of them (e.g. Thompson & Calvert 1994). High light levels increase the carbon demand, which might reduce discrimination against δ
13C.
3. Temperature. The temperature of the water has an influence on solubility of gases and the solubility increases with decreasing temperatures. The amount of CO
2dissolved in freshwater at normal pressure (1013 hPa) is about 3350 mg/l at 10°C and 1690 mg/l at 20°C (Schwoerbel 1993). This highlights the strong dependency of dissolved CO
2on the temperature. In this temperature range of 10°C the solubility decreases almost by a factor of 2. Because the concentration of dissolved CO
2increases as the temperature decreases, discrimination might well increase due to greater availability of carbon. The δ
13C values of aquatic plants correlate with temperature and are inversely proportional to the temperature (Degens et al. 1968). Temperature also affects the equilibrium fractionation between CO
2 (aq)and HCO
3-by approximately 3‰
(Mook et al. 1974; Hinga et al. 1994) and produces different amounts of CO
2and HCO
3-available for uptake.
2.4 Isotope signatures of nitrogen in algae
Nitrogen has two stable isotopes namely
14N and
15N with the following abundances:
14
N= 99,64% and
15N= 0,36%. In isotopic investigations the nitrogen isotopes of atmospheric nitrogen (N
2) are commonly used as reference.
Nitrogen is an essential component of nutrition for all organisms and together with other nutrients like phosphorus and silicon can limit the algal productivity in many lakes. Changes in nitrogen cycling influence the production of organic matter and, thus, affect the composition and accumulation of sedimentary organic matter.
Normally nitrogen of lacustrine sediments is characterized by total nitrogen (TN) or by the C/N ratio. N-isotopes were up to now rarely applied in limnological investigations. However, the isotope ratio and its changes due to kinetic isotope fractionation can provide important information about nitrogen sources and utilisation characteristics of an ecosystem. Nitrogen isotopes can even be useful in interpreting environmental changes of the past (e.g. Haug et al. 1998).
While the mechanisms of carbon isotope discrimination during photosynthetic carbon fixation are well understood, the biochemistry of nitrogen isotope fractionation in microalgae is presently not well known. In addition most of the presently available investigations are based on marine ecosystems.
It is known that the nitrogen isotope fractionation by phytoplankton follows the Rayleigh model (Mariotti et al. 1981). There are several possibilities of fractionation during the uptake of inorganic nitrogen. These are:
1. flux of NO
3-by diffusion across the boundary layer
2. active transport (uptake step) of NO
3-across the plasma membrane 3. intracellular reduction of NO
3-to NO
2-by nitrate reductase (NR) 4. the reduction of NO
2-to NH
4+and formation of amino acids
Recent studies suggest that the isotope fractionation by phytoplankton occurs during
the reduction of nitrate by nitrate reductase and that the efflux of isotopically heavier
nitrate is ultimately responsible for the measured isotope effect (Shearer et al. 1991,
Needoba and Harrison 2004).
GIRDLE BANDS
GIRDLE BANDS EPIVALVE
HYPOVALVE
EPITHECA
HYPOTTHECA
FRUSTULE RAPHE
2.5 Diatoms
Diatoms or Bacillariophyceae are unicellular, frequently colonial algae found in aquatic habitats. These free-living photosynthetic autotrophs occur as plankton or periphyton. They normally exist as single cells with diameters between 5 µm and 5 mm, depending on the species (Van den Hoek 1997). The cell walls of diatoms are silicified and transparent, forming a structure called frustule containing hydrated amorphous silica with the general formula [SiO
2 2∗ nH O] . Amorphous silica constitutes an essential component of the diatom cell wall. Thus, Si availability is the key factor regulating diatom growth in nature. The complicated siliceous structures in the diatom cell wall are replicated with precision for each generation creating inimitable morphotypes used generally as taxonomic keys. The number of recognized species amounts to over 100.000 (Round et al. 1990). The chloroplasts of diatoms contain chlorophyll a, c
1and c
2with the major carotenoid being fucoxanthin giving the cells its characteristic golden-brown colour.
The Bacillariophyceae comprise two major groups namely the centric diatoms (Order Centrales) and the pennate diatoms (Order Pennales). Both orders are systematized according to differences in cell wall structure. The frustule of a pennate diatom is elongated, with a lanceolate or elliptical shape. The shell consists of two halves:
hypotheca and epitheca (see Figure 1). The hypotheca consists of a hypovalve and hypocingulum (lower girdle). Analogously, the epitheca comprises an epivalve and epicingulum (upper girdle). In many pennate diatoms the valve possesses a rift lying along the apical plane which is named the raphe. Generally the raphe is involved in locomotion and diatoms without raphes cannot move actively. The skeletons of centric diatoms are round and radially symmetrical. They do not have the raphe.
Figure 1: Schematic overview of the diatom structure with its cell walls.
2.5.1 Cell division
Cell division in diatoms is an asexual reproduction process whereby two daughter cells develop. The cell division of both pennate and centric diatoms is very similar (Van den Hoek et al. 1997)
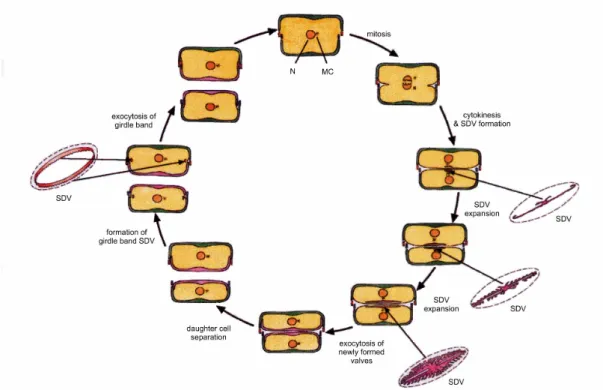
Prior to the cell division both valves elongate (see Figure 2). Mitosis then takes place and division of the protoplast occurs. After that a formation of the silica deposition vesicle (SDV) follows, which is responsible for the development of new valves. The SDV elongates and extents. The new valve is starting to form with the help of the SDV by direct uptake of silica, polysaccharides and proteins. In the course of the silica polymerisation the SDV becomes acidic (Vrieling et al. 1999). Once valve biogenesis is complete the exocytosis occurs, i.e. fusion of the SDV membrane (silicalemma) with the plasma membrane. As a result the inner surface of the silicalemma becomes the new plasma membrane.
Figure 2: Mitotic division of the diatom cell and formation of new cell walls. N – Nucleus, MC – Microtubule centre, SDV – Silica deposition vesicle (see Zurzolo & Bowler 2001).
Afterwards the daughter cells separate. The new elements of the girdle in daughter
cells are formed later, when the valve formation is complete. They are also formed
within SDVs.
In each daughter cell the newly synthesized half is always a hypotheca. As an effect of this division, one of the daughter cells retains the same size as the parent cell while the second is smaller. Thus, average cell size in diatom populations decreases successively (see Figure 3). But not all species become smaller during division.
Some of them have an elastic girdle and can keep up their size.
Figure 3: The diatom cell in girdle view showing the reduction in size.
If cells reach a minimal size auxospores will built-up, through which the initial size of the cells will be restored. The auxospores are formed before the cells reach their absolute minimum size, beyond which variability ceases. The smallest cells are unable to form auxospores and divide vegetatively until they die.
2.5.2 Cell cycle and formation of the cell wall
Numerous studies on the process of silification of diatom cell walls have been carried out (e.g. Schmid et al. 1981, Schmid and Volcani 1983). The process of frustule formation is partially understood and is mainly based on microscopical observations.
It is known that cell wall silicification and transport of silicic acid are fixed to the cell
cycle (e.g. Brzezinski 1992). This coupling of cell cycle and silicic acid uptake has
substantial implications. E.g. in Navicula pelliculosa (Bréb.) Hilse, the deposition of
the entire frustule occurs during one continuous segment beginning just before
division and ending just before daughter cell separation. Silicic acid uptake in this
species is confined to the same segment of the cell cycle (Sullivan 1977). However,
in species constructing the major part of the frustule at other points in the cell cycle
the coupling of uptake and division may be weaker (Brzezinski 1994).
In the diatom cell cycle a series of Si dependencies have been identified and generally in diatom mitosis two checkpoints were distinguished (Brzezinski et al.
1990). The first one appears at the G
1/S boundary (see Figure 4) and tests the environment whether sufficient Si exists for completion of the cell division. If not enough Si is available the cell division will be stopped. The second arrest point appears during G
2/M boundary and is associated with the construction of the new valves i.e. the hypotheca (Brzezinski et al. 1990).
Figure 4: Diatom cell cycle and arrest points due to silicon starvation (Brzezinski et al. 1990).
2.5.3 Silicic acid uptake
Lewin (1954, 1955) first studied silicon uptake by diatoms and Paasche (1973) investigated kinetic measurements of uptake. Subsequent studies by Paasche (1973), Azam et al. (1974), Nelson et al (1976) and Sullivan (1976, 1977) demonstrated that silicic acid assimilation follows Michaelis-Menten or Monod kinetics. Those findings show that silicon transport is carrier-mediated. In marine diatoms it is sodium dependent and in freshwater species it is apparently coupled to sodium and perhaps potassium (Sullivan, 1976).
Diatoms display three different techniques of silicic acid incorporation: surge uptake, internally controlled uptake and externally controlled uptake (Conway et al. 1976, 1977):
M
G2
S G1
Secondary arrest point Predominant
arrest point
M - mitosis
S - DNA replication G1 and G2 - gap phases
• Surge uptake processes occur when intracellular silicon pools are depleted, and the concentration gradient into the cell is maximal. Thus, there is a drag of silicon into the cell. During surge uptake assimilation rates are maximal. This would indicate that the intake of silicon is not purely diffusion controlled but facilitated through energy provided by assimilation.
• Internally controlled uptake occurs when intake is controlled by the rate of silicon utilisation for cell wall deposition (Conway et al. 1976, 1977).
• Externally controlled uptake occurs when the extracellular Si concentration drops to very low levels. In that case the uptake rates are a function of decreasing substrate concentration (Conway et al. 1976, 1977).
These processes might well have an influence on silicon isotope behaviour.
2.6 Culture principles
Physiological, biochemical and isotopic investigations of diatoms are generally conducted by using diatom cultures. The obtained data reflect the activities of diatom cells. The most popular way of culturing algae, i.e. diatoms, is to grow them in so called batch cultures. Patterns of growth and cell metabolism as derived from batch cultures are of interest for understanding the behaviour of phytoplankton in the natural environment.
If a culture is to be investigated with regard to particular conditions over a long time period, whereby just one parameter (e.g. temperature, CO
2-concentration, light intensity etc.) varies, batch cultures are not well suited. In that case a second type of culture method can be used, namely the procedure of continuous culture providing constant growth conditions, i.e. steady state conditions.
2.6.1 Basic principles of batch culture
Theoretical analyses of microbial growth were first made by Monod (1950) and also Novick & Szilard (1950).
Algae grown in batch culture will typically proceed through a number of phases (see Figure 5). The following five phases can be itemised: (I) lag phase without cell density to increase, (II) exponential growth phase with geometric increase of cell density, (III) phase of declining relative growth rate, (IV) stationary phase with constant cell density and (V) death phase. Most interesting are phases (II) and (III).
Under ideal conditions with no growth limiting factor growth proceeds exponentially.
Figure 5: Model of diatom growth in batch culture – phases of growth. (I) lag phase, (II) exponential phase, (III) phase of declining relative growth rate, (IV) stationary phase with constant cell density and (V) death phase.
The actual rate of growth accelerates successively due to continuous cell division and it can be expressed by:
0 µ t
X = X e ∗ (1)
and therefrom results:
0
0
ln X - ln X 1 X
µ = = ln
t t X (2)
where t = time (h) during which algae grew from algal density X
0to X, X
0= cell mass (dry weight, biomass or cell count) at time 0, the beginning of growth; X = cell mass at time t, µ = specific growth rate (h
-1).
The time after which the initial biomass has doubled taken as X related to X
0is named the doubling time G, which equals the generation time if the cells divide into two:
X=2X
0→ X/X
0=2 So when
0
0
ln X - ln X = ln X = ln 2 , t = G
X
Logarithm of cell number
Time I
II
III IV
V
and thus:
G = ln 2
µ (3)
If the culture reaches growth phase (III) external factors start to limit the growth (i.e.
nutrient deficiency) where µ becomes smaller. The specific growth rate is limited by a chemical component of the available substrate S and is for these conditions given by µ. The magnitude of the growth rate µ depends on the concentration of the growth limiting factor. Monod (1942) suggested a formula which is analogous to the enzyme- substrate equation defined by Michaelis & Menten (1913):
m s