• Keine Ergebnisse gefunden

Why do some MPs invest more in constituency communication than others? Usingdata from the Communications Allowance between 2007 and 2010,

N/A
N/A
Protected

Academic year: 2021

Aktie "Why do some MPs invest more in constituency communication than others? Usingdata from the Communications Allowance between 2007 and 2010,"

Copied!
4
0
0

Wird geladen.... (Jetzt Volltext ansehen)

Volltext

(1)

April 15, 2018 blogs.lse.ac.uk/politicsandpolicy/factors-affecting-how-much-an-mp-spends-on-communications/

Why do some MPs invest more in constituency communication than others? Using data from the Communications Allowance between 2007 and 2010, Katrin Auel and Resul Umit identify key incentives that explain this puzzle.

Everyone agrees that parliamentarians should keep in touch with the people they represent: constituents demand more of their representatives’ attention, while parties encourage their members to reach out to the people in order to pass political

messages. Yet in the UK, some MPs invest more in communication with their constituents than others. Is there a logical explanation for this puzzle? Which constituencies are more likely to hear from their MPs?

Our research addresses these questions by looking at MPs’ Communications Allowance, in place between 2007 and 2010. We find that rebellious MPs, senior

MPs, and those who do not seek re-election communicate less with their constituents. In contrast, MPs in marginal seats, those who are more active in parliament, and those who represent urban constituencies communicate more. We see these results as evidence of MPs’ constituency

communication depending on challenges to their re-election. Communication is an important tool for MPs to convince their electors of their trustworthiness, and the more that job is insecure, the more incentives they have to communicate.

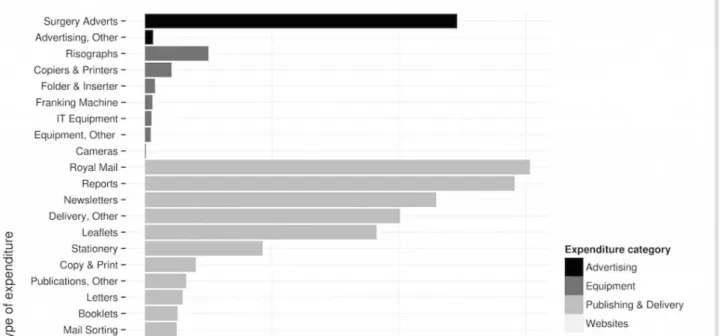
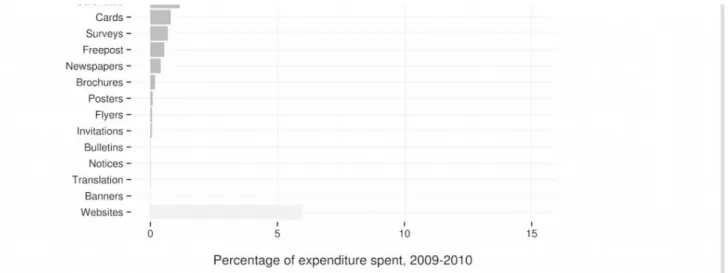
Figure 1 shows on what MPs spent their allowance during the 2009—2010 parliamentary term, highlighting expenses such as publications and postage costs, advertising constituency surgeries, and maintaining websites.

Figure 1: Percentage of allowance spent on individual types of expenditure (2009–2010).

What determines how much an MP spends on communicating with their con... https://www.printfriendly.com/p/g/sc9zRA

(2)

Before the introduction of the Communications Allowance, the prevailing assumption was that MPs would use this new allowance to the maximum. We find that this was clearly not the case. On average, MPs claimed only a little over 70% of it. Yet, there were also relatively large deviations.

While a few MPs preferred not to use their allowance at all, others used almost two and a half times their limit by moving funds from other allowances into the Communications Allowance.

Yet a more nuanced look at how MPs used their allowance suggests that the predictions were not completely off — at least for those MPs seeking re-election. Figure 2 shows that MPs seeking re- election spent significantly more (on average, £2212.66 more per parliamentary term) on

communicating with their constituents. Moreover, while MPs seeking re-election spent on average more or less the same to communicate with their constituents in three parliamentary terms, the rest significantly cut down their communication expenditure as the election year got closer.

Figure 2: Communications expenditure of MPs (2007–2010)

There is further evidence that re-election is an important incentive for MPs’ parliamentary

communication in between elections. First, we find that senior MPs claimed significantly less from

What determines how much an MP spends on communicating with their con... https://www.printfriendly.com/p/g/sc9zRA

(3)

their allowance to communicate: every year served as an MP lessened the claims by £56.69. This may be because senior incumbents will have built a reputation with their voters. In contrast, MPs in more marginal seats have to increase the number of voters trusting them and so have far greater incentives to invest in communication. Indeed, we find that MPs’ claims increased with the

marginality of their seat by £69.31 per percentage point.

With regard to MPs’ work in parliament, we find that the more an MP attends parliamentary votes, the more they invest in communication. They simply have more to communicate to their

constituents as a result. However, where their work goes against the party line, these rebellious MPs do the complete opposite and spend less. This is especially the case among rebellious MPs in marginal seats.

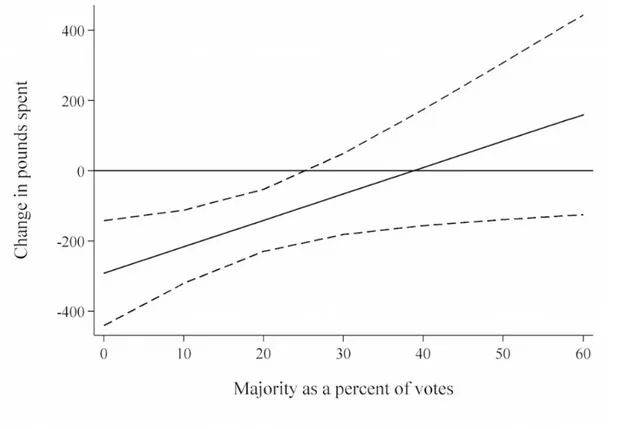
Figure 3 plots the relationship between votes against party line and communication with

constituents, for different levels of electoral safety. It shows that the negative effect of voting against the party line on communicating with constituents decreases with increasing majority; this may be because dissenting votes may lead part of the rebel’s electorate to realise that the rationale behind the rebel vote was unrelated or in opposition to their own preferences.

Figure 3: Average marginal effects of rebellion on change in communications expenditure, conditional on electoral majority.

With regard to constituency characteristics, we find that MPs representing densely populated urban constituencies spend significantly more than those from relatively rural constituencies. The latter can generally rely on being better known to their constituents due to a slower turnover in the electorate.

Urban constituencies, in contrast, are more challenging as changes in the electorate happen more quickly, thus increasing the need for MPs to win over prospective voters continuously.

What determines how much an MP spends on communicating with their con... https://www.printfriendly.com/p/g/sc9zRA

(4)

These findings all underline that the degree in which MPs invest in communication depends on re- election-related incentives. It is difficult, at least in practice, to separate communicative

accountability from electoral accountability: what happens in between elections, and specifically how much MPs communicate with their constituents, also depends on what happened in the last election, and what might happen in the next one.

_________

Note: the above draws on the authors’ published work in the British Journal of Politics and International Relations.

About the Authors

Katrin Auel is Head of the Research Group European Governance and Public Finance at the Institute for Advanced Studies, Vienna.

Resul Umit is a post-doctoral researcher at the University of Lucerne.

All articles posted on this blog give the views of the author(s), and not the position of LSE British Politics and Policy, nor of the London School of Economics and Political Science. Featured image credit: Pixabay (Public Domain).

What determines how much an MP spends on communicating with their con... https://www.printfriendly.com/p/g/sc9zRA

Abbildung

Figure 1 shows on what MPs spent their allowance during the 2009—2010 parliamentary term, highlighting expenses such as publications and postage costs, advertising constituency surgeries, and maintaining websites.
Figure 2: Communications expenditure of MPs (2007–2010)
Figure 3 plots the relationship between votes against party line and communication with

Referenzen

ÄHNLICHE DOKUMENTE

 V4 countries should continue to intervene in debates on free movement across the European Union, emphasizing the positive elements, benefits of and opportunities created

Fine-grained ASLR • not sufficient against adversary with ability to bypass standard ASLR via memory

As for the outcome, the governing party is hopeful that by combining the early parliamentary elections with the second round of presidential elections on 27 th April, it will

In contrast, Schüler and colleagues con- ducted studies showing that the positive effects of competence and relatedness need satisfaction on well-being outcomes are stronger

Shi Yinhong, director of the Center for American Studies at Renmin University, warns in the Financial Times: “When Hu Jintao took over [in 2002] China didn’t need to look to Russia

Thank you very much for the interest in submitting a paper to “Religion in the Roman Empire” (Mohr Siebeck). In order to facilitate the process of reviewing and the editorial

An inordinately large share of core contributions is used to cover these costs (see Box 1). The burden is spread very unevenly, with 10 OECD coun- tries contributing some 65 per

Calculations in this index on the percentage change in real annually committed funds per capita to the 11 th EDF compared to the 10 th EDF indicate that the EU12 Member States’