IZA DP No. 2613
The Racial Test Score Gap and Parental Involvement in Britain
Eleonora Patacchini Yves Zenou
DISCUSSION PAPER SERIES
Forschungsinstitut zur Zukunft der Arbeit Institute for the Study
February 2007
The Racial Test Score Gap and Parental Involvement in Britain
Eleonora Patacchini
University of Rome “La Sapienza”
Yves Zenou
Research Institute of Industrial Economics, GAINS, CEPR and IZA
Discussion Paper No. 2613 February 2007
IZA P.O. Box 7240
53072 Bonn Germany
Phone: +49-228-3894-0 Fax: +49-228-3894-180
E-mail: iza@iza.org
Any opinions expressed here are those of the author(s) and not those of the institute. Research disseminated by IZA may include views on policy, but the institute itself takes no institutional policy positions.
The Institute for the Study of Labor (IZA) in Bonn is a local and virtual international research center and a place of communication between science, politics and business. IZA is an independent nonprofit company supported by Deutsche Post World Net. The center is associated with the University of Bonn and offers a stimulating research environment through its research networks, research support, and visitors and doctoral programs. IZA engages in (i) original and internationally competitive research in all fields of labor economics, (ii) development of policy concepts, and (iii) dissemination of research results and concepts to the interested public.
IZA Discussion Paper No. 2613 February 2007
ABSTRACT
The Racial Test Score Gap and Parental Involvement in Britain
We investigate the racial gap in test scores between black and white students in Britain both in levels and differences across the school years. We find that there is an increasing racial gap in test scores between ages 7 and 11, and a decreasing one between ages 11 and 16.
Using the richness of information of the National Child Development Study, we find that the evolution of the racial test score gap reflects the racial parenting gap. The latter can, in turn, be explained by the fact that, during this period, the social structure of black families has gone through important changes while it has remained roughly the same for white families.
JEL Classification: I21, J15, J24
Keywords: ethnic minorities, education, cultural differences, family structure
Corresponding author:
Yves Zenou
Research Institute of Industrial Economics Box 55665
102 15 Stockholm Sweden
E-mail: yvesz@riie.se
1 Introduction
The racial gap in student achievement in the United States is by no means a new development.
For years, evidence of disparities in achievement have shown up in test scores, grades, drop-out and graduation rates, and almost every relevant indicator of academic performance. There are significant differences in measures of performance among African American, Latino, and Native American students who generally fall on the lower end of the achievement spectrum, with larger numbers of White and Asian students more likely to be found at the higher end.1 Also, important differences in test scores between blacks and whites appear at early ages and persist. Indeed, during the school years (especially thefirst two years), blacks lose substantial ground relative to other races (Phillips et al., 1998; Fryer and Levitt, 2004).
While studies of the racial gap are pervasive in the United States, relatively few are conducted elsewhere. In recent years, Europe has acquired the features of a multicultural and multiethnic society, and there is a growing awareness that research is needed to understand the sources of ethnic differences in economic and social variables in the European context.
This paper contributes to this rising strand of the literature by examining the black-white gap in school performance in Britain.
There are a number of reasons that have been advanced to explain the continuing and growing black-white education achievement gap. Sharp differences in family incomes are a major factor2 as well as students’ background and family (e.g., Brooks-Gunn et al. 1996; Phillips et al. 1998).
Also, public schools in many neighborhoods with large black populations are underfunded, inade- quately staffed, and ill equipped to provide the same quality of secondary education that is offered in predominantly white suburban school districts (e.g., Cook and Evans, 2000; Ferguson, 1998).
Acknowledging these factors, we argue that parental involvement in their children education also plays an important role in explaining the evolution of the racial gap in test scores.
The extent and importance of cultural differences between races is acquiring an increasing attention among economists.3 Racial integration and assimilation policies are at the forefront of the political debate in Europe.4 In a recent study, Bisin et al. (2006) analyze the effect of mixed
1See, for example, Carneiro and Heckman (2003) and Neal (2006).
2In 2005, 28 percent of all black SAT test takers were from families with annual incomes below $20,000. Only 5 percent of white test takers were from families with incomes below $20,000. At the other extreme, 7 percent of all black test takers were from families with incomes of more than $100,000. The comparablefigure for white test takers is 27 percent.
3The relationship between ethnic diversity and economic performance is extensively studied and surveyed by Alesina and La Ferrara (2005).
4In Europe different integration policies and ambitious social programs have been recently implemented in urban areas where immigrants live. This is the case, for instance, for the creations of Zones of Educational Priority (ZEP’s,
neighborhood on ethnic identity formation and socialization in Britain. Yet, empirical analysis of racial differences in economic performance in Europe are still quite limited. This dearth of research is partly motivated by the scarcity of data on these topics in Europe.
In this paper, we exploit the unique characteristics of the National Child Development Study (NCDS), which is a longitudinal survey interviewing a sample of British persons at age 7, 11 and 16 (and even after), and containing very detailed information on cohort’s members family environment and background, parental behavior, attitudes, school and education. We are thus able to investigate the evolution of the racial test score gap at different children’s ages, using a set of “non standard”
controls, focussing in particular on the parental interest in the child’s education.5
We find that, at age 7, there is substantial gap between black and white pupils both in math-
ematics6 and reading test scores that cannot be totally explained by observable characteristics, which include family structure, socio-economic status, measures of school and neighborhood qual- ity. While the average white student’s performance remains roughly constant over the school years, the one of blacks varies dramatically. Between 7 and 11 years, the gap widens, with blacks losing substantial ground in respect of whites. Between 11 and 16 years, however, the performance of blacks increases, thus shrinking again the gap when students reach the age of 16. We investigate if the existence of strong cultural differences in parenting and attitude towards education between races may explain this racial gap both in levels and in differences across the school years. Wefind that a non-negligible part of the test score racial gap can be explained by these cultural differences.
We then investigate the evolution of the black-white gap in test scores in UK. Changes in parental interest over time are found to be key factors in shaping the children’s progress in academic performance between school years. This evidence is stronger when reading test scores are considered than when using mathematics test scores. Indeed, the children performance in mathematics might be mainly driven by unobserved ability and genetic factors whereas performance in reading is more likely to be affected by parental care.
We interpret our results as follows. Observable family background variables (parental inputs)
‘Zones d’Education Prioritaire’) and for the rehabilitation of bleak housing projects in immigrant neighborhoods under the guise of urban policy (‘politique de la ville’) in France. However, the results of these policies seem to be quite limited.
5Our study is quite novel for the UK. Indeed, most papers on racial gap in education are snapshots on a sample of students (see, e.g. Bradley and Taylor, 2004; Gillborn and Mirza, 2000; Modood, 2005). A notable exception is Wilson et al. (2005) where the focus is on the evolution in test scores between different ethnic groups and whites in England. However, they consider only quite standard personal and school controls. Using a different dataset, our paper has a clear distinct objective since we focus on differences in parenting to explain the level and evolution of the racial gap in Britain.
6To be more precise, it is arithmetic. In the paper, we use interchangeably mathematics and arithmetic.
might be important prior to reaching school age. In the early years of school (i.e. the period investigated by Fryer and Levitt, 2004),7 school quality is a critical input into educational gains.
As children grow older, the importance of largely unobservable factors, such as parental involvement, which are likely to reflect a different social structure of households across races, play a crucial role in shaping the racial test score gaps among teenagers. We find indeed that the evolution of the racial test score gap reflects the racial parenting gap. The latter can, in turn, be explained by the fact that, during this period, the social structure of black families has gone through important changes while it has remained roughly the same for white families.
2 Data and descriptive statistics
Our empirical analysis is based on data from the National Child Development Study (NCDS). It is a longitudinal survey that follows all British persons who were born between the 3rd and 9th of March 1958, with follow-up surveys in 1965 at age 7 (NCDS sweep one), in 1969 at age 11 (NCDS sweep two), in 1974 at age 16 (NCDS sweep three), in 1981 at age 23 (NCDS sweep four), and in 1991 at age 33 (NCDS sweep five). For the purpose of this paper, we obviously exploit only the first three waves, which report children test scores at school and parents’ involvement during these years. This dataset contains detailed parental and child information, as well as data on family background, home environment and school quality. It also reports area of residence identifiers for cohort’s members residential addresses in 1974 (NCDS sweep three), which allows us to match NCDS data with the 1971 Census data, obtaining a detailed picture of the residential neighborhood community when cohort’s members were teenagers (age 13). We distinguish between white and black children, and we consider Black Africans only (hereafter blacks).8 Excluding individuals with missing or incomplete information on our target variables we are left with 2,848 individuals followed from 7 to 16 years old. Blacks are roughly the 15 percent of the total population in ourfinal sample (2,487 whites and 361 blacks).
7Indeed, Fryer and Levitt (2004) explore the sources of the racial differences in academic performance in the US for the first two years of school. They show that among entering kindergartners, the black-white gap in test scores can be essentially explained by racial groups differences in observable characteristics of the children and their environment. However, the gap between white and black children grows over thefirst years of school, even conditional on observable factors. The hypothesis that seems to receive more empirical support is that black students attend lower quality schools.
8Children with Black Africans and Black Caribbeans background have very different education trajectories. We consider only Black Africans to obtain cultural homogeneity. Small sample sizes on the other nonwhite ethnic groups prevent us to consider other interracial differences in test scores. Non-Whites, non-Black Africans children are excluded from our sample.
As with most longitudinal surveys, attrition and incomplete information is an issue in the NCDS. Clearly, this might be problematic in our analysis given that a differential attrition might be responsible of the evolution of the racial gap across the school years. For instance, a greater attrition among low-SES families might account for some of the shrinking of the gap between ages 11 and 16, which wefind in our analysis. We gain confidence on the validity of our data as follows.
Firstly, at the expenses of sample sizes, we consider only the cohort’s members that are in- terviewed in all the three waves. Although the NCDS does not oversample ethnic minorities and sample sizes are not large initially, the 92% of the black cohort’s members remains in all the three waves. Regarding the white population, we lose almost 25% of our observations from the first to the third wave. However, comparing descriptive statistics of the whole sample and our selected one, it does not appear that we lose representativeness.
Secondly, we compare our sample descriptive statistics with the ones obtained by Wilson et al.
(2005) in their study on the school attainments of England’s ethnic minorities. They use a universe dataset of state school students in England (accounting for around 93% of all pupils). As it will be shown below, we find the same qualitative results on the level and evolution of the black-white gap across the school years. In particular, they alsofind a trend reversal of the racial gap between ages 11 and 16, which is the most striking feature of our analysis. They then investigate the roles of poverty, language, school quality and teacher influence, finding that none of these factors fully explains the empirical evidence. Their conclusions point to the fact that other forces like ethnic differences in aspirations and attitudes, of which they have no measure, should be at work. The present paper aims precisely at uncovering the importance of these factors in shaping the racial gap. In doing so, we use a more detailed (although smaller in sample size) dataset.
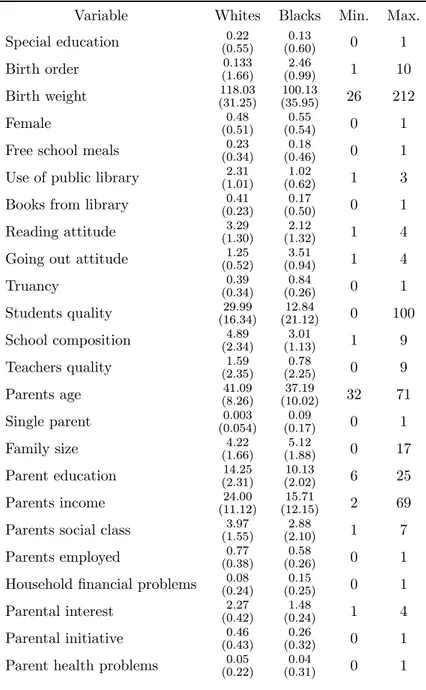
Table 1 reports our sample descriptive statistics. Interestingly, it appears that the average black pupil never goes to a public library, hardly ever reads in his/her spare time and, on the contrary, he/she seems to go out in the evening more than 3, 4 times a week. In contrast, the average white pupil at least sometimes goes to a public library, reads quite often in his/her spare time and scarcely goes out in the evening. In addition, less than 20% of blacks appears to borrow books from the library while this percentage more than doubles for white pupils.
[Insert T able1 here]
Racial gap in test scores
Table 2 reports the raw information on black and white students’ academic performance in the different waves. The values of the individual test scores have been normalized to have zero mean and a standard deviation of one for the overall sample on each of the tests (mathematics and reading) and time periods. This implies that these standardized scores are now comparable
across time. At age 7, white students score on average 0.03 standard deviations above the mean on the math exam, whereas black students perform 0.23 standard deviations below the mean on that test, yielding a black-white gap of 0.26 standard deviations. This gap increases to 0.41 standard deviations at age 11 and it goes back to 0.31 at age 16. Looking at the figures on the reading test scores, it appears that the initial black-white gap is smaller (0.21 standard deviations) but it shows a bigger increase than the one in arithmetic test scores at age 11 (0.55 standard deviations), reducing then substantially at age 16 (0.28 standard deviations). Figure 1a shows this evidence graphically. Specifically, it depicts the mean standardized test scores (both in mathematics and reading, for both races) by age. It appears clearly their common nonlinear (first decreasing and then increasing) pattern over time.
[Insert T able2 and F igure1a here]
Racial gap in parental interest and student’s motivation
We measure parental involvement in child’s education using two alternative proxies.9 Our first proxy exploits the qualitative information on parental interest in the child’s education provided by the NCDS data. In particular, the school questionnaire of different NCDS sweeps (1965, 1969, 1974) contains the following question to the teacher or headmaster: “With regard to the child’s educational progress, do the mother/father appear: over concerned about the child’s progress and/or expecting too high a standard? (coded as 4) Very interested? (coded as 3) To show some interest? (coded as 2) To show little or no interest? (coded as 1)”, and it is stated to ring the appropriate definition (only one for each parent). We rank the parents according to the highest level of involvement reported in each couple.10 Our second proxy is instead based on the available information on parental initiative to discuss the child’s educational progress with a school staff member. In particular, the school questionnaire of different NCDS sweeps (1965, 1969, 1974) contains the following question: “Since September, have the parents taken the initiative to discuss the child, even briefly, with you (headmaster) or any member of your teaching staff?” We use a dummy variable taking value of one if at least one parent took such initiative.
Table 3 (top panel) collects some suggestive evidence about racial cultural differences in par- enting using these two measures.
[Insert T able3 here]
9Various indicators of parental involvement are available in the NCDS. However, most of them (e.g. how often parents read to child) are not reported in all sweeps. We consider the information on parental effort in child’s education that is available for all three points in time (1965, 1969, 1974). However, the qualitativefindings of our analysis remain valid when using other measures.
1 0Non-response is not an issue here. Missing values are reported in less than 5 % of the observations.
Firstly, it documents that black and white parents show a different interest in their children’s education. Indeed, regardless on the way parental involvement is measured and at which age of the child it is calculated, more than 75 percent of white children have parents who are highly interested in their education whereas this percentage is never higher than 35 percent for black children. Secondly, it reveals that while white’s parental interest in children’s education remains roughly constant over the school years (the differences in means are never statistically significant), black parents show a different level of interest at different children ages (the differences in means are always statistically significant).11 Figure 1b plots these values. Specifically, it depicts parental interest (using both proxies, for both races) by age. It appears in particular a marked nonlinear (first decreasing and then increasing) pattern over time of blacks’ parental interest.12
[Insert F igure 1b here]
Interestingly, the racial difference in parental interest over the school years seems to follow the evolution of the racial test score gap. This evidence is clearly shown in Figure 1c, which plots the racial gap in test scores (average between arithmetic and reading results) and parental interest (average level between the two proxies) by age. It is striking to observe the similarity in shape of the two curves.13
[Insert F igure 1c here]
Because one may argue that black parents do not prioritize education just because they are not educated themselves, Table 3 also reports the inter-race differences in parental interest for high- and low-educated parents. All variables on parental involvement in children’s education have a (statistically significant) lower mean value for children of low-educated parents than that of high-educated ones. However, it is striking to see that there are still large (statistically different) inter-race differences, even after controlling for parental education. This suggests that the different priorities given to education by black and white parents can in fact be related to cultural differences.
Jencks and Phillips (1998) also found that, while substantial socioeconomic differences between minority and white families in the US are a key factor in achievement differentials, the gap between
1 1See also Table 7.
1 2The use of the average values of parental interest as measured by ourfirst proxy coded 1 to 4 leaves the graphs qualitatively unchanged.
1 3Clearly, the school performance and parental interest racial gaps are not comparable in absolute values at each age, as they are measured in different units (standard deviations and percentage points, respectively). We look here at the changes in the gaps over time (shapes of the curves).
minority and white students is present or even greater among middle-income than low-income families, suggesting that contributing factors other than income may involve parenting practices.
Let us turn our attention to the lower panel of Table 3. In order to further document cultural differences between races, we report some evidence on differences in attitude towards education between black and white students. We find that they display different degrees of motivation in education. Indeed, almost 35 percent of black students consider school as largely a waste of time and more than 60 percent confess to have played truant in the school year. Thesefigures contrast with the corresponding 10 and 30 percent for white students. Using an index of academic motivation based on the students’ answers to a set of questions on attitudes towards education, we find that the average white pupil is almost twice as motivated as a black one. Also, when pupils are asked if they would like to go on with full time education (e.g., to go to college) after school or if they would rather look for a job (answer to question 10 in Table 3), almost half of the blacks declare to prefer finding a job whereas less than 20 percent of whites show a similar preference. In addition, children are subsequently asked at what age they are likely to leave school. Wefind that, although expectations seems to matter, these inter-race differences are qualitatively maintained, regardless of the students’ actual possibilities on education attainment. Indeed, Table 3 also reports the descriptive statistics controlling for the students’ expectations about their education achievement.
Specifically, we consider the percentages of students who would like to go on in full-time education after school (to go to college or university) splitting the sample between those who think that they are very likely to leave full-time education after 18 years old or over (i.e., those who actually have the possibility to go to college or university) and the others. By doing so, we attempt to rule out the possibility that inter-race differences in motivation are only the consequence of inter-race differences in income and family background, providing stronger evidence that cultural differences do in fact matter. Thefigures reveal that, within race, students expecting to go to college put more effort in schooling and manifest higher desire to actually go to college, but between races, we still find that whites seem to be more motivated students than blacks, for the same level of education achievement probability.
Taken as a whole, these evidence, not surprisingly, point to the fact that blacks and whites value academic achievement differently and that there might be an important association between black-white cultural differences and the racial gap in school performance. In the next section we investigate further this suggestive evidence.
3 Estimation results
Do racial differences in rearing children really matter in explaining the interracial school achieve- ment gap? And, to what extent their impact (if any) is also responsible for the evolution of the racial gap over the school years? In order to answer to these two questions, we proceed as follows.
Section 3.1 investigates the sources of the racial test scores gap at age 7, 11 and 16 separately.
Section 3.2 then presents the same analysis when differences in the gap (between age 7 and 11 and between 11 and 16) are considered. In both analyses (in levels and differences), we use the Oaxaca decomposition to assess the portion of the gap that it is explained by different observable characteristics across races and the part which is left unexplained. In particular, we will focus our attention on the assessment of the contribution of parental involvement. Finally, in section 3.3, we will perform different robustness checks.
3.1 Understanding racial school performance differences at each age
We start by performing a standard analysis of the racial test score gap, i.e. the estimation of a regression model where individual test scores are expressed as a function of a set of regressors, using alternative (increasing) sets, at different points in time.14 Because different covariates show a different impact for blacks and whites,15 we perform the analysis separately for blacks and whites (instead of including a race dummy among the regressors to capture the estimated racial gap).
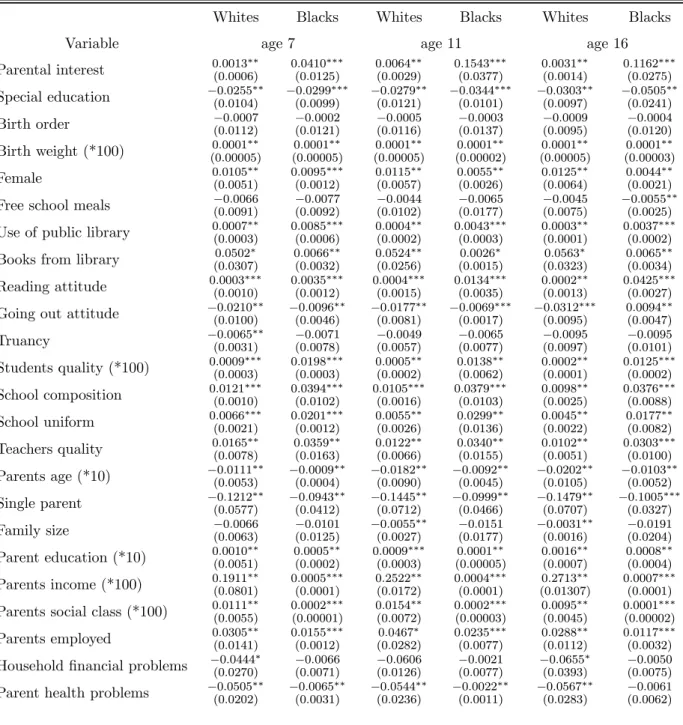
Table A1 shows the complete list of estimation results for the model specification, which in- cludes the more extensive set of covariates when using test scores in mathematics as dependent variable and our first proxy for parental involvement in education.16 Observe that the variables associated with a statistical significant estimated coefficients are roughly the same for both races.
This means that differences in education among blacks are driven by the same factors that drive differences among whites, thus suggesting that the black and white education production functions are not substantially different. However, the responsiveness to the different factors varies across races. For instance, in Table A1, it can be seen that black children are less responsive (in terms of standard deviations) to changes in variables related to the family socio-economic status (e.g.,
1 4Different variations of the test score production function (Todd and Wolpin, 2003 and 2004; Hansen et al., 2004) have also been used. The main results remain qualitatively unchanged.
1 5Conventional statistical tests reject always the use of cross-equation restrictions with our data. Neglecting this issue might lead to a biased estimation of the racial gap, which will be overstated (or understated) depending on whether the effect of a regressor is higher (or lower) for blacks in respect of whites.
1 6The corresponding results for reading test scores and using our second proxy for parental interest (complete list of controls for blacks and whites in the different years) are available upon request. Table 4 however contains the estimation results on our target variable (both proxies), i.e. parental involvement, from these regressions.
parental education, income, social class). This may indicate difficulties at home (e.g., domestic ten- sion, parental health problems, household financial problems). On the other hand, they are more responsive to changes in variables capturing the quality of school and residential neighborhood (e.g., students and teachers quality, school composition and type, percentage of neighborhood high skill population and local unemployment rate) than whites. Interestingly, non-standard controls such as reading attitude or the use of public library show a significant impact. For instance, a one standard deviation increase in the frequency a child reads in the spare time leads to an increase of 0.0091, 0.0095, 0.0093 for whites and of 0.0102, 0.0299, 0.0154 of a standard deviation in mathematics test scores for blacks at ages 7, 11 and 16 respectively (the impact on reading test scores is (slightly) higher).
Table 4 collects the estimation results for our target variable, i.e. parental investment in their children education, by race and age, using our two alterative proxies (i.e., parental interest and parental initiative). Because our qualitative results appear to be robust with respect to the chosen proxy (i.e. they remain qualitatively the same when using our two alternative proxies),17 we will present our evidence using the results obtained adopting thefirst proxy only, i.e. parental interest.
[Insert T able4 here]
The estimated coefficient of parental interest is statistically significant for all ages both for blacks and whites and for both disciplines, indicating that parental interest has a non negligible effect in shaping children’s school performance. Looking at Table 4 in more details, wefind that, for whites, the impact of parental interest remains roughly constant across the school years. Indeed, a one standard deviation increase in parental interest raises test scores in mathematics by 0.0136, 0.0291 and 0.0181 of a standard deviation at age 7, 11 and 16, respectively. For reading test scores, the correspondingfigures are respectively 0.0273, 0.0328, and 0.0254.
For blacks, the impact of parental interest is higher than for whites at every age, for both test scores and, more interestingly, its relative magnitude varies largely across ages. A one standard deviation increase in parental interest at age 7 raises test scores in mathematics by 0.0201 standard deviations, while this effect is equal to 0.0651 at age 11 and 0.0421 at age 16. For reading test scores, these values are higher and their pattern is even more pronounced across ages. They are equal to 0.0450, 0.1504 and 0.1005, at age 7, 11 and 16, respectively.
T-tests between those estimated race-specific coefficients reject the null hypothesis of equal effect at every age. This provides a formal test for racial differences in the importance of parental interest on children’s education.
1 7The estimated effects are only slightly smaller in magnitude when using our second proxy of parental involvement.
We do not report all the estimation results for all the controls of our experiments obtained using different model specifications when gradually increasing the number of regressors.18 The interesting result is, that although we use an impressive amount of information on individuals’ socio-economic status, school and neighborhood quality, we are not able to completely explain the racial gap on the basis of racial differences using traditional observable variables. However, as soon as we include in the model specification covariates that can be considered as proxies for a broad set of environmental and behavioral factors, such as indicators of reading attitudes or parental effort in investing in their children education, the unexplained portion of the racial gap shrinks substantially.
We illustrate this evidence by using the standard Oaxaca technique (Oaxaca, 1973) of decom- posing any difference in a dependent variable between two groups into the part that is explained by different observable characteristics across groups (i.e., population’s differences in observed vari- ables), and the proportion that is due to the same characteristics having a different effect between the two groups (such as unobserved cultural differences).19
In particular, taking the average test score of black and white students at ages 7, 11 and 16 (t= 7,11,16), the difference in the black-white gap (for each age separately) can be expressed as:
SWt −SBt = (XWt −XBt )βbBt +XWt (bβWt −βbBt), t= 7, 11, 16 (1) whereSW
³ SB
´
is the average schooling performance of whites (blacks) at aget,XW
³ XB
´
is a row vector of average values for the observable characteristics of whites (blacks) at aget, andβbW³
βbB´ is the vector of coefficient estimates for whites (blacks) at age t from a regression analysis run separately for each group (from Table A1). Thefirst term in the decomposition represents the part of the black-white school performance gap that is due to intergroup differences in average values of the observables while the second term corresponds to the portion of the gap that is “unexplained”, i.e. which is due to differences in the estimated coefficients between the two groups.
Table 5 presents the results of this decomposition. We focus our attention on the main message of this paper, which is in the finding of a possible important role played by interracial parental interest differences in explaining the racial test score gap.
[Insert T able5 here]
Table 5a reports the percentages of racial gap explained by observable variables (first term in equation (1)) and the one due to unobservable factors (second term in equation (1)) at the
1 8The complete list of estimation results for each age and for all the different sets of controls both for blacks and whites are available upon request. The signs of the estimated coefficients of all the covariates remain unchanged across model specifications.
1 9Note that this part may also include the effects of omitted variables.
different ages when the model specification includes the more extensive set of controls (see Table A1), with the exclusion of parental interest. Table 5b then displays the added contribution (in terms of percentage of explained gap) stemming from the inclusion of parental interest among the explanatory variables.
Table 5a shows a substantial proportion of the gap left unexplained (i.e., due to unobservable factors) at every point in time, which is sharply increasing between ages 7 and 11 and then de- creasing between ages 11 and 16, both for mathematics and reading scores. Indeed, looking at the reading test scores of 7 years-old children, it appears that 72.5 percent of the racial difference in school performance can be attributed to differences in observed characteristics between races.
However, when children are 11 years old, this proportion sharply decreases to 58.2 percent and then raises to 63.1 percent at age 16.
To what extent can the unexplained portion of the gap be attributed to racial differences in parental interest (which were not included in the model specification used in Table 5a, thus resulting as unobservable factors)? Table 5b reveals an important effect of parental interest in explaining the racial test score gap at every age, which in fact is first increasing and then decreasing with children’s age. The inclusion of parental interest among the covariates eliminates the (inverted) U-shape pattern of the residual test score gap. In other words, accounting for racial differences in parental involvement in education decreases the unexplained proportion of the racial gap in test scores at every age and this reduction is more marked at age 11, i.e. when racial differences in parental interest are more pronounced (see Table 3). Thus, racial differences in parental interest (cultural differences) seem to contribute to explain the extent of the gap at different ages.
Table 5 also shows that the importance of parental interest in explaining the racial test score gap is larger for reading than arithmetic tests (see also Table 4). This is not unreasonable, given that math skills might be strongly related to ability and genetic characteristics whereas children reading performance are more likely to be the result of living habits, role models and parental investment in their children education.
Clearly, parental interest can proxy for a broad set of environmental and behavioral factors. Our findings have to be interpreted as a suggestive evidence that racial differences in behavioral factors, which are usually unobserved, might be the responsible of at least a part of the racial differences in academic performance. The extent of the effects might be large. Our estimation results show that, for instance, if black parents would invest in education of their 11 year-old children as much as white parents do, then the racial test score gap in reading and mathematics would be reduced by 19.5 and 11.3 percent, respectively.
3.2 Understanding racial school performance differences across ages
Having assessed the importance of parenting practice in explaining the racial gap at different school years, we now investigate their relevance in explaining its evolution over time. Instead of considering separate cross sections in the different years, we now exploit the panel structure of our dataset and follow each student over time. Specifically, we measure a pupil’s progress through the tests following the UK Department for Education and Skills value-added approach It consists of taking all pupils who achieved a particular grade at a given stage, and then compute the average score for that group at the following stage. An individual pupil’s value added from a first to a second stage is then the difference between his/her own grade at the second stage and the average for his/her group. This implies that each student will achieve positive value-added if he/she is more able or has more positive factors than others who scored the same mark at the previous stage. We can thus consider the differences in value-added rates between blacks and whites between age 7 and 11, and between age 11 and 16.
Table 6 shows summary statistics on these raw data. It can be seen that, on average, white stu- dents tend to increase their performance across years (showing a positive value added), while black students on average seem to loose in academic performance over time. However, when considering the (average) relative performance between races, it appears that the racial gap is decreasing over time. Indeed, the racial gap in average value added decreases from 0.028 to 0.016 for mathematics test scores and from 0.033 to 0.012 for reading test scores (see also Table 9).
[Insert T able6 here]
Let us now analyze in more details the difference in parental involvement across ages by race.
We take differences between ages 11 and 7 and between ages 16 and 11 from Table 3 within each race and we then explicitly calculate the racial gap of these differences. The results are reported in Table 7. It appears that changes in parental involvement are much more pronounced for blacks than for whites, regardless of the proxy used. Black parents’ (average) investment in their children education shows a noticeable change between age 7 and 11 (a decrease of 0.12 and 0.06 for the different proxies), which is even more pronounced between age 11 and 16 (an increase of 0.22 and 0.14 for the different proxies). These changes cannot be compared in magnitude with the changes in white parents’ involvement (+0.01 and −0.03 between age 7 and 11 and +0.01 and +0.09 for each proxy, respectively). Looking at the racial gap (last rows), it appears that the extent of the racial differences in parental involvement is larger between ages 11 and 16.
[Insert T able7 here]
Table 8 collects the estimation results for our target variable, i.e. (differences in) parental investment in their children education, by race and across ages, using our two alterative proxies (i.e., parental interest and parental initiative). These results correspond to those listed in Table 5, i.e. they are the results of a OLS regression run on the same model specification with a different dependent variable (a pupil’s value-added across consecutive waves instead of the pupil’s test scores in levels in each wave) and using differences of the covariates instead of levels.20 As before, our results remain qualitatively the same when using our two alternative proxies. Thus, we continue to present our evidence using the results obtained using thefirst proxy only.
[Insert T able8 here]
As in Table 4, the estimated coefficient of parental interest is statistically significant for all ages both for blacks and whites and for both disciplines, indicating that parental interest is not only important in determining children’s school performance at the different ages, but also in influencing its growth rate. Also, the impact of parental interest remains higher for blacks than for whites. Differently from Table 4, where the impact of white parents’ interest on their pupils’ school performance between ages 7 and 11 and between 11 and 16 were the same, here wefind a noticeable change of this effect across ages both for blacks and whites. Specifically, a one standard deviation increase in white (differences in) parental interest raises a pupil’s value added in mathematics by 0.0040 of a standard deviation between age 7 and 11, whereas this impact is roughly doubled (+0.0086) when it is calculated between ages 11 and 16. For reading test scores, these effects are 0.0068 and 0.0164 between ages 7-11 and 11-16, respectively. For blacks, we obtain +0.0055 and +0.0088, and +0.0101 and +0.0175 between ages 7-11 and 11-16 for mathematics and reading test scores, respectively.21 In summary, tables 4 and 8 indicate that parental involvement is important in shaping both the level and the progress of a pupil’s school performance over the school years.
For whites, however, its effect on the level of the child’s school performance is the same regardless of the age at which it is measured, while the effect on the changes in the child’s school performance is more pronounced in shaping the differentials in education attainment between ages 11 and 16.
As before (equation (1)), taking the average value added of black and white students between ages 7 and 11 (t = 1) and between 11 and 16 (t = 2), we use the Oaxaca decomposition of the
2 0The complete list of estimation results for the model specification which includes the more extensive set of covariates (i.e. the table corresponding to Table A1) is available upon request. The results are mostly qualitatively unchanged, suggesting that pupils’ school attainment at each age and its change across ages are influenced by the same factors in the same directions.
2 1Similarly to our analysis in levels (Table 5) also in this case t-tests on the contrasts between those estimated race-specific coefficients have been performed. They reject always the null hypothesis of equal effect.
difference in the black-white gap:
∆SWt −∆SBt = (∆XWt −∆XBt )bβBt +∆XWt (bβWt −bβBt ), t= 1,2.
where the same notations as in model (1) apply. This approach allows us to investigate the im- portance of racial differences in different variables in determining the evolution of the racial test score gap over time. Table 9 has the same structure as Table 6. It points to the following evi- dence. Although there is a much higher proportion of the gap that is not explained by observables, parental interest remains an important factor in shaping such a difference, especially between ages 11 and 16. One can see that an additional 5.6 (6.2) percent of the difference in racial gap test score in arithmetic (resp. in reading) between ages 7 and 11 can be explained by parental interest differences while this amount raises to 9.3 (resp. 9.7) percent between ages 11 and 16. Indeed, between ages 11 to 16, cultural differences between blacks and whites in parenting and attitude towards education are the strongest (see Tables 7 and 3).22
[Insert T able9 here]
3.3 Robustness checks
The uncovered link between test score gap and parental interest in education might be affected by endogeneity issues as parental involvement may be related to the pupil’s school performance itself. As it is standard, we address this problem by adopting an instrumental variable approach.
We perform two exercises, which are based on two different types of instruments. Firstly, we use the lagged value of parental interest to instrument the contemporaneous variable. In the parental questionnaire of the NCDS sweep one (age 7 in 1965), i.e. when the child has just started school and has not yet been “educated”, it is asked: “Does the mother/father read to, or read with, the child?”, and the possible answers suggested are “Yes, at least every week; Yes occasionally; Never or hardly never; Don’t know or inapplicable”. We exclude the mothers and fathers who answer
“Don’t know or inapplicable” and we rank the parents according to the highest frequency declared by each couple. We thus instrument parental involvement in the children education at the different school years with the frequency they read to their child when the child is of age 7. This strategy should mitigate the concern that our indicator of parental interest in a child’s education is driven by the child’s schooling performance.
2 2The analysis presented in this section has also been performed relating t to t+1 changes in test scores with time t parental involvement (instead of with t to t+1 changes in parental involvement). Also this alternative specification of the nature of the relationship between parental investments and children’s achievement confirms the crucial role of black-white differences in parental attitudes towards education.
Our alternative instrumental variable approach instead uses the information contained in the NCDS on the mothers’ behavior in the antenatal period to find instruments for parental interest.
We consider two indicators of the mother’s behavior during pregnancy, namely whether the mother who declares being a smoker prior to pregnancy quits smoking after four months of pregnancy and the mother’s total number of antenatal doctor visits (without abnormality during pregnancy). To be valid instruments, those variables should be correlated with parental interest but uncorrelated with the child’s future educational achievement.
Table 10 reports the correlations of these variables with our indicators of parental effort in the child’s education, with other parental background variables and with the child’s school performance for whites and blacks separately. It reveals that, for both races, irrespective of the way child’s school performance is measured (i.e. with maths or reading test scores), both variables have no direct effect on the child’s education, while being (positively) significantly correlated with our measures of parental effort. Interestingly, in our case, these indicators of the mother’s behavior during pregnancy do not appear to be significantly correlated with other parental background variables.
Therefore these variables seem to be suitable instruments: they are predictors of parental care that do not affect directly the child’s school performance (other than through their effect on parental interest in the child’s education). Indeed, likelihood ratio tests do not reject the null hypothesis that the instruments either individually or jointly do not have a direct impact on the child’s education attainment. Furthermore, these instruments also avoid the possibility of reverse causality, as the mother’s attitude towards pregnancy in the antenatal period is not determined by the child’s future education attainment. When those IV estimators are adopted in our analysis the estimation results remain qualitatively unchanged.23 They are only reduced in magnitude.
[Insert T able10 here]
4 What explain parenting differences over time?
One of the mainfindings of this paper is that the evolution of educational racial gaps reflects the evolution of parental investment gaps. However, we need to answer why the educational racial-gap has increased for kids between 7 and 11 years old and then decreased between 11 and 16 years old.
In other words, are they specific factors responsible for the different dynamics of parenting across races?
For the United States, Neal (2006) argues that the fact that test scores among black children lag well behind scores among white children at early ages is consistent with the idea that families make
2 3The complete lists of results are available upon request.
different investment in the education of their children in early ages, and that the structure of the family and thefinancial resources available to children are the key determinants of this gap. Using data from the Census, in 2000, Neal (2006) shows that only one third of black pre-school children lived with two parents, and just over one in ten lived with neither of their parents. For whites,
the figures are eighty and three percent, respectively. Black family structures differ from white
family structures but the rate of decline in two-parent households since 1960 has been much more dramatic in the black community. Furthermore, in the 1980s, never-married motherhood became quite common among black families, thus reducing the financial capacities of these families.24 Neal (2004) shows that, between 1980 and 1990, the prevalence of never-married motherhood among black women with no postsecondary schooling increased quite dramatically. To summarize, the argument of Neal (2006) is that both the relative change in the family structure and the impoverishment of black families can explain why the educational gap between black and white kids has stopped to converge in the last decade.
We would like to use the same type of argument to explain the non-linear pattern over time of the racial gap in Britain. The richness of information in the NCDS on socio-economic and behavioral characteristics of children and families allows us to investigate this issue. Table 11 documents the different evolutions of the structure of households and of other sociological characteristics for whites and blacks up to the children’s age of 16 years old. While the (average) white family structure (both in terms of the number of children, the percentage of lone parents, etc.) remains roughly stable over the period considered, the social structure of black families varies considerably over the school years. In particular, when a child is between 7 and 11, the number of children in the household doubles, and by the age of 16 almost 50% of black children live in a family maintained by a separated, divorced, widowed, or never-married parent.
[Insert T able11 here]
Those patterns can be associated with the non-linear trend of parenting across races. Family size has clear connections. Because the cost of spending time educating a child is higher when there are other children in the family, one might argue that the decrease in parental interest for blacks at age 7-11 can be associated with the increase in family size that occurs during these years. Also, during this period, domestic tensions, alcoholism and health problems increase in the typical black family. Furthermore, between ages 7-11 and 11-16, the percentage of lone families has doubled while domestic tension, alcoholism and health problems have been sharply reduced.25 This may indicate
2 4Never-married mothers may receive much lessfinancial support than divorced mothers in the US.
2 5Observe that the percentages of families affected by these difficulties are almost always more than double for blacks than for whites.
that these problems are in some sense “solved” by a divorce, so that the remaining parent (typically the mother) devotes more effort and time in the education of her children. Our explanation of the reduced racial gap in test scores is thus that parental interest in black families increases between age 7-11 and 11-16 because the structure of the family has changed while it remains roughly the same for white families during the same period. Therefore, the dynamics of parenting across races over the school years seem to reflect the changes in the social structure of the family, which are more marked for blacks than for whites over this period.
References
[1] Alesina, A. and E. La Ferrara (2005), “Ethnic Diversity and Economic Performance,”Journal of Economic Literature 43, 762-800.
[2] Bisin, A., Patacchini, E., Verdier T. and Y. Zenou (2006), “‘Bend It Like Beckham’: Identity, Socialization, and Assimilation”, CEPR Discussion Paper No. 5662.
[3] Bradley, S. and J. Taylor (2004), “Ethnicity, educational attainment and the transition from school,”The Manchester School 72, 317-346.
[4] Brooks-Gunn, J., P. Klebanov and G. Duncan (1996), “Ethnic differences in children’s intelli- gence test scores: Role of economic deprivation, home environment, and maternal character- istics,”Child Development 65, 346—360.
[5] Carneiro, P. and J.J. Heckman (2003), “Human capital policy,” inInequality in America. What Role for Human Capital Policies?, J.J. Heckman and A.B. Krueger (Eds.), Cambridge (MA.):
MIT Press, pp. 77-239.
[6] Cook, M.D. and W.N. Evans (2000), “Families or schools? Explaining the convergence in White and Black academic performance,”Journal of Labor Economics 18, 729-754.
[7] Ferguson, R. (1998), “Can schools narrow the Black-White test score gap? inThe Black-White Test Score Gap, C. Jencks and M. Phillips (Eds.), Washington (D.C.): Bookings Institution, pp. 318-314.
[8] Fryer, R.G. and S.D. Levitt (2004), “Understanding the black-white test score gap in thefirst two years of school,”Review of Economics and Statistics 86, 447-464.
[9] Gillborn, D. and S. Mirza (2000), “Educational inequality: Mapping race, class and gender:
[10] Hansen, K., Heckman J.J., and K.J. Mullen (2004), “The effect of schooling and ability on achievement test scores,”Journal of Econometrics 121, 39-98.
[11] Jencks, C. and M. Phillips (1998), The Black-White Test Score Gap, Washington (D.C.):
Brookings Institution.
[12] Modood, T. (2005), “The educational attainments of ethnic minorities in Britain,” inEthnicity, Social Mobility and Public Policy, G.C. Loury, T. Modood and S.M. Seles (Eds.), Cambridge:
Cambridge University Press.
[13] Neal, D. (2004), “The relationship between marriage market prospects and never-married motherhood,”Journal of Human Resources 39, 938-957.
[14] Neal, D. (2006), “Why has black-white skill convergence stopped?” inHandbook of Economics of Education, E. Hanushek and F. Welch (Eds.), Amsterdam: Elsevier, pp. 511-576.
[15] Oaxaca, R. (1973), “Male-female wage differential in urban labor markets,” International Economic Review 14, 693-709.
[16] Phillips, M., Brooks-Gunn, J., Duncan, G., P. Klebanov and J. Crane (1998), “Family back- ground, parenting practices, and the black-white test score gap,” in The Black-White Test Score Gap, C. Jencks and M. Phillips (Eds.), Washington (D.C.): Bookings Institution, pp.
103-145.
[17] Todd, P.E. and K.I Wolpin (2003), “On the specification and estimation of the production function for cognitive achievement,”Economic Journal 113, F3-F33.
[18] Todd, P.E. and K.I Wolpin (2004), “The production of cognitive achievement in children:
Home, school, and racial test score gaps,” PIER Working Paper No. 04-019.
[19] Wilson, D., Burgess, S. and A. Briggs (2005), “The dynamics of school attainment of England’s ethnic minorities,” CMPO Working Paper No. 05/130, University of Bristol.
Appendix 1: Description of control variables
26Cohort’s member characteristics
special education: dummy variable taking value one if the child has been ascertained as in need of special education (speech defect, physically handicapped, partially sighted or hearing, delicate, etc...). Source: NCDS1
birth order: child’s position in birth order (with respect to brothers and sisters). Source: NCDS2 birth weight: weight of baby in ounces at birth. Source: NCDS1 (Perinatal Mortality survey) female: dummy variable taking value one if the child is female. Source: NCDS1
free school meals: dummy variable taking value one if the child receives free school meals.
Source: NCDS2
use of public library: variable taking value of 1 if the child never goes to a public library in the last twelve months, 2 if he/she goes sometimes and 3 if he/she goes often. Source: NCDS2
books from library: dummy variable taking value one if the pupil borrows books from library.
Source: NCDS2
reading attitude: answer to the question: "how often child reads in the spare time", coded as 1=no chance, 2=hardly ever, 3= sometimes, 4=often. Source: NCDS3.
going out attitute: answer to the question: "how often child goes out in evening", coded as 1=never or rarely, 2=1,2 times a week, 3= 3,4 times a week, 4=5 or more times a week. Source:
NCDS3.
truancy: dummy variable taking value one if the child has played truancy in the last school year. Source: NCDS3
School characteristics
students quality: proportion of boys or girls studying for GCE and SCE O-levels27in the school.
Source: NCDS3
school composition: percentage of children with non-manual fathers in the school (9 bands, 8 dummies). Source: NCDS3
teachers quality: number of teachers with more than 6 whole years of experience. Source:
NCDS2
2 6The main NCDS sweep data source is reported. In order to maintain sample sizes, this information is often complemented with data coming from earlier or later sweeps to replace missing data. A parent is the mother or the father or a person acting as mother or father respectively.
2 7GCE (General Certificate of Education) and SCE (Scottish Certificate of Education) O-levels (Ordinary levels) were taken at age 16 mainly by pupils in grammar schools and independent schools - nationally the top 20% of the population by ability.
Family background
parents age: (average of) parents’ age in 1974. Source: NCDS1
single parent: dummy variable taking value one if there is no regular fatherfigure or there is no natural mother. Source: NCDS2
family size: number of people in household. Source: NCDS3
parents income: weekly net wage of father or mother if no father (or person acting as that parent), 12 bands, mid-points of each range considered. Source: NCDS3
parent education: parent’s completed years of schooling (derived from age left full-time educa- tion). Source: NCDS3
parents employed: dummy variable taking value one if both parents are working. Source:
NCDS3
parents social class: social class of father or mother if no father (or person acting as that parent): professional, intermediate status, skilled non-manual, skilled manual, semi-skilled manual, semi-skilled non-manual, unskilled (7 classes, 6 dummies). Source: NCDS2
household financial problems: dummy variable taking value one if the family experiencedfinan- cial difficulties. Source: NCDS2
parent health problems: dummy variable taking value one if at least one parent suffered from chronic or serious disability or ill-health, including any hospital in patient admission of 2 weeks or longer. Source: NCDS2
council house: dummy variable taking value one if the family lived in council provided accom- modation. Source: NCDS3
domestic tension: dummy variable taking value one if the family experienced domestic tension.
Source: NCDS1
parental English fluency: dummy variable taking value one if the quality of mother’s spoken English is poor (or none). Source: NCDS1
English spoken at home: dummy variable taking value one if English is the usual language spoken at home. Source: NCDS2
accomodation tenure: dummy variable taking value one if it is a owner occupied house. Source:
NCDS1
household persons per room: number of persons per room in the house, coded as 1=up to 1, 2=over 1 to 1,5, 3=over 1,5 to 2, 4=over 2. Source: NCDS2
Residential neighborhood characteristics (Census Ward level variables or otherwise spec- ified)
high skilled population: proportion of over-18s persons with A-levels (highest grade at age 16 exams) or above qualifications. Source: Census 1971
total population: total population present. Source: Census 1971
black population: black residents over total residents. Source: Census 1971
unemployment rate: unemployed over economically active population. Source: Census 1971 amenities: proportion of households lacking or sharing hot water and/or inside toilet and/or bath. Source: Census 1971
car access: proportion of households with no car. Source: Census 1971