Research Collection
Journal Article
Exposure to multiple pesticides and neurobehavioral outcomes among smallholder farmers in Uganda
Author(s):
Fuhrimann, Samuel; Farnham, Andrea; Staudacher, Philipp; Atuhaire, Aggrey; Manfioletti, Tiziana;
Niwagaba, Charles B.; Namirembe, Sarah; Mugweri, Jonathan; Winkler, Mirko S.; Portengen, Lutzen;
Kromhout, Hans; Mora, Ana M.
Publication Date:
2021-07
Permanent Link:
https://doi.org/10.3929/ethz-b-000476700
Originally published in:
Environment International 152, http://doi.org/10.1016/j.envint.2021.106477
Rights / License:
Creative Commons Attribution 4.0 International
This page was generated automatically upon download from the ETH Zurich Research Collection. For more
information please consult the Terms of use.
Environment International 152 (2021) 106477
Available online 20 March 2021
0160-4120/© 2021 The Authors. Published by Elsevier Ltd. This is an open access article under the CC BY license (http://creativecommons.org/licenses/by/4.0/).
Exposure to multiple pesticides and neurobehavioral outcomes among smallholder farmers in Uganda
Samuel Fuhrimann a , * , Andrea Farnham b , c , Philipp Staudacher d , e , Aggrey Atuhaire f , Tiziana Manfioletti b , c , Charles B. Niwagaba g , Sarah Namirembe f , Jonathan Mugweri f , Mirko S. Winkler b , c , Lutzen Portengen a , Hans Kromhout a , Ana M. Mora h , i
aInstitute for Risk Assessment Sciences (IRAS), Utrecht University, Utrecht, the Netherlands
bDepartment of Epidemiology and Public Health, Swiss Tropical and Public Health Institute (Swiss TPH), Basel, Switzerland
cUniversity of Basel, Basel, Switzerland
dSwiss Federal Institute of Aquatic Science and Technology (Eawag), Dübendorf, Switzerland
eInstitute of Biogeochemistry and Pollutant Dynamics (IBP), ETH Zürich, Zürich, Switzerland
fUganda National Association of Community and Occupational Health (UNACOH), Kampala, Uganda
gDepartment of Civil and Environmental Engineering, Makerere University, Kampala, Uganda
hCentral American Institute for Studies on Toxic Substances (IRET), Universidad Nacional, Heredia, Costa Rica
iCenter for Environmental Research and Children’s Health (CERCH), School of Public Health, University of California, Berkeley, CA, United States
A R T I C L E I N F O
Handling Editor: Lesa Aylward Keywords:
Pesticides Glyphosate
Neurobehavioral outcomes Multi-pollutant model Farmers
Bayesian model-averaging Uganda
A B S T R A C T
Background: Multiple epidemiological studies have shown that exposure to single pesticide active ingredients or
chemical groups is associated with adverse neurobehavioral outcomes in farmers. In agriculture, exposure to multiple pesticide active ingredients is the rule, rather than exception. Therefore, occupational studies on neurobehavioral effects of pesticides should account for potential co-exposure confounding.
Methods: We conducted a cross-sectional study of 288 Ugandan smallholder farmers between September and
December 2017. We collected data on self-reported use of pesticide products during the 12 months prior to survey and estimated yearly exposure-intensity scores for 14 pesticide active ingredients using a semi- quantitative exposure algorithm. We administered 11 neurobehavioral tests to assess five neurobehavioral do- mains. We implemented a Bayesian Model-Averaging (BMA) approach to examine the association between exposure to multiple pesticides and neurobehavioral outcomes, while accounting for multiple testing. We applied two levels of inference to determine (1) which neurobehavioral outcomes were associated with overall pesticide exposure (marginal inclusion probability (MIP) for covariate-only models
<0.5) and (2) which specific pesticide active ingredients were associated with these outcomes (MIP for models where active ingredient was included
>
0.5).
Results: Seventy-two percent of farmers reported use of pesticide products that contained at least one of 14 active
ingredients, while the applicators used in median three different active ingredients (interquartile range (IQR) 4) in the 12 months prior to the study. The most widely used active ingredients were glyphosate (79%), cyper- methrin (60%), and mancozeb (55%). We found that overall pesticide exposure was associated with impaired visual memory (Benton Visual Retention Test (BVRT)), language (semantic verbal fluency test), perceptual-motor function (Finger tapping test), and complex attention problems (Trail making A test and digit symbol test).
However, when we looked at the associations for individual active ingredients, we only observed a positive association between glyphosate exposure and impaired visual memory (-0.103 [95% Bayesian Credible Interval (BCI)] [-0.24, 0] units in BVRT scores per interquartile range (IQR) increase in annual exposure to glyphosate, relative to a median [IQR] of 6 [3] units in BVRT across the entire study population).
Conclusions:
We found that overall pesticide exposure was associated with several neurobehavioral outcome variables. However, when we examined individual pesticide active ingredients, we observed predominantly null associations, except for a positive association between glyphosate exposure and impaired visual memory.
* Corresponding author.
E-mail address: s.fuhrimann@uu.nl (S. Fuhrimann).
Contents lists available at ScienceDirect
Environment International
journal homepage: www.elsevier.com/locate/envint
https://doi.org/10.1016/j.envint.2021.106477
Received 8 October 2020; Received in revised form 5 February 2021; Accepted 17 February 2021
Additional epidemiologic studies are needed to evaluate glyphosate
’s neurotoxicity, while accounting for co- pollutant confounding.
1. Introduction
In low- and middle-income countries (LMICs), the increase in agri- cultural production (OECD and FAO, 2018) has been coupled with extensive use of highly toxic pesticide active ingredients (Jepson et al., 2020; Fuhrimann et al., 2020), non-use of or inadequate use of personal protection equipment (PPE) (Fuhrimann et al., 2020; Negatu et al., 2016), and a lack of pesticide use regulations or implementation thereof (Fuhrimann et al., 2020; Jepson et al., 2014; Schreinemachers et al., 2017). Multiple studies have shown that occupational exposure to spe- cific pesticide active ingredients or chemical groups is associated with impaired neurobehavioral outcomes (Ismail et al. 2012; Meyer-Baron et al. 2015). For example, exposure to organophosphate (OP) pesti- cides and carbamates – commonly assessed by measurement of acetyl- cholinesterase (AChE) activity) – has been linked to attention problems (Rohlman et al., 2016; Rothlein et al., 2006), poorer memory (Rohlman et al., 2014; Rold ´ an-Tapia et al., 2005) and motor function (Rohlman et al., 2016; Rold ´ an-Tapia et al., 2005; Starks et al., 2012) among farmers. Although few occupational studies have studied the neuro- behavioral effects of pesticides active ingredients other than OP pesti- cides (Ismail et al. 2012; Meyer-Baron et al. 2015; Ohlander et al., 2019), a growing literature on children environmentally exposed to pesticides suggests that pyrethroid insecticides (Dalsager et al., 2019;
van Wendel de Joode et al., 2016; Viel et al., 2015), manganese (Mn)- containing fungicides like mancozeb (Gunier et al., 2016; Mora et al., 2018, 2016; van Wendel de Joode et al., 2016), and herbicides like glyphosate (Von Ehrenstein et al., 2019) may be associated with adverse neurobehavioral outcomes.
Exposure to multiple hazardous pesticide active ingredients is the rule rather than exception among farmers (Jepson et al., 2020). How- ever, due to the limitations of traditional regression techniques (e.g., limited capacity to handle highly correlated exposures), previous occupational studies have relied on multiple tests of association of in- dividual pesticide active ingredients or classes with neurobehavioral outcomes and have not accounted for co-pollutant confounding (Ismail et al., 2012; Meyer-Baron et al., 2015). Advanced variable selection and model averaging methods provide an opportunity to model the effect of
correlated co-pollutant exposures (Berger et al., 2019; Hamra and Buckley, 2018). Such methods can achieve a better trade-off between false positive and negative rates than conventional analytical ap- proaches (Agier et al., 2016; Lenters et al., 2018). Bayesian Model- Averaging (BMA) has been used in epidemiological studies to direct model selection, combined with estimation and prediction in complex multiple exposure situations. For example, BMA was recently used in a study that examined the association of phthalates and bisphenol A exposure with respiratory and allergic outcomes (Berger et al., 2019). In the present study, we applied BMA to examine the associations of complex exposure to multiple pesticide active ingredients with neuro- behavioral outcomes among Ugandan smallholder farmers.
2. Methods
2.1. Study area and population
We conducted a cross-sectional study of smallholder farmers in Wakiso District, Uganda, between September and November 2017. A detailed description of the study design and methods can be found elsewhere (Diemer et al., 2020; Fuhrimann et al., 2019; Staudacher et al., 2020). Briefly, farmers were eligible to participate if they were 18 years or older and worked within the study area. To ensure a pesticide exposure contrast among study participants, we aimed to recruit an equal number (~150) of conventional farmers who used predominantly synthetic pesticides and farmers – who at least for one of their crops – used organic pest control practices. Conventional farmers were randomly sampled from lists provided by local leaders, while organic farmers were sampled from a list of organic farmers provided by a local non-governmental organization, which served as a basis for further snowballing recruiting. Over two weeks, field staff received training on tools, ethics, and research background. Additionally, we conducted a week-long pilot study with 20 farmers from the same study area. This study is nested in the Pesticide Use in Tropical Settings (PESTROP) project, which aimed to deepen the understanding of the environmental, health, and regulatory dimensions of agricultural pesticide use in Costa Rica and Uganda (Dietler et al., 2019; Winkler et al., 2019).
Table 1
Summary of pesticide application practices and exposure-intensity scores (EIS) during the 12 months prior to enrollment, Wakiso district, Uganda, 2017.
Active
ingredient Chemical group Type Applicators who reported using this pesticide [n (%)]
Mixers who reported handling this pesticide [n (%)]
EIS [median (IQR)]
Yearly application [median (IQR)]
Yearly EIS- days [median (IQR)]
Total across all active ingredients 208 (97.2) 191 (89.3) 6.1 (3.0) 9 (26) 51.5 (179.5)
Glyphosate Phosphonoglycine H 165 (77.1) 152 (71) 6.1 (3.1) 2 (2) 10.0 (11.5)
Cypermethrin Pyrethroid I 124 (57.9) 116 (54.2) 6.4 (3.2) 3 (8.5) 21.6 (52.8)
Mancozeb Bisdithiocarbamate F 112 (52.3) 102 (47.7) 6.1 (3.2) 8 (17) 46.6 (108.3)
Profenofos Organophosphate I 105 (49.1) 99 (46.3) 6.4 (3) 2 (3) 11.6 (22.3)
2,4-D Alkylchlorophenoxy H 97 (45.3) 92 (43) 6.1 (2.4) 2 (2) 9.4 (11.6)
Dichlorvos Organophosphate I 34 (15.9) 31 (14.5) 6.2 (2.7) 2 (3) 9.2 (20.3)
Lambda-
cyhalothrin Pyrethroid I 30 (14) 27 (12.6) 5.7 (2.8) 2 (2) 11.5 (18.6)
Dimethoate Organophosphate I 28 (13.1) 25 (11.7) 6.4 (3.1) 3.5 (6) 25.2 (43.5)
Chlorpyrifos Organophosphate I 20 (9.3) 20 (9.3) 5.8 (3.8) 1 (0.2) 6.3 (4.4)
Carabryl Carbamate I 13 (6.1) 11 (5.1) 5.7 (1.6) 1 (1) 7.1 (4.3)
Carbofuran Carbamate I 10 (4.7) 7 (3.3) 5.8 (4.5) 1.5 (2) 10 (16.6)
Diazinon Organophosphate I 10 (4.7) 10 (4.7) 5.9 (3.5) 1 (0) 7.3 (3.6)
Paraquat Bipyridilium H 10 (4.7) 10 (4.7) 6.4 (1.7) 2 (2) 14 (12.2)
Permethrin Pyrethroid I 10 (4.7) 10 (4.7) 6 (3.3) 1 (1) 7.5 (3.7)
I
=insecticide, H
=herbicide, F
=fungicide.
IQR: interquartile range, *EIS between 0.89 and 13 (lowest to highest possible exposure).
*Dichotomized in the regression analysis, **excluded from the regression analysis due to low number of users.
Environment International 152 (2021) 106477
3
2.2. Interviews
We collected information on socio-demographic characteristics (e.g., sex, age, education), medical history (e.g., previous pesticide poison- ings, history of head injury [we asked “ Have you ever hit your head so hard that you fainted or lost consciousness?”)], work history (e.g., years working in agriculture and working with pesticides), frequency of PPE use, and hygienic behaviors after pesticide use (e.g., changing clothes and showering) via questionnaire. We also asked farmers how frequently they had used each of the 53 most commonly used pesticide products (i.e., the formulation with a specific brand name that is sold to the farmers) in the study area per month and for how many months they had used them during the 12 months preceding enrollment. These 53 pesticide products were identified based on previous surveys with smallholder farmers in Uganda (Atuhaire et al., 2017a, 2016; Clausen et al., 2017) and expertise from Uganda National Association of Com- munity and Occupational Health (UNACOH). These products included a total of 14 pesticide active ingredients (Table 1).
2.3. Pesticide exposure assessment
We estimated cumulative annual exposure during the 12 months prior to enrollment by combining application and mixing practices, frequency of PPE use, and hygienic behavior (Eq. (1)). A detailed description of this semi-quantitative exposure algorithm can be found elsewhere (Fuhrimann et al. 2020). Briefly, exposure-intensity scores (range: 0 – 13) were estimated using five exposure-modifying factors.
Two factors were expected to increase pesticide exposure: (i) mixing of pesticide active ingredients (MIX; score 5); and (ii) applying pesticides outdoors using manual handheld knap-sack sprayers – which was the case for all self-reported pesticide applications in our study (APPLICA- TION; score 8). Three factors were expected to decrease the exposure: (i) overall average protection achieved by PPE use, covering different body areas and accounting for differences in application frequency (PPE, score 0.14–1); (ii) time interval between pesticide application and change of clothes (CHANGE; score 0.7–1); and (iii) time interval be- tween application and shower (SHOWER; score 0.7 – 1).
Exposure − intensity score (EIS) = (MIX + APPLICATION) × PPE
× CHANGE × SHOWER (1)
We then estimated yearly application days per specific active ingredient by multiplying the average frequency of application per
month and the number of months per year that the specific active ingredient was used. By combining the yearly application days with the EIS we estimated yearly EIS-days for all 14 pesticide active ingredients (Eq. (2)).
EIS − days = Pesticide active ingredient − specific yearly application days
× EIS
(2)
2.4. Neurobehavioral assessment
We assessed five neurobehavioral domains (i.e., language, memory, attention, executive function, and motor function) using 11 neuro- behavioral tests, which resulted in 14 outcome variables (Table 2).
These tests were selected because they had been used in previous studies of workers from LMICs exposed to neurotoxicants (Glass et al., 2017;
Rohlman et al., 2016; van Wendel de Joode et al., 2001; Wesseling et al., 2006). Some of the tests are part of the World Health Organization (WHO) Neurobehavioral Core Test Battery (NCTB) (i.e., Benton Visual Retention Test (BVRT), Digit Span, Trail Making Test, and Digit Symbol) (Anger, 2014).
Two bilingual psychometricians (SN and JM), trained and supervised by a psychologist (TM), administered all neurobehavioral tests in the participant’s preferred language (English or Luganda) in a quiet room free from distraction.
2.4.1. Language
In the Phonetic Verbal Fluency test (Lezak, 2012), participants were asked to name as many words as possible starting with a certain initial letter (S-words in English and E-words in Luganda) in one minute. In the Semantic Verbal Fluency test (Lezak, 2012), participants were asked to name as many animals as possible in one minute. We examined the number of correct words in one minute for both tests.
2.4.2. Memory
We used the BVRT to assess recognition memory (Benton, 1983). In this test, participants were asked to memorize a figure and then recog- nize it among four similar figures. This same procedure was repeated with nine more figures, which were progressively increasing in complexity level. We examined the number of correctly identified fig- ures (range = 0 – 10) as our outcome of interest.
The Digit Span forward, a subtest of the Wechsler Adult Intelligence
Table 2Neurobehavioral tests (n
=11) and corresponding neurobehavioral outcome variables (n
=14) assessed in farmers from the Wakiso district, Uganda, 2017.
Domains Subdomains Neurobehavioral tests Outcome
variable unit Orientationa n Mean SD Median IQR Min Max
Language Fluency Semantic Verbal Fluency Correct animals (−) 287 11.7 3.5 12.0 5.0 3.0 26.0
Phonetic Verbal Fluency Correct words (−) 285 12.2 5.1 12.0 6.0 0.0 29.0 Executive
function Inhibition/flexibility Color Trail Part 2 Time (minutes) (+) 274 3.8 1.6 3.7 2.2 0.7 9.9 Working memory Digit Span backward Correct answers (−) 285 3.9 1.8 4.0 2.0 0.0 10.0 Complex
attention Processing speed TMT A Time (minutes) (+) 281 1.4 0.7 1.2 0.8 0.4 4.4
DSST Correct answers (−) 278 24.1 9.9 23.0 11.0 3.0 61.0
Sustained attention Digit Vigilance Time (minutes) (+) 275 5.3 1.5 5.1 1.8 1.4 11.2
Missed 6 (+) 275 13.1 13.5 9.0 13.5 0.0 86.0
Memory Recognition memory BVRT Correct answers (−) 283 5.8 2.2 6.0 3.0 1.0 10.0
Short-term memory Digit Span forward Correct answers (−) 285 4.2 1.6 4.0 2.0 1.0 10.0 Perceptual-motor
function Perceptual motor, fine
motoric ability, coordination Purdue Pegboard D. Points (−) 277 11.4 2.1 12.0 3.0 5.0 18.0 Non D. Points (−) 277 10.7 2.0 11.0 3.0 2.0 16.0
Hand motoric speed Finger Tapping test D. Points (−) 282 46.8 8.6 47.0 10.4 19.7 75.3
Non D. Points (−) 281 43.8 8.3 43.7 10.3 19.3 71.3
TMT A
=Trail Making Test A; DSST
=Digit Symbol Substitution Test; BVRT
=Benton Visual Retention Test; D.
=dominant hand; IQR
=Interquartile range, SD
=Standard deviation.
a
(
+) higher scores indicate poorer performance; (-) lower scores indicate poorer performance.
S. Fuhrimann et al.
Scale Revised (WAIS-R), was used to assess short-term memory (Wechsler, 1981). This test contains seven progressively longer pairs of random number sequences. These sequences were read aloud to par- ticipants and they were asked to orally repeat the digits of each sequence in the same order. Each correct sequence was scored with one point and then the total number of correct sequences (range = 0–14) was calculated.
2.4.3. Attention
Participants completed the Trail Making Test A, a test developed to assess attention and cognitive tracking and sequencing (Strauss et al., 2006). In this test, they were asked to join, in successive order, the numbers from 1 to 25, as fast as possible. Psychometricians pointed out errors as they occurred so that participants could immediately correct them. We examined the time (in seconds) needed to complete the test as our outcome of interest.
We also administered study participants the Digit Symbol test, a WAIS-R subtest that assesses complex attention and processing speed (Wechsler, 1981). This test required participants to match symbols to numbers according to a key located on the top of the page. The number of correctly matched symbols within 90 seconds was calculated.
We used the Digit Vigilance test to assess the sustained attention (Lewis et al., 1990). Participants were asked to find all “ six ” numbers on a sheet full of numbers and to mark them as quickly as possible. We examined the time (in seconds) the participant took to complete the test and the number of unmarked “ six ” numbers (i.e., omission errors) as our outcomes of interest.
2.4.4. Executive function
We administered the Color Trail Part 2 test (Maj et al., 1993) to assess cognitive flexibility and inhibition. Participants were asked to draw a line between numbered circles (1–25) in ascending order but alternating between two colors. We examined time (in minutes) needed to complete the test as our outcome of interest. This test was paired with the Ishihara
Test (Colman, 2014) to screen for potential color blindness; however, no farmer had a deficient color vision.
The Digit Span backward (Wechsler, 1981) was used to assess working memory. In this test, seven progressively longer pairs of random number sequences were read aloud to participants and they were asked to orally repeat the digits of each sequence in reverse order.
Each correct sequence in reverse order was scored with one point and then the total number of correct sequences (range = 0–14) was calculated.
2.4.5. Motor function
We used the Purdue Pegboard (Costa et al., 1963) to assess perceptual-motor coordination and fine motor function. Participants were asked to insert as many pegs (small rods) as possible into a row of holes on a pegboard (Lafayette Instrument Company, Model 32020A) within 30 seconds. We examined the number of pegs inserted correctly with both the dominant and the non-dominant hand as our outcome of interest.
We administered a Finger tapping test (Reed and Reed, 1997) to assess hand motoric speed. Participants were asked to press a button on an electronic tapper (Western Psychological Services, Model W-277) as many times as possible in 10 seconds for three consecutive trials. We then calculated the average number of taps for both the dominant and the non-dominant hand.
2.4.6. Exclusion criteria for neurobehavioral tests
The number of farmers excluded varied by neurobehavioral test
because not all study participants completed each test and some of them
had medical conditions or other circumstances that prevented them
from completing the test adequately (Table 2, Fig. 1). We excluded from
all analyses farmers who had ingested alcohol before the neuro-
behavioral assessment (n = 1) or who showed an overall lack of moti-
vation or understanding during the assessment according to their
psychometrician (n = 13). We also excluded participants from specific-
Fig. 1.Consort flow chart indicating number and reasons for exclusion and number of participants that were included in the 14 neurobehavior outcome vari-
able analyses.
Environment International 152 (2021) 106477
5
test analyses because they did not complete the test adequately (i.e., wrote the number sequences from the Digit span forward test on their arm instead of memorizing them) (n = 3), had eye problems (e.g., eye pain, blurry vision) (n = 4), had hand injuries or numbness (n = 6), did not understand or refused to complete a specific test (n = 15), or had incomplete entries (n = 6).
2.5. Statistical analyses
We examined differences in socio-demographic and occupational characteristics between farmers who reported applying at least one pesticide active ingredient during the 12 months preceding enrollment (henceforth called applicators, n = 208) and those who reported not applying any active ingredient in this period (henceforth called non- applicators, n = 80).
2.5.1. Analysis and selection of pesticide active ingredients
To improve our statistical power, we decided a priori to include in our analyses only pesticide active ingredients that were present in products reported to be used by at least 20 or more farmers during the 12 months prior to study enrollment. This resulted in nine active ingredients (i.e., glyphosate, cypermethrin, mancozeb, profenofos, 2,4-D, dichlorvos, lambda-cyhalothrin, dimethoate, and chlorpyrifos) out of the 14 origi- nally assessed. We assessed the correlations between exposure estimates for these nine pesticides using Spearman correlation coefficients (r
s).
We dichotomized annual exposure to pesticide active ingredients that were used by less than 35 farmers (i.e., dichlorvos, lambda- cyhalothrin, dimethoate, and chlorpyrifos) to improve the robustness of our models and avoid independent variables with skewed statistical distributions. Non-normally distributed neurobehavioral outcomes were transformed; more specifically, time-based variables were log
10trans- formed and Digit Vigilance test scores (that included 0
′s) were square- root transformed (Figure S1). We used Winsorization (Kotz, 2005) to reduce the effect of outliers (defined as outside the range of the median plus or minus 3 times the interquartile range (IQR)) in the
neurobehavioral outcomes ’ distribution.
2.5.2. Selection of covariates
We selected our covariates a priori based on our study design [pesticide application (applicators vs. non-applicators)] and previous studies that examined occupational pesticide exposure and neuro- behavioral outcomes (Ismail et al., 2012; Meyer-Baron et al., 2015): age (19 – 42, 43 – 55, and > 55 years), education ( < 7th year vs. >= 7th year), and psychometrician (A vs. B). We also adjusted our models for strong predictors of neurobehavioral outcomes: language of the assessment (Luganda vs. English), sex, literacy (yes vs. no), alcohol use (never vs.
ever), history of head injury (never vs. ever), and HIV status (positive vs.
negative).
2.5.3. Bayesian Model-Averaging (BMA) approach
We assessed associations of annual exposure to pesticide active in- gredients with each neurobehavioral outcome variable using a BMA approach (R package BAS; version 1.5.5) (Clyde et al., 2011). We selected the BMA approach because we expected our predictors (i.e., nine pesticide active ingredients) to spawn a very large model space that was unlikely to be dominated by any single model and was a formal response to model uncertainty (Hinne et al., 2020; Steel, 2020). Con- trary to traditional all-or-none selection models, BMA computes an in- clusion probability for each predictor. This inclusion probability is the sum of the posterior model probabilities over models that included this particular predictor. In BMA, the principle is that the higher the poste- rior model probability, the more likely it is that the model in question fits the data and therefore, in our case, that the active ingredient is in fact associated with the outcome. We used the Jeffreys-Zellner-Siow (JZS) prior for the regression coefficients and a beta-binomial (1,1) prior for the model space (Liang et al., 2008). Moreover, our BMA approach also accounted for multiple-testing across the different models (Scott and Berger, 2010).
To minimize false-positive and false-negative discovery rates, we selected exposure-outcome associations as noteworthy if the following 2-level criteria were met:
(1) the sum of posterior model probabilities for covariate-only models (i.e., models with only a priori selected and/or optional covariates but no active ingredients) was < 0.5 (or equivalently,
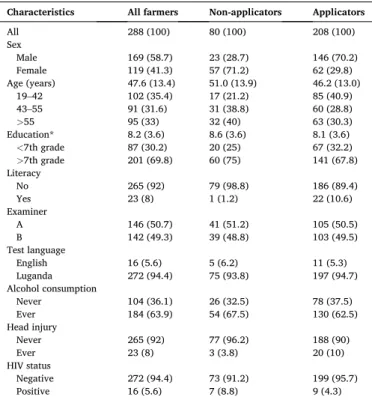
Table 3Socio-demographic and occupational characteristics of farmers in Wakiso, Uganda, 2017 [n (%) or mean (SD)].
Characteristics All farmers Non-applicators Applicators
All 288 (100) 80 (100) 208 (100)
Sex
Male 169 (58.7) 23 (28.7) 146 (70.2)
Female 119 (41.3) 57 (71.2) 62 (29.8)
Age (years) 47.6 (13.4) 51.0 (13.9) 46.2 (13.0)
19–42 102 (35.4) 17 (21.2) 85 (40.9)
43–55 91 (31.6) 31 (38.8) 60 (28.8)
>55 95 (33) 32 (40) 63 (30.3)
Education* 8.2 (3.6) 8.6 (3.6) 8.1 (3.6)
<7th grade 87 (30.2) 20 (25) 67 (32.2)
>7th grade 201 (69.8) 60 (75) 141 (67.8)
Literacy
No 265 (92) 79 (98.8) 186 (89.4)
Yes 23 (8) 1 (1.2) 22 (10.6)
Examiner
A 146 (50.7) 41 (51.2) 105 (50.5)
B 142 (49.3) 39 (48.8) 103 (49.5)
Test language
English 16 (5.6) 5 (6.2) 11 (5.3)
Luganda 272 (94.4) 75 (93.8) 197 (94.7)
Alcohol consumption
Never 104 (36.1) 26 (32.5) 78 (37.5)
Ever 184 (63.9) 54 (67.5) 130 (62.5)
Head injury
Never 265 (92) 77 (96.2) 188 (90)
Ever 23 (8) 3 (3.8) 20 (10)
HIV status
Negative 272 (94.4) 73 (91.2) 199 (95.7)
Positive 16 (5.6) 7 (8.8) 9 (4.3)
*
Education levels range from 0 (no education) to 22 (University level nine).
Fig. 2.
Heatmap showing spearman correlation coefficients for all nine pesticide-specific yearly exposure-intensity scores (EIS) that were included in the Bayesian Model-Averaging (BMA) approach.
S. Fuhrimann et al.
the sum of posterior probabilities in which at least one active ingredient was included was at least 0.5); and
(2) the marginal inclusion probability (MIP; the sum of the posterior model probabilities for models in which the variable – or pesti- cide active ingredient, in our case – was included) was > 0.5.
Note that (meeting of) level 2 implied (met of) level 1, but not the other way around. Level 1 was motivated by the desire to identify out- comes for which there was evidence that they were associated with exposure to at least one, but perhaps several, pesticide active in- gredients, while recognizing that in some cases we might not be able to identify the specific active ingredient(s) involved. Level 2 was then used to (try to) identify the specific active ingredients involved. Therefore, we report outcomes (but no effect estimates) for which level 1 was met, whereas we report slope coefficients and 95% Bayesian Credible In- tervals (BCIs) for outcomes and active ingredients that met both levels.
Statistical analyses were done in R (Foundation for Statistical Computing, version 3.6.3, RStudio version 1.2).
3. Results
Most study participants were male (59%), were interviewed in Luganda (94%), and reported consuming alcohol (64%) (Table 3). Their median (IQR) age and years of schooling were 49 (19) years and 7 (4) years. Only a few farmers were HIV positive (6%) or reported a history of head injury (8%). Applicators were more likely to be male (70%) and literate (11%) compared to non-applicators (29% and 1%, respectively).
Seventy-two percent of farmers enrolled in our study (n = 208) were applicators and reported using pesticide products that included 14 active ingredients in the 12 months preceding enrollment (Table 1). The most widely used pesticide active ingredients were glyphosate (77%), cypermethrin (58%), and mancozeb (52%). Mancozeb was the most frequently applied active ingredient [median (IQR) application days/
year 8 (17)]. Most applicators (84%) reported using multiple active in- gredients during the 12 months prior to enrollment [median (IQR) number of active ingredients used 3 (4)]. A total of 72 different com- binations of which 36 combinations were used by two or more farmers, of active ingredients were applied when considering only the nine pesticide active ingredients used by at least 20 farmers. The most frequent combination (applied by 13 farmers) consisted of cypermeth- rin, 2,4-D, glyphosate, mancozeb, and profenofos (Table S1).
Mancozeb had the highest EIS-days [median (IQR) 47 (108)], fol- lowed by cypermethrin [22 (53)] and dimethoate [25 (44); Table 1]. We observed strong correlations between EIS-days for glyphosate and 2,4-D (r
s0.64) and between mancozeb and cypermethrin (r
s0.63) (Fig. 2). The summary statistics for all 14 neurobehavioral outcome variables are shown in Table 2 and Figure S1.
3.1. BMA estimates
Six neurobehavioral outcome variables met our level 1 criterion (i.e., MIP of the empty model < 0.5): BVRT (summed posterior probability of covariate-only models = 0.18), Finger tapping dominant hand test (0.29), Trail making A test (0.31), Finger tapping non-dominant hand test (0.42), Digit symbol test (0.45) and Semantic verbal fluency test (0.5) (Tables 4 and 5).
According to our level 2 criterion (i.e., MIP of individual pesticide
Table 4Marginal inclusion probability (MIP) of the empty model representing the sum of posterior model probabilities for covariate-only models (i.e., models with only
a prioriselected and/or optional covariates but no active in- gredients). Selection cut-off according to level 1 is indicated at MIP
<50%.
Neurobehavioral outcome MIP
BVRT (scores) 0.18
Finger tapping dominant hand (scores) 0.29
Trail making A log10 (minutes) 0.31
Finger tapping non-dominant hand (scores) 0.42
Digit symbol (scores) 0.45
Semantic verbal fluency (scores) 0.50
Color trail making 2 log10 (minutes) 0.68
Digit vigilance square root (missed 6) 0.71
Digit vigilance log10 (minutes) 0.73
Digit span forward (scores) 0.74
Phonemic verbal fluency (scores) 0.77
Digit span backwards (scores) 0.81
Purdue pegboard dominant hand (scores) 0.82
Purdue pegboard non-dominant hand (scores) 0.87
Table 5
Overview of main Bayesian model-averaging (BMA) estimates for six selected neurobehavioral outcome variables indicating (a) marginal inclusion probability (MIP) for the empty models (level 1) and each active ingredient (level 2). green color intensity
=increasing MIP. (b) slope coefficient per interquartile range (IQR) increase in pesticide active ingredient EIS estimates for each neurobehavioral outcome variable. Orange color: pesticide active ingredient is associated with neurobehavioral outcome variable, BMA models were adjusted for pesticide applicator status, age, education, and psychometrician, language of the assessment, sex, literacy, alcohol use, history of head injury, and HIV status.
a
(
+) higher scores indicate poorer performance; (-) lower scores indicate poorer performance.
EnvironmentInternational152(2021)106477
7
Table 6
Bayesian model-averaging model (BMA) estimates for the six selected neurobehavioral outcome variables. Indicated are the marginal inclusion probability (MIP) of the empty model, the MIP for each active ingredient, its slope coefficient and the 95% Bayesian Credible Interval (BCI) per interquartile range (IQR) increase in pesticide active ingredient EIS. BMA models were adjusted for pesticide applicator, age, education, and psy- chometrician, language of the assessment, sex, literacy, alcohol use, history of head injury, and HIV status.
Language Complex attention Complex attention
Semantic verbal fluency (scores) Trail making A log10 (minutes) Digit symbol (scores)
Empty Model/
Exposure MIP Slope coef. 95% BCI Empty Model/
Exposure MIP Slope coef. 95% BCI Empty Model/
Exposure MIP Slope coef. 95% BCI
Empty Model 0.5 NA NA NA Empty Model 0.314 NA NA NA Empty Model 0.45 NA NA NA
2,4-D 0.061 0.004 − 0.004 0.036 2,4-D 0.082 0 0 0.007 2,4-D 0.086 −0.023 −0.333 0
Chlorpyrifos 0.078 0.017 − 0.001 0.194 Chlorpyrifos 0.457 0.013 −6.00E-
06 0.043 Chlorpyrifos 0.263 −0.272 −1.459 1.00E-
Cypermethrin 0.095 0.022 − 0.001 0.304 Cypermethrin 0.096 −0.001 −0.017 0 Cypermethrin 0.041 −0.005 0 04 0
Dichlorvos 0.086 − 0.022 − 0.276 0 Dichlorvos 0.221 0.005 0 0.034 Dichlorvos 0.123 −0.1 −1.015 0
Dimethoate 0.044 0.003 0 0 Dimethoate 0.058 0 0 0.01 Dimethoate 0.04 0.005 0 0
Glyphosate 0.078 0.007 0 0.09 Glyphosate 0.176 0.002 0 0.013 Glyphosate 0.176 −0.068 −0.522 0
Lambda-Cyhalothrin 0.096 − 0.031 − 0.36 0 Lambda-Cyhalothrin 0.08 0.001 0 0.015 Lambda-Cyhalothrin 0.055 −0.027 −0.126 0
Mancozeb 0.224 0.137 0 0.88 Mancozeb 0.079 −0.001 −0.022 0 Mancozeb 0.046 −0.019 0 0
Profenofos 0.045 − 0.002 0 0 Profenofos 0.058 0 −0.001 0.003 Profenofos 0.048 −0.011 0 0
Memory Perceptual-motor function Perceptual-motor function
BVRT (scores) Finger tapping dom. hand (scores) Finger tapping non-dom. hand (scores)
Empty Model/
Exposure MIP Slope coef. 95% BCI Empty Model/
Exposure MIP Slope coef. 95% BCI Empty Model/
Exposure MIP Slope coef. 95% BCI
Empty Model 0.178 NA NA NA Empty Model 0.295 NA NA NA Empty Model 0.424
2,4-D 0.151 − 0.014 − 0.187 3.00E-
05 2,4-D 0.148 −0.035 −0.567 3.00E-
04 Dimethoate 0.235 0.438 0 2.698
Chlorpyrifos 0.076 − 0.008 − 0.121 0.007 Chlorpyrifos 0.063 0.007 −0.104 0.229 2,4-D 0.149 −0.051 −0.503 0.001
Cypermethrin 0.054 − 0.001 − 2.00E-
04 8.00E-
05 Cypermethrin 0.061 0.004 0 0.149 Chlorpyrifos 0.05 −0.002 0 0.003
Dichlorvos 0.073 − 0.008 − 0.094 0.002 Dichlorvos 0.08 −0.028 −0.439 0 Cypermethrin 0.056 −0.014 −0.101 0.111
Dimethoate 0.117 0.044 − 0.002 0.521 Dimethoate 0.13 0.162 −3.00E-
04 1.802 Dichlorvos 0.096 −0.053 −0.652 0
Glyphosate 0.665 − 0.103 − 0.236 0 Glyphosate 0.483 −0.217 −0.712 0 Glyphosate 0.235 −0.087 −0.531 1.00E-
Lambda-Cyhalothrin 0.074 0.01 0 0.138 Lambda-Cyhalothrin 0.079 0.031 −0.048 0.516 Lambda-Cyhalothrin 0.063 −0.022 −0.225 04 0.018
Mancozeb 0.061 0.007 − 4.00E-
04 0.073 Mancozeb 0.064 −0.012 −0.151 0.126 Mancozeb 0.066 0.04 −0.004 0.393
Profenofos 0.054 − 0.001 0 0 Profenofos 0.07 0.012 −0.004 0.235 Profenofos 0.073 0.021 0 0.311
S. Fuhrimann et al.
active ingredients > 0.5), we observed that higher annual exposure to glyphosate was associated with lower Benton Visual Retention Test scores (slope coefficient per IQR increase in EIS [95% BCI] − 0.10 [ − 0.24; 0]; MIP = 0.66) (Tables 5 and 6). We found no associations of other active ingredients with the BVRT or the other five neurobehavioral outcome variables selected according to level 1. Of note, the two highest MIPs for the selected neurobehavioral outcome variables were as fol- lows: Finger tapping test dominant hand: glyphosate (0.48) and 2,4-D (0.15); Trail making A test: chlorpyrifos (0.46), dichlorvos (0.22);
Finger tapping non-dominant hand test: glyphosate (0.24) and 2,4-D (0.15); Digit symbol test: chlorpyrifos (0.26) and glyphosate (0.17);
Semantic verbal fluency test: mancozeb (0.22) and lambda-cyhalothrin (0.10). Overall, we also observed following trends for a impairment due to the following pesticide active ingredients (though not selected under level 2): dichlorvos with all six , glyphosate with five and lambda- cyhalothrin and chlorpyrifos with four neurobehavioral outcome variables.
4. Discussion
In this study of Ugandan smallholder farmers, we observed that overall pesticide exposure was associated with impaired visual memory, language, perceptual-motor function, and complex attention. However, when examining individual pesticide active ingredients, we only found an association between exposure to the herbicide glyphosate and impaired visual memory. To our knowledge, this is the first occupational study reporting an association between glyphosate exposure and a neurobehavioral outcome.
Animal studies have suggested neurotoxic effects of glyphosate and glyphosate-based herbicides, including decreased locomotor activity (Ait Bali et al., 2017; Baier et al., 2017; Gallegos et al., 2016; Martínez et al., 2018) and depressive behavior (Ait Bali et al., 2017; Cattani et al., 2017). To date, only a few human case studies have suggested that acute glyphosate exposure may lead to direct central nervous system toxicity (Malhotra et al., 2010; Potrebi ´ c et al., 2009; Wang et al., 2011).
Recently, a case-control study found that prenatal residential proximity to agricultural glyphosate applications was associated with increased odds of autism spectrum disorder (ASD) during childhood (Von Ehren- stein et al., 2019). Researchers around the world have expressed their concern about the lack of data on real-world exposure to glyphosate and its related health outcomes (Landrigan and Belpoggi, 2018; Myers et al., 2016). Vandenberg et al. (2017) concluded that current safety standards for glyphosate are outdated and may fail to protect public health or the environment. The observed adverse effects of glyphosate exposure on visual memory are concerning, as it was the most frequently used pesticide in our study population (i.e., 77% applicators reported applying glyphosate) and remains the most widely used herbicide in the world (Benbrook, 2016).
In line with previous occupational studies (Rohlman et al., 2016;
Rold ´ an-Tapia et al., 2005; Starks et al., 2012), we found associations of overall pesticide exposure with impaired visual memory, language, perceptual-motor function, and complex attention problems. However, when we looked at associations between these neurobehavioral out- comes and individual pesticide active ingredients, we only observed the association of glyphosate exposure with impaired visual memory. One potential explanation for the predominantly null associations found in our study is our adjustment for multiple testing using BMA – which was not performed by previous occupational studies (Meyer-Baron et al., 2015). Another possible explanation is the low reported use of known neurotoxic pesticide active ingredients such as OP pesticides, carba- mates, pyrethroids, and bipyridilium (Lewis et al., 2016), which limited our statistical power to examine the effects of these chemicals.
Our study has several limitations. First, we did not examine the joint effects of pesticide active ingredients, mainly because we had a total of 74 different combinations (and only 32 were used by two or more farmers) and the most frequent combination was only used by 13
farmers. To further study the joint effects in occupational studies, the focus should be on applicators with a more homogenous exposure dis- tribution. In such a case, more complex Bayesian modeling approaches such as Bayesian kernel machine regression (BKMR) or Bayesian hier- archical models (BHM) would account for exposure-interactions and non-linear exposure-response relations (Hamra and Buckley, 2018).
Second, our cross-sectional study design limits causal interpretation as neurobehavioral outcomes might be affected by both short-term expo- sure events (recent applications), more chronic exposures or poisoning in the past. To overcome this limitation, longitudinal studies of neuro- behavioral outcomes are warranted. Third, the yearly EIS are derived from questionnaires and could be prone to reporting bias (Arthi et al., 2018). Further validations of the exposure algorithm with pesticide- specific biomarkers are needed to adjust the exposure weights to the Ugandan context (Jones et al., 2020). Lastly, we did not consider e.g., prolonged dermal and food ingestion exposure routes (Atuhaire et al., 2017b) – which may have led to an underestimation of the total pesti- cide exposure.
However, the present study also has considerable strengths, perhaps most notable among them being its use of the BMA approach. We report for the first time the application of BMA on neurobehavioral outcomes in an occupational setting with exposure to multiple pesticide active in- gredients. The BMA approach accounts for multiple testing (Scott and Berger, 2010) and has low false-positive error rates, enabling re- searchers to disentangle the effects of individual chemicals in a multiple exposure setting (Berger et al., 2019; Lazarevic et al., 2019). In addition, we used validated neurobehavioral tests that have been previously administered to populations in Africa and groups with low educational attainment (Farahat et al., 2003; Fiedler et al., 1997; London et al., 2012; Rohlman et al., 2016; Rold ´ an-Tapia et al., 2005). Finally, we were able to adjust for relevant confounders (e.g., education, age, and sex) of the associations between exposure to pesticides and neurobehavioral outcomes.
5. Conclusion
In this study, we found that overall pesticide exposure was associated with several neurobehavioral outcome variables in an agricultural setting in a low-income country. However, when we examined indi- vidual pesticide active ingredients, we observed predominantly null associations, except for a positive association between glyphosate exposure and impaired visual memory. Glyphosate is the most widely used herbicide in the world, but no previous studies have examined its neurobehavioral effects in farmers, while accounting for co-exposure confounding. Additional (prospective) studies are needed to replicate our findings.
Author contributions
SF, AMM, MSW, TM, PS, CN, and AA: conception and planning. SF, PS, TM, AA, SN, and JM: collection of data. SF, AMM, LP, AF, and HK:
analysis and interpretation of data. SF, LP, and AMM: drafting of the manuscript. All authors participated in editing the final version of the manuscript.
Declaration of competing interest
The authors declare that they have no conflicting interests. HK and SF reports grants from CropLife Europe, outside the submitted work (IMPRESS study: www.impress-project.org).
Acknowledgments
We gratefully acknowledge the study participants and staff, namely
Annah Nyesigire, Nuhuh Mutebi, Esther Mirembe, Lydia Yariwo, and
Julian Nandhego. Finally, we thank the entire PESTROP team for their
Environment International 152 (2021) 106477
9
contribution along with the fieldwork and valuable discussions around the manuscript. This work was supported by the Swiss Network for In- ternational Studies (SNIS). SF’s effort was also supported by a fellowship of the Swiss National Science Foundation (SNSF; grant number:
180757).
Appendix A. Supplementary data
Supplementary data to this article can be found online at https://doi.
org/10.1016/j.envint.2021.106477.
References
Agier, L., Portengen, L., Chadeau-hyam, M., Basagana, X., Giorgis-allemand, L., Siroux, ˜ V., Robinson, O., Vlaanderen, J., Gonz´alez, J.R., Nieuwenhuijsen, M.J., Vineis, P., Vrijheid, M., Slama, R., Vermeulen, R., 2016. Regression-based methods for exposome studies Generation of the Exposome 1848, 1848–1856.
Ait Bali, Y., Ba-Mhamed, S., Bennis, M., 2017. Behavioral and immunohistochemical study of the effects of subchronic and chronic exposure to glyphosate in mice. Front.
Behav. Neurosci. 11, 1–13. https://doi.org/10.3389/fnbeh.2017.00146.
Anger, K.W., 2014. Reconsideration of the WHO NCTB strategy and test selection.
Neurotoxicology 23, 224–231. https://doi.org/10.1038/jid.2014.371.
Arthi, V., Beegle, K., De Weerdt, J., Palacios-L´opez, A., 2018. Not your average job:
measuring farm labor in Tanzania. J. Dev. Econ. 130, 160–172. https://doi.org/
10.1016/j.jdeveco.2017.10.005.
Atuhaire, A., Kaye, E., Mutambuze, I., Matthews, G., Friedrich, T., Jors, E., 2017a.
Assessment of dithiocarbamate residues on tomatoes conventionally grown in Uganda and the effect of simple washing to reduce exposure risk to consumers.
Environ. Health Insights 11. https://doi.org/10.1177/1178630217712218.
Atuhaire, A., Kaye, E., Mutambuze, I., Matthews, G., Friedrich, T., Jors, E., 2017b.
Assessment of dithiocarbamate residues on tomatoes conventionally grown in Uganda and the effect of simple washing to reduce exposure risk to consumers.
Environ. Health Insights 11, 1–8. https://doi.org/10.1177/1178630217712218.
Atuhaire, A., Ocan, D., Jørs, E., 2016. Knowledge, attitudes, and practices of tomato producers and vendors in Uganda. Adv. Nutr. Food Sci. 1, 1–7.
Baier, C.J., Gallegos, C.E., Raisman-Vozari, R., Minetti, A., 2017. Behavioral impairments following repeated intranasal glyphosate-based herbicide administration in mice.
Neurotoxicol. Teratol. 64, 63–72. https://doi.org/10.1016/j.ntt.2017.10.004.
Benbrook, C.M., 2016. Trends in glyphosate herbicide use in the United States and globally. Environ. Sci. Eur. 28, 1–15. https://doi.org/10.1186/s12302-016-0070-0.
Benton, A.L., 1983. Contributions to neuropsychological assessment: a clinical manual.
Oxford University Press, New York.
Berger, K., Eskenazi, B., Balmes, J., Kogut, K., Holland, N., Calafat, A.M., Harley, K.G., 2019. Prenatal high molecular weight phthalates and bisphenol A, and childhood respiratory and allergic outcomes. Pediatr. Allergy Immunol. 30, 36–46. https://doi.
org/10.1111/pai.12992.
Cattani, D., Cesconetto, P.A., Tavares, M.K., Parisotto, E.B., De Oliveira, P.A., Rieg, C.E.
H., Leite, M.C., Prediger, R.D.S., Wendt, N.C., Razzera, G., Filho, D.W., Zamoner, A., 2017. Developmental exposure to glyphosate-based herbicide and depressive-like behavior in adult offspring: implication of glutamate excitotoxicity and oxidative stress. Toxicology 387, 67–80. https://doi.org/10.1016/j.tox.2017.06.001.
Clausen, A., Thomsen, J., Atuhaire, A., Jors, E., 2017. Effect of integrated pest management training on Ugandan small-scale farmers. Environ. Health Insights 11.
https://doi.org/10.1177/1178630217703391.
Clyde, M.A., Ghosh, J., Littman, M.L., 2011. Bayesian adaptive sampling for variable selection and model averaging. J. Comput. Graph. Stat. 20, 80–101. https://doi.org/
10.1198/jcgs.2010.09049.
Colman, A.M., 2014. Dictionary of Psychology, third ed. Oxford University Press, Oxford.
Costa, L.D., Vaughan, H.G., Levita, E., Farber, N., 1963. Purdue Pegboard as a predictor of the presence and laterality of cerebral lesions. J. Consult. Psychol. 27, 133–137.
https://doi.org/10.1037/h0040737.
Dalsager, L., Fage-Larsen, B., Bilenberg, N., Jensen, T.K., Nielsen, F., Kyhl, H.B., Grandjean, P., Andersen, H.R., 2019. Maternal urinary concentrations of pyrethroid and chlorpyrifos metabolites and attention deficit hyperactivity disorder (ADHD) symptoms in 2–4-year-old children from the Odense Child Cohort. Environ. Res. 176, 108533. https://doi.org/10.1016/j.envres.2019.108533.
Diemer, N., Staudacher, P., Atuhaire, A., Fuhrimann, S., Inauen, J., 2020. Smallholder farmers’ information behavior differs for organic versus conventional pest management strategies: a qualitative study in Uganda. J. Clean. Prod. doi: 10.101 6/j.jclepro.2020.120465.
Dietler, D., Leuenberger, A., Bempong, N., Cramer, C., Eggen, R.I.L., Erismann, S., Ferazzi, S., Flahault, A., Fletcher, H.A., Fuhrer, B., Fuhrimann, S., Greter, H., Heerdegen, A.C., Leach, M., Leissing, A., Lilje, J., Penny, M.A., Prytherch, H., Vounatsou, P., Weiss, F., Wiedemann, R., Winkler, M.S., Zhou, X.-N., Utzinger, J., 2019. Health in the 2030 Agenda for Sustainable Development: from framework to action, transforming challenges into opportunities. J. Glob. Health 9, 1–6. https://
doi.org/10.7189/jogh.09.020201.
Fuhrimann, S., Kl´anov´a, J., Pˇribylov´a, P., et al., 2020. Qualitative assessment of 27 current-use pesticides in air at 20 sampling sites across Africa. Chemosphere 258, 127333. https://doi.org/10.1016/j.chemosphere.2020.127333.
Farahat, T.M., Abdelrasoul, G.M., Amr, M.M., Shebl, M.M., Farahat, F.M., Anger, W.K., 2003. Neurobehavioural effects among workers occupationally exposed to
organophosphorous pesticides. Occup. Environ. Med. 60, 279–286. https://doi.org/
10.1136/oem.60.4.279.
Fiedler, N., Kipen, H., Kelly-McNeil, K., Fenske, R., 1997. Long-term use of organophosphates and neuropsychological performance. Am. J. Ind. Med. 32, 487–496. https://doi.org/10.1002/(SICI)1097-0274(199711)32:5<487::AID- AJIM8>3.0.CO;2-P.
Fuhrimann, S., Staudacher, P., Lindh, C.H., van Wendel de Joode, B., Mora, A.M., Winkler, M.S., Kromhout, H.J., 2020. Variability and predictors of weekly pesticide exposure in applicators from organic, sustainable and conventional smallholder farms in Costa Rica. Occup. Environ. Med. 77, 40–77. doi: 10.1136/oemed-2019-10 5884.
Fuhrimann, S., Winkler, M.S., Staudacher, P., Weiss, F.T., Stamm, C., Eggen, R.I.L., Lindh, C.H., Menezes-Filho, J.A., Baker, J.M., Ramírez-Munoz, F., Guti˜ ´errez- Vargas, R., Mora, A.M., 2019. Exposure to pesticides and health effects on farm owners and workers from conventional and organic agricultural farms in costa rica:
protocol for a cross-sectional study. JMIR Res. Protoc. 8, e10914. https://doi.org/
10.2196/10914.
Gallegos, C.E., Bartos, M., Bras, C., Gumilar, F., Antonelli, M.C., Minetti, A., 2016.
Exposure to a glyphosate-based herbicide during pregnancy and lactation induces neurobehavioral alterations in rat offspring. Neurotoxicology 53, 20–28. https://doi.
org/10.1016/j.neuro.2015.11.015.
Glass, T., Dalvie, M.A., Holtman, Z., Vorster, A.A., Ramesar, R.S., London, L., 2017. DNA variants and organophosphate neurotoxicity among emerging farmers in the Western Cape of South Africa. Am. J. Ind. Med. 61, 11–20. https://doi.org/10.1002/
ajim.22790.
Gunier, R.B., Arora, M., Jerrett, M., Bradman, A., Harley, K.G., Mora, A.M., Kogut, K., Hubbard, A., Austin, C., Holland, N., Eskenazi, B., 2016. Manganese in teeth and neurodevelopment in Young Mexican- American Children. Environ. Res. 145, 688–695. https://doi.org/10.1016/j.envres.2015.09.003.
Hamra, G.B., Buckley, J.P., 2018. Environmental exposure mixtures: questions and methods to address them. Curr. Epidemiol. Reports 5, 160–165. https://doi.org/
10.1007/s40471-018-0145-0.
Hinne, M., Gronau, Q.F., van den Bergh, D., Wagenmakers, E.-J., 2020. A Conceptual introduction to Bayesian model averaging. Adv. Methods Pract. Psychol. Sci. 3, 200–215. https://doi.org/10.1177/2515245919898657.
Ismail, A.A., Bodner, T.E., Rohlman, D.S., 2012. Neurobehavioral performance among agricultural workers and pesticide applicators: a meta-analytic study. Occup.
Environ. Med. 69, 457–464. https://doi.org/10.1136/oemed-2011-100204.
Jepson, P.C., Guzy, M., Blaustein, K., Sow, M., Sarr, M., Mineau, P., Kegley, S., 2014.
Measuring pesticide ecological and health risks in West African agriculture to establish an enabling environment for sustainable intensification. Philos. Trans. R.
Soc. B Biol. Sci. 369 https://doi.org/10.1098/rstb.2013.0491.
Jones, K., Basinas, I., Kromhout, H., et al., 2020. IMPRESS: Improving Exposure Assessment Methodologies for Epidemiological Studies on Pesticides. JMIR Res.
Protoc. 9, 8–9. https://doi.org/10.2196/16448.
Jepson, P.C., Murray, K., Bach, O., Bonilla, M.A., Neumeister, L., 2020. Selection of pesticides to reduce human and environmental health risks: a global guideline and minimum pesticides list. Lancet Planet. Heal. 4, e56–e63. https://doi.org/10.1016/
S2542-5196(19)30266-9.
Kotz, S., 2005. Encyclopedia of Statistical Sciences. Wiley-Interscience, New York.
Landrigan, P.J., Belpoggi, F., 2018. The need for independent research on the health effects of glyphosate-based herbicides. Environ. Heal. A Glob. Access Sci. Source.
doi:10.1186/s12940-018-0392-z.
Lazarevic, N., Barnett, A.G., Sly, P.D., Knibbs, L.D., 2019. Statistical methodology in studies of prenatal exposure to mixtures of endocrine-disrupting chemicals: a review of existing approaches and new alternatives. Environ. Health Perspect. 127 https://
doi.org/10.1289/EHP2207.
Lenters, V., Vermeulen, R., Portengen, L., 2018. Performance of variable selection methods for assessing the health effects of correlated exposures in case-control studies. Occup. Environ. Med. 75, 522–529. https://doi.org/10.1136/oemed-2016- 104231.
Lewis, K.A., Tzilivakis, J., Warner, D.J., Green, A., 2016. An international database for pesticide risk assessments and management. Hum. Ecol. Risk Assess. 22, 1050–1064.
https://doi.org/10.1080/10807039.2015.1133242.
Lewis, R., Kelland, D.Z., Kupke, T., 1990. A normative study of the repeatable cognitiveperceptual- motor battery. Arch. Clin. Neuropsychol. 5, 187. https://doi.
org/10.1016/0887-6177(90)90095-7.
Lezak, M.D., 2012. Neuropsychological assessment. Oxford University Press, New York.
Liang, F., Paulo, R., Molina, G., Clyde, M.A., Berger, J.O., 2008. Mixtures of g priors for Bayesian variable selection. J. Am. Stat. Assoc. 103, 410–423. https://doi.org/
10.1198/016214507000001337.
London, L., Beseler, C., Bouchard, M.F., Bellinger, D.C., Colosio, C., Grandjean, P., Harari, R., Kootbodien, T., Kromhout, H., Little, F., Meijster, T., Moretto, A., Rohlman, D.S., Stallones, L., 2012. Neurobehavioral and neurodevelopmental effects of pesticide exposures. Neurotoxicology 33, 887–896. https://doi.org/10.1016/j.
neuro.2012.01.004.
Maj, M., D’Elia, L., Satz, P., Janssen, R., Zaudig, M., Uchiyama, C., Starace, F., Galderisi, S., Chervinsky, A., 1993. Evaluation of two new neuropsychological tests designed to minimize cultural bias in the assessment of HIV-1 seropositive persons: a WHO study. Arch. Clin. Neuropsychol. 8, 123–135. https://doi.org/10.1093/arclin/
8.2.123.
Malhotra, R.C., Ghia, D.K., Cordato, D.J., Beran, R.G., 2010. Glyphosate-surfactant herbicide-induced reversible encephalopathy. J. Clin. Neurosci. 17, 1472–1473.
https://doi.org/10.1016/j.jocn.2010.02.026.
Martínez, M.M.A., Ares, I., Rodríguez, J.L., Martínez, M.M.A., Martínez-Larranaga, M.R., ˜ Anad´on, A., 2018. Neurotransmitter changes in rat brain regions following S. Fuhrimann et al.
glyphosate exposure. Environ. Res. 161, 212–219. https://doi.org/10.1016/j.
envres.2017.10.051.
Meyer-Baron, M., Knapp, G., Sch¨aper, M., van Thriel, C., 2015. Meta-analysis on occupational exposure to pesticides - neurobehavioral impact and dose-response relationships. Environ. Res. 136, 234–245. https://doi.org/10.1016/j.
envres.2014.09.030.
Mora, A.M., Arora, M., Harley, K.G., Kogut, K., Parra, K., Hern´andez-Bonilla, D., Gunier, R.B., Bradman, A., Smith, D.R., Eskenazi, B., 2016. Prenatal and postnatal manganese teeth levels and neurodevelopment at 7, 9, and 10.5 years in the CHAMACOS cohort. Environ. Int. 84, 39–54. https://doi.org/10.1016/j.
envint.2015.07.009.
Mora, A.M., C´ordoba, L., Cano, J.C., Hernandez-Bonilla, D., Pardo, L., Schnaas, L., Smith, D.R., Menezes-Filho, J.A., Mergler, D., Lindh, C.H., Eskenazi, B., de Joode, B. van W., 2018. Prenatal mancozeb exposure, excess manganese, and neurodevelopment at 1 year of age in the infants’ environmental health (ISA) study. Environ. Health Perspect. 126, 1–9. doi:10.1289/EHP1955.
Myers, J.P., Antoniou, M.N., Blumberg, B., Carroll, L., Colborn, T., Everett, L.G., Hansen, M., Landrigan, P.J., Lanphear, B.P., Mesnage, R., Vandenberg, L.N., Vom Saal, F.S., Welshons, W. V., Benbrook, C.M., 2016. Concerns over use of glyphosate-based herbicides and risks associated with exposures: a consensus statement. Environ.
Heal. A Glob. Access Sci. Source. doi:10.1186/s12940-016-0117-0.
Negatu, B., Vermeulen, R., Mekonnen, Y., Kromhout, H., 2016. A method for semi- quantitative assessment of exposure to pesticides of applicators and re-entry workers: an application in three farming systems in Ethiopia. Ann. Occup. Hyg. 60, 669–683. https://doi.org/10.1093/annhyg/mew022.
OECD, FAO, 2018. OECD-FAO Agricultural Outlook 2018-2027. OECD Publishing, Food and Agriculture Organization of the United Nations, Paris, Rome. doi:10.1787/agr_o utlook-2018-en.
Ohlander, J., Fuhrimann, S., Basinas, I., Cherrie, J.W., Galea, K.S., Povey, A., Martie, van, T., Harding, A.-H., Jones, K., Vermeulen, R., Kromhout, H., 2019. A systematic review of methods used to assess exposure to pesticides in occupational epidemiology studies, 1993–2017. Occup. Environ. Med. 77, 357–367. https://doi.
org/10.1136/oemed-2019-105880.
Potrebi´c, O., Jovi´c-Stoˇsi´c, J., Vuˇcini´c, S., Tadi´c, J., Radulac, M., 2009. Acute glyphosate- surfactant poisoning with neurological sequels and fatal outcome. Vojnosanit. Pregl.
66, 758–762.
Reed, J.C., Reed, H.B.C., 1997. The Halstead—Reitan Neuropsychological Battery.
Contemporary Approaches to Neuropsychological Assessment. Springer, Bosten.
Rohlman, D.S. chertle., Ismail, A.A., Abdel-Rasoul, G., Lasarev, M., Hendy, O., Olson, J.
R., 2014. Characterizing exposures and neurobehavioral performance in Egyptian adolescent pesticide applicators. Metab. Brain Dis. 29, 845–855. doi:10.100 7/s11011-014-9565-9.
Rohlman, D.S., Ismail, A.A., Rasoul, G.A., Bonner, M.R., Hendy, O., Mara, K., Wang, K., Olson, J.R., 2016. A 10-month prospective study of organophosphorus pesticide exposure and neurobehavioral performance among adolescents in Egypt. Cortex 74, 383–395. https://doi.org/10.1016/j.cortex.2015.09.011.
Rold´an-Tapia, L., Parr´on, T., S´anchez-Santed, F., 2005. Neuropsychological effects of long-term exposure to organophosphate pesticides. Neurotoxicol. Teratol. 27, 259–266. https://doi.org/10.1016/j.ntt.2004.12.002.
Rothlein, J., Rohlman, D., Lasarev, M., Phillips, J., Muniz, J., McCauley, L.A., 2006.
Organophosphate pesticide exposure and neurobehavioral performance in agricultural and nonagricultural Hispanic workers. Environ. Health Perspect. 114, 691–696. https://doi.org/10.1289/ehp.8182.
Schreinemachers, P., Chen, H. pu, Nguyen, T.T.L., Buntong, B., Bouapao, L., Gautam, S., Le, N.T., Pinn, T., Vilaysone, P., Srinivasan, R., 2017. Too much to handle? Pesticide dependence of smallholder vegetable farmers in Southeast Asia. Sci. Total Environ.
593–594, 470–477. doi:10.1016/j.scitotenv.2017.03.181.
Scott, J.G., Berger, J.O., 2010. Bayes and eMIPrical-Bayes multiplicity adjustment in the variable-selection problem. Ann. Stat. 38, 2587–2619. https://doi.org/10.1214/10- AOS792.
Starks, S.E., Gerr, F., Kamel, F., Lynch, C.F., Jones, M.P., Alavanja, M.C., Sandler, D.P., Hoppin, J.A., 2012. Neurobehavioral function and organophosphate insecticide use among pesticide applicators in the Agricultural Health Study. Neurotoxicol. Teratol.
34, 168–176. https://doi.org/10.1016/j.ntt.2011.08.014.
Staudacher, P., Fuhrimann, S., Farnham, A., Mora, A.M., Atuhaire, A., Niwagaba, C., Stamm, C., Eggen, R.I.L., Winkler, M.S., 2020. Comparative analysis of pesticide use determinants among smallholder farmers from Costa Rica and Uganda. Environ.
Health Insights 14, 1–15. https://doi.org/10.1177/1178630220972417.
Steel, M.F.J., 2020. Model averaging and its use in economics. J. Econ. Lit. 58, 644–719.
https://doi.org/10.1257/JEL.20191385.
Strauss, E., Sherman, E.M.S., Spreen, O., 2006. A compendium of neuropsychological tests: administration, norms, and commentary, third ed. Oxford University Press.
van Wendel de Joode, B., Mora, A.M., Lindh, C.H., Hern´andez-Bonilla, D., Cordoba, L., ´ Wesseling, C., Hoppin, J.A., Mergler, D., 2016. Pesticide exposure and
neurodevelopment in children aged 6–9 years from Talamanca, Costa Rica. Cortex 85, 137–150. doi:10.1016/j.cortex.2016.09.003.
van Wendel de Joode, B., Wesseling, C., Kromhout, H., Monge, P., García, M., Mergler, D., 2001. Chronic nervous-system effects of long-term occupational exposure to DDT. Lancet 357, 1014–1016.
Vandenberg, L.N., Blumberg, B., Antoniou, M.N., Benbrook, C.M., Carroll, L., Colborn, T., Everett, L.G., Hansen, M., Landrigan, P.J., Lanphear, B.P., Mesnage, R., vom Saal, F.
S., Welshons, W.V., Myers, J.P., 2017. Is it time to reassess current safety standards for glyphosate-based herbicides? J. Epidemiol. Community Health 71, 613–618.
https://doi.org/10.1136/jech-2016-208463.
Viel, J.F., Warembourg, C., Le Maner-Idrissi, G., Lacroix, A., Limon, G., Rouget, F., Monfort, C., Durand, G., Cordier, S., Chevrier, C., 2015. Pyrethroid insecticide exposure and cognitive developmental disabilities in children: the PELAGIE mother- child cohort. Environ. Int. 82, 69–75. https://doi.org/10.1016/j.
envint.2015.05.009.
Von Ehrenstein, O.S., Ling, C., Cui, X., Cockburn, M., Park, A.S., Yu, F., Wu, J., Ritz, B., 2019. Prenatal and infant exposure to ambient pesticides and autism spectrum disorder in children: population based case-control study. BMJ 364. https://doi.org/
10.1136/bmj.l962.
Wang, G., Fan, X.N., Tan, Y.Y., Cheng, Q., Chen, S. Di, 2011. Parkinsonism after chronic occupational exposure to glyphosate. Park. Relat. Disord. 17, 486–487. https://doi.
org/10.1016/j.parkreldis.2011.02.003.
Wechsler, D., 1981. WAIS-R manual: Wechsler adult intelligence scale-revised.
Psychological Corporation, San Antonio.
Wesseling, C., Aragon, A., Rojas, M., Blanco, L., L´ ´opez, L., Soto, A., Fúnez, A., Ruepert, C., Miranda, J., L´opez, I., 2006. Efectos del clorpirifos en la salud de trabajadores bananeros de La Lima. Honduras. Ser. Salud Trab. y Ambient. 1, 1–56.
Winkler, M.S., Atuhaire, A., Fuhrimann, S., Oltramare, C., Ruepert, C., Weiss, F., Wiedemann, R., Eggen, R., Ingold, K., Stamm, C., 2019. Working paper:
Environmental exposures, health effects and institutional determinants of pesticide use in two tropical settings. Swiss Network for International Studies (SNIS), Basel.