Twista — An Application for the Analysis and Visualization of Tailored Tweet Collections
Sebastian Spanner, Manuel Burghardt, Christian Wolff
Media Informatics Group, University of Regensburg sebastian.spanner@stud.uni-regensburg.de, {manuel.burghardt, christian.wolff}@ur.de
Abstract
Social media services like Twitter churn out user-generated content in vast amounts. The massive availability of this kind of data demands new forms of analysis and visualization, to make it accessible and interpretable. In this ar- ticle, we introduce Twista, an application that can be used to create tailored tweet collections according to specific filter criteria, such as the occurrence of certain keywords or hashtags. Once the tweet collection has been created, Twista calculates basic statistics, e.g. the average tweet length or the most active user. Furthermore, the application can perform basic sentiment analy- sis, analyze tweets with regard to their date of publication, and analyze the communication between different Twitter users. The results of these analyses are visualized by means of the data driven documents toolkit (d3.js) and can be viewed directly in the browser, or are available for download in PDF and JSON format. We also present three exemplary use cases that illustrate the possible use of Twista for different scenarios.
Keywords: Twitter, Social media analysis, Big data, Information visualiza- tion
In: F.Pehar/C.Schlögl/C.Wolff (Eds.). Re:inventing Information Science in the Networked Society. Proceedings of the 14th International Symposium on Information Science (ISI2015),Zadar,Croatia,19th—21stMay 2015. Glückstadt:VerlagWerner Hülsbusch, pp. 191—202.
1 Introduction
The availability and size of big data that is churned out by social media plat- forms such as Facebook and Twitter calls for new forms of analysis. Ade- quate visualization is an important means to make big data accessible for analysis, as visual representations have specific advantages in comparison with e.g. written text (Larkin & Simon 1987, Mazza, 2009).
At the same time, the relevance of social media data, especially data from the microblogging service Twitter, is underlined by the fast growing number of studies in fields that include linguistics (cf. Gimpel et al., 2011), trend prediction (cf. Aramaki et al. 2011), sentiment analysis (cf. Pak & Paroubek, 2010), information extraction (cf. Tseng et al. 2012), human information be- havior (cf. Meier & Elsweiler, 2014), and media analytics (cf. Burghardt et al. 2013; Mielke & Wolff 2015). An overview of Twitter as an object of study is given by Rogers (2013) and Williams et al. (2013).
In this article, we introduce Twista, an application for the analysis and visualization of tailored tweet collections. In section 2, we give an overview of similar tools and illustrate the main design goals of our application. Sec- tion 3 describes the basic tool architecture and its main components. In sec- tion 4, we present three exemplary scenarios for the use of Twista. In the last section, we summarize the main ideas and give an outlook on future work.
2 Related work and Twista goals
One group of available tools, e.g. Twitter Counter1 and TweetStats2, is fo- cused on a user-centric analysis of Twitter activity, i.e. they give insights about the audience of a Twitter user (e.g. follower growth) and the interac- tions within this audience. Other tools such as Tworpus (Bazo et al. 2013) can be used to create tailored collections of tweets, but are lacking an analy- sis component. There are several tools for purposes that are more specific:
RT^2M is an example for a trend mining application for Twitter data (Song &
1 http://twittercounter.com/; Note: All URLs mentioned in this article were last visited on January 4, 2015
2 http://www.tweetstats.com/
Kim, 2013). Dörk et al. 2013 introduce a tool that can be used to visualize event-based Twitter data. Another branch of tools, e.g. TweetXplorer (Mor- statter et al., 2013) or Tweetdict (Dreer et al., 2014), focus on tweet analysis by means of their hashtags.
As most of the existing tools focus on one specific aspect, such as tweet crawling, or analysis with regard to users or hashtags, we provide an inte- grated tool that can be used to create filtered collections of tweets for a spe- cific topic, and analyze the tweets with regard to different kinds of informa- tion. Twista performs basic statistical analyses for the tweet contents and the authors of the tweets. Furthermore, authors of tweets are analyzed for their communication with each other. The tool also takes into consideration the tweet’s publication data and its sentiment. All these types of information are visualized in an easy-to-use web interface.
3 Tool architecture and main components
This section describes the basic architecture of the Twista application as well as its main components. In a nutshell: tweets are collected by a crawler du- ring a specified period, and are analyzed and visualized at the end of that period (cf. fig. 1). After the crawling and analysis phase, the user is informed via email. The user may then view the results directly in the browser, or download raw data and the analyses as JSON or PDF files.
Figure 1. Main components of Twista.
3.1 Crawler component
On Twitter, there are two main APIs (application programming interface) that can be used to collect tweet data: While the Streaming API provides access to Twitter’s global stream of tweets, the REST API3 can be used to
3 https://dev.twitter.com/rest/public/search
search for recent tweets that have been published within 6–9 days. Due to the limited time frame and the rate limitations of the REST API (limited number of requests per 15 minutes and only 100 returned tweets per request) we de- cided to implement a crawler that utilizes the Streaming API. All tweets that match predefined filter criteria are crawled in real time, i.e. at the moment when they are published. According to Twitter’s general rate limiting policy4, the number of tweets obtained by means of such filtered streams must not exceed 1% of the whole Twitter traffic, which is rather unlikely to happen unless the filter criteria are very generic.
Twista users may specify the selection criteria for the tweet collection by providing a number of keywords or hashtags. They may also choose to only collect tweets from specific user names or tweets in a specific language. Fi- nally, users will have to specify an end date for the crawler to stop collecting tweets. The crawler is executed on a node.js server5. The previously defined filter criteria for the tweet collection are transmitted to the Twitter server via a POST request. All collected tweets are stored on the node.js server in JSON format.
3.2 Analysis and visualization components
Twista collects different types of information for each tweet, which are briefly introduced in this section. More examples for the different types of information are presented in the use cases section.6 The client side visualiza- tions, which include bubble charts, word clouds, bar charts, and network graphs, were created with d3.js7, a library that can be used to manipulate and visualize “data-driven documents” (Bostock et al., 2011).
Frequencies and counts
First, the analyzer component counts the total number of tweets, the average tweet length, and the tweet with most retweets. As the application crawls tweets right at the time they are published, there are no retweet or favorite counts available for such newborn tweets. However, Twista identifies the
4 https://dev.twitter.com/faq/authentication-%26-rate-limiting 5 http://nodejs.org/
6 A demo video of Twista is available via http://youtu.be/aP_G8lCrZsw.
7 http://d3js.org/
tweet that was retweeted most frequently, as each retweet obtained via the Streaming API has a reference to the original tweet and its retweet count.
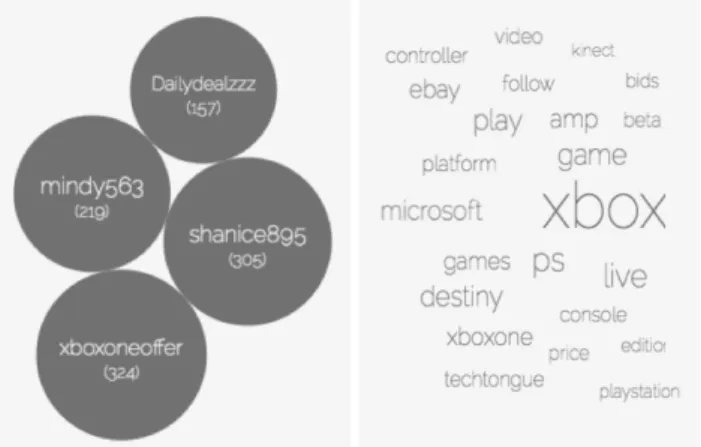
Twista also counts and visualizes the most frequent users (i.e. people who publish a tweet) as well as the most frequent clients (e.g. Twitter Web Client, Twitter for iPhone, Twitter for Android, TweetDeck, etc.) that are used to publish the tweet. On the content level, the tool also provides information about the most frequently used words, hashtags and frequently quoted URLs, i.e. links to external web resources. In order to visualize these frequencies, we chose a bubble chart layout (cf. fig. 2): larger bubbles indicate a higher frequency. In addition, the name and the numerical frequency are displayed in each bubble. For the most frequent words used in a tweet collection, we chose a word cloud layout, as the number of different words is very diverse, and would have resulted in a large number of bubbles. In addition, we filter out stop words8 for the most common function words from German, English and Spanish before we visualize the results.
Figure 2. Visualization of frequent user names (left side) and frequently used words (right side) for a collection of tweets that contain the keyword Xbox.
Time
All tweets obtained via the Streaming API contain a time stamp as well as a UTC (coordinated universal time) offset that can be used to derive the local time of the tweet creation. This can be used to sort tweets temporally or clas- sify them as daytime or nighttime tweets (cf. fig. 3).
8 https://github.com/huned/node-stopwords
Figure 3. Visualization of tweets according to different publication dates and according to publication during daytime or nighttime.
Reply networks
Twitter users can not only publish tweets to an anonymous timeline, but also explicitly communicate with other users by using the reply mechanism, which means to mention a user name within a tweet. Such reply communica- tions are very well suited for a network visualization (cf. fig. 4). In order to avoid a cluttered interface, we only view the top 30 of the most frequently mentioned users in other tweets. These are the depicted as larger bubbles, while the replying users are rendered as smaller nodes that are attached to the large bubble. Each specific user name can be viewed by hovering over a bubble or node.
Figure 4. Reply network visualization for tweets with the keyword Xbox.
Sentiment analysis
The sentiment analysis component examines if a tweet contains a positive, a neutral or a negative opinion. This is achieved by using a sentiment lexicon that contains words and associated sentiment scores. We decided to use the AFINN – 1119 lexicon, as it was developed specifically for social media lan-
9 http://www2.imm.dtu.dk/pubdb/views/publication_details.php?id=6010
guage, including typical expressions such as wtf, lol, rofl, etc. The lexicon has been evaluated (Nielsen, 2011) and currently comprises 2,477 words and phrases, with sentiment scores ranging from minus five to plus five. Twista calculates the sentiment score for each tweet and visualizes the results in a bar chart. AFINN – 111 is available for English language only, so Twista’s sentiment analysis is currently restricted to English tweets.
Note on geolocation information
Although the API provides information about the geolocation of a user, it is not considered in Twista. During several pretest sessions, we discovered that in most cases users have disabled the automatic geolocation detection, or deliberately provide fake location names.
4 Use cases
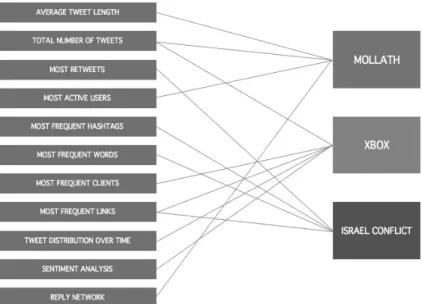
This section presents three exemplary scenarios for the use of Twista. The use cases were selected to ensure that all types of information provided by Twista are illustrated in a real world example (cf. fig. 5).
Figure 5. Types of information provided by Twista and their usage in three exemplary use cases.
4.1 Revision of the case “Mollath”10
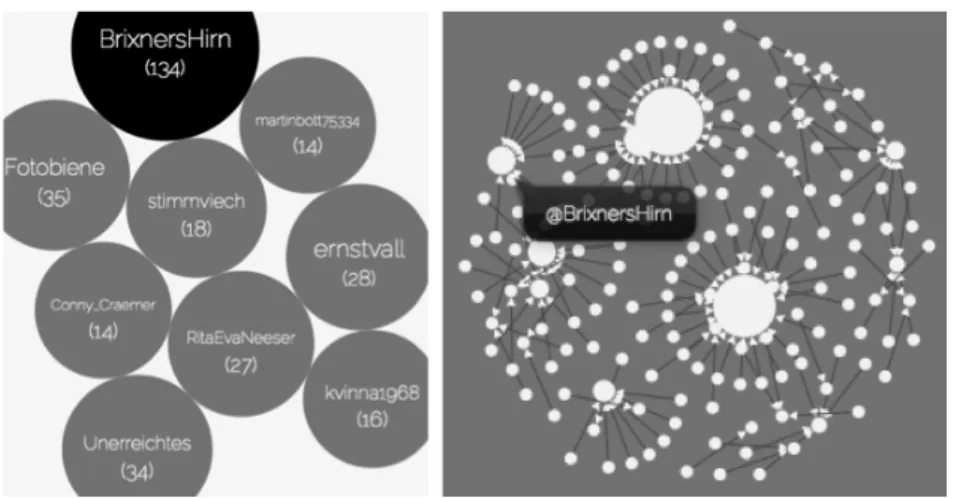
In the first use case we examine tweets that are concerned with the revision of the “Gustl Mollath” case11, trying to assess the general interest as well as the communication behavior of users that tweet about this topic. We col- lected 928 tweets that contain the keyword “mollath”. The crawler was active for four days, starting on July 11, 2014. The relatively small number of tweets indicates that the public interest in this case was rather low. An aver- age tweet length of 123 characters shows that users tend to formulate full sentences on the topic rather than just single keywords, which indicates that those, who tweet about the topic are rather dedicated to it. The analysis of the most frequent users reveals that about 15% of all tweets about the case “Mol- lath” are written by a single user (“BrixnersHirn”)12. Looking at the reply network, it becomes obvious that although user “BrixnersHirn” posts 134 tweets on this topic, the communication is quite unidirectional, i.e. only few other users reply to this user’s tweets (cf. fig. 6).
Figure 6. Most active users with tweets about “mollath” (left side) and reply network of those users (right side).
10 Analysis data and visualization for this example available at http://bit.ly/1BdyjXh 11 For more information on this case cf. the Wikipedia article on „Gustl Mollath“:
http://en.wikipedia.org/wiki/Gustl_Mollath.
12 Note: The user name itself appears to be a direct reference to Otto Brixner, one of the judges involved in the case.
4.2 Xbox customer support13
Microsoft uses Twitter as a basic way to communicate with customers of their game console Xbox by means of a company account with the user name
“XboxSupport”. Whenever customers post problems with their Xbox on Twitter, the “XboxSupport” account tries to provide an answer. In two days (July 20 and 21, 2014), a total of 42,225 tweets containing the term “xbox”
were collected by Twista, which proves that Twitter is indeed an important channel to capture user feedback on products such as the Xbox. The senti- ment analysis reveals that 32% of the tweets are positive, 52% are neutral, and 16% are negative. The company can use these numbers to get a quick overview about the users’ sentiment toward their product, and possibly dedi- cate more resources into the online customer support if the sentiment is ex- ceptionally negative. Taking a look at the most frequently tweeted links gives an impression of the main problem Xbox customers encounter: The most fre- quent link leads to an article that describes problems of the Xbox in combina- tion with the Kinect device.14 The use case also shows that tweets are pub- lished during both, daytime and nighttime, which implies that the Xbox sup- port team on Twitter should be available 24 hours a day, to be able to res- pond to user feedback immediately. Another interesting piece of information is concerned with the most frequently used Twitter clients, which indicates that 11,812 users tweet about their Xbox from an iPhone (vs. 4,958 Twitter for Android clients). This implies that an additional mobile app for customer support should primarily be optimized for iOS.
4.3 Israel conflict15
The last scenario is intended to demonstrate the use of Twista as a means to quickly gather key information about a certain topic that we may have heard on the news. We have chosen to create a collection of all German tweets that contain the keywords “Israel”, “Hamas” and “Gaza”. To get fast results, tweets were only crawled for four hours (July 27, 2014)16. Besides the filter
13 Analysis data and visualization for this example available at http://bit.ly/1xephsf 14 Tech-tongue.com: „Microsoft admits the Xbox One performs better without Kinect“,
available at http://t.co/0rysfsoi6t.
15 Analysis data and visualization for this example available at http://bit.ly/1yfsYPD 16 Note: At that time, the Israel conflict was a very prominent topic.
keywords, the word cloud shows many other informative words that are con- tained in the tweet collection (cf. fig. 7). Among those terms are also Twitter specific hashtags, such as “talibandivine”.
Figure 7. Word cloud: Most frequent terms that occur in tweets about “Israel”.
The tweet that was retweeted most frequently was published by German astronaut Alexander Gerst, who provided a picture during his space trip that shows numerous explosions in the Gaza region. The most frequently shared links can be used to find relevant web resources on the topic to gather further information on the conflict.
5 Summary and future directions
Currently, Twista can be installed on a local node.js server17. For the future, we are planning to provide Twista as a free web service that can be used without any installation at all. We also plan to implement an import feature that allows users to analyze and visualize existing tweet collections (in JSON format) with Twista. In general, Twitter research is still in its formative phase, establishing new types of analysis as well as new tweet analytics that can be useful for several purposes. Naturally, information visualization of social media data should not be constrained to Twitter. We are currently working on a concept for integrated social media analytics tools that merge results from various sources (blogging, microblogging, social media with visual content) into a configurable social media dashboard (cf. Few 2013).
17 If you are interested in trying out Twista as a local application please contact the au- thors via email.
References
Aramaki, E., Maskawa, S., & Morita, M. (2011). Twitter catches the flu: detecting influenza epidemics using Twitter. In Proceedings of the 11th Conference on Em- pirical Methods in Natural Language Processing, pp. 1568–1576.
Bazo, A., Burghardt, M., & Wolff, C. (2013). TWORPUS – An Easy-to-Use Tool for the Creation of Tailored Twitter Corpora. In Proceedings of the 25th Confe- rence of the German Society for Computational Linguistics, pp. 23–34.
Bostock, M., Ogievetsky, V., & Heer, J. (2011). D3; Data-Driven Documents. IEEE Transactions on Visualization and Computer Graphics, 17 (12), 2301–2309.
Burghardt, M., Karsten, H., Pflamminger, M., & Wolff., C. (2013). Twitter als inter- aktive Erweiterung des Mediums Fernsehen: Inhaltliche Analyse von Tatort- Tweets. In Workshop Proceedings of the 25th Conference of the German Society for Computational Linguistics (GSCL 2013).
Dörk, M., Gruen, D., Williamson, C., & Carpendale, S. (2010). A visual backchannel for large-scale events. IEEE Transactions on Visualization and Computer Gra- phics, 16 (6), 1129–1138.
Dreer, F., Saller, E., Elsässer, P. & Zhekova, D. (2014). Tweetdict: Identification of Topically Related Twitter Hashtags. In Workshop Proceedings of the 12th Kon- vens, pp. 53–57.
Few, S. (2013). Information dashboard design: Displaying data for at-a-glance monitoring. Burlingame: Analytics Press.
Gimpel, K., et al. (2011). Part-of-speech tagging for Twitter: annotation, features, and experiments. In Proceedings of the 49th Annual Meeting of the Association for Computational Linguistics: Human Language Technologies, pp. 42–47.
Larkin, J. H., & Simon, H. A. (1987). Why a diagram is (sometimes) worth ten thou- sand words. Cognitive science, 11 (1), 65–100.
Mazza, R. (2009). Introduction to information visualization. London: Springer.
Meier, F., & Elsweiler, D. (2014). Personal information management and social net- works re-finding on Twitter. In Proceedings of the 5th Information Interaction in Context Symposium, pp. 339–341.
Mielke, B., & Wolff, C. (2015). Justiz und digitale Öffentlichkeit: Aufbau und Ana- lyse eines Twittercorpus zum Thema Justiz. In Proceedings of the 18th Inter- national Legal Informatics Symposium – IRIS 2015, Salzburg. Wien: ÖCG, pp.
281–290.
Morstatter, F., Kumar, S., Liu, H., & Maciejewski, R. (2013). Understanding Twitter data with TweetXplorer. In Proceedings of the 19th ACM SIGKDD International
Conference on Knowledge Discovery and Data Mining – KDD’13. New York:
ACM Press, pp. 1482–1485
Nielsen, F. Å. (2011). A new ANEW: Evaluation of a word list for sentiment analy- sis in microblogs. In Proceedings of the ESWC 2011 Workshop on ‘Making Sense of Microposts’, pp. 93–98.
Pak, A., & Paroubek, P. (2010). Twitter as a Corpus for Sentiment Analysis and Opinion Mining. In Proceedings of the 7th LREC conference, pp. 1320–1326.
Rogers, R. (2013). Debanalizing Twitter: The transformation of an object of study.
In Proc. 5th Annual ACM Web Science Conference, pp. 356–365.
Song, M., & Kim, M. C. (2013). RT^2M: Real-Time Twitter Trend Mining System.
In Proceedings IEEE of the International Conference on Social Intelligence and Technology, pp. 64–71.
Tseng, C.-Y., Chen, Y.-J., & Chen, M.-S. (2012). SocFeedViewer: A Novel Visuali- zation Technique for Social News Feeds Summarization on Social Network Ser- vices. In Proceedings of the IEEE 19th International Conference on Web Ser- vices, pp. 616–617.
Williams, S. A., Terras, M. M., & Warwick, C. (2013). What do people study when they study Twitter? Classifying Twitter related academic papers. Journal of Documentation, 69 (3), 384–410.