www.nat-hazards-earth-syst-sci.net/16/2391/2016/
doi:10.5194/nhess-16-2391-2016
© Author(s) 2016. CC Attribution 3.0 License.
An analysis of uncertainties and skill in forecasts of winter storm losses
Tobias Pardowitz1,2, Robert Osinski3, Tim Kruschke4, and Uwe Ulbrich2
1Hans Ertel Centre for Weather Research, Optimal Use of Weather Forecast Branch, Berlin, Germany
2Freie Universität Berlin, Institute of Meteorology, Carl-Heinrich-Becker Weg 6–10, 12165 Berlin, Germany
3CNRM UMR 3589, Météo-France/CNRS, 42 avenue Gustave Coriolis, 31057 Toulouse, France
4GEOMAR Helmholtz Centre for Ocean Research Kiel, Düsternbrooker Weg 20, 24105 Kiel, Germany Correspondence to:Tobias Pardowitz (tobias.pardowitz@met.fu-berlin.de)
Received: 19 May 2016 – Published in Nat. Hazards Earth Syst. Sci. Discuss.: 5 July 2016 Revised: 14 October 2016 – Accepted: 17 October 2016 – Published: 21 November 2016
Abstract.This paper describes an approach to derive prob- abilistic predictions of local winter storm damage occur- rences from a global medium-range ensemble prediction sys- tem (EPS). Predictions of storm damage occurrences are sub- ject to large uncertainty due to meteorological forecast un- certainty (typically addressed by means of ensemble predic- tions) and uncertainties in modelling weather impacts. The latter uncertainty arises from the fact that local vulnerabili- ties are not known in sufficient detail to allow for a determin- istic prediction of damages, even if the forecasted gust wind speed contains no uncertainty. Thus, to estimate the damage model uncertainty, a statistical model based on logistic re- gression analysis is employed, relating meteorological anal- yses to historical damage records. A quantification of the two individual contributions (meteorological and damage model uncertainty) to the total forecast uncertainty is achieved by neglecting individual uncertainty sources and analysing re- sulting predictions. Results show an increase in forecast skill measured by means of a reduced Brier score if both meteo- rological and damage model uncertainties are taken into ac- count. It is demonstrated that skilful predictions on district level (dividing the area of Germany into 439 administrative districts) are possible on lead times of several days. Skill is increased through the application of a proper ensemble cali- bration method, extending the range of lead times for which skilful damage predictions can be made.
1 Introduction
Severe weather events, and in particular severe winter storm events, cause a major share of economic losses due to natu- ral disasters in Europe and in Germany (Munich Re; 2007, 2012, 2013) and regularly cause a number of human fatali- ties. To prevent human fatalities and reduce property losses caused by natural disasters, national and regional civil pro- tection agencies need to be supported by effective weather warning systems. Within the Sendai Framework For Disas- ter Risk Reduction (UNISDR, 2015), it has been stated that for an effective disaster risk reduction an understanding of natural risks and their impacts is needed. This includes all aspects of disasters, such as vulnerability, capacity and expo- sure. With such understanding, and if possible, the ability to model the impacts of severe weather events, improved warn- ing systems could be designed, supporting decision-making processes for civil protection agencies.
The modelling of winter storm damages in Germany has been carried out in a number of recent studies, including both deterministic approaches (Klawa and Ulbrich, 2003; Heneka and Ruck, 2008; Donat et al., 2011) as well as probabilistic approaches (Heneka and Hofherr, 2010; Prahl et al., 2012).
These storm damage models provide means to translate ob- served or modelled gust wind speeds into local damage or loss ratios (i.e. losses normalized with the local sum of in- sured values). Depending on data availability, these models include a regionally specific parameter estimation to describe differences in local vulnerabilities resulting from local dif- ferences in building characteristics (compare e.g. Donat et al., 2011), for example. Rather than aiming at a quantita-
tive model for predictions of loss ratios, here we employ a simple logistic regression model, aiming at the prediction of exceedance probabilities for defined loss thresholds. This model is similar to the first modelling step of the damage model described in Prahl et al. (2012).
In giving an estimate of the inherent uncertainty in the re- lationship between the maximum wind gust and damage, the statistical model uncertainties arising in the damage mod- elling step can be quantified. The second major source of uncertainty in storm impact predictions arises from mete- orological forecast uncertainties. The latter uncertainty is commonly addressed by means of ensemble prediction sys- tems (Palmer, 2000; Leutbecher and Palmer, 2008; Slingo and Palmer, 2011), which is why we base our study on the medium range ensemble prediction system operationally run at the European Centre for Medium-Range Weather Fore- casts (ECMWF; Palmer et al., 2007).
Our approach thus allows us to address and quantita- tively compare the two main uncertainties arising in the mod- elling chain: meteorological forecast uncertainty and damage model uncertainty. In particular, we study the effect of ne- glecting uncertainty information, as is commonly done when interpreting the ensemble mean of a forecast ensemble or ap- plying a simple deterministic damage model neglecting the respective uncertainty.
The aim of this paper is to demonstrate the benefit of a fully probabilistic approach when predicting storm damages, which can form the basis for the design of risk-based warning tools. We furthermore aim at demonstrating the benefit (in terms of forecast skill) of an explicit and full treatment of the involved uncertainties within the modelling chain.
We structured the paper as follows. Section 2 describes the utilized data sources. The methodology, particularly the full modelling chain, is described in Sect. 3, including the ver- ification methodology applied. Verification results are pre- sented in Sect. 4, followed by discussion and conclusion in Sect. 5.
2 Data
2.1 Insurance loss data
Insurance data on losses to residential buildings were pro- vided by the German insurance association, Gesamtverband der Deutschen Versicherungswirtschaft e.V. (GDV). These comprise of daily data on administrative district level, with areas ranging from about 40 km2 for urban municipalities (“Kreisfreie Städte”) to about 3000 km2 for rural districts (“Landkreise”). In contrast to pointwise measurements from meteorological stations, the available insurance data repre- sent records with an area-wide coverage of windstorm and thunderstorm losses making it most valuable for various weather impact studies. The data however contain some lim- itations and uncertainties that need to be kept in mind. Un-
certainties in daily losses arise from the fact that the ex- act time of loss occurrence is indistinct in some cases, es- pecially if an event has occurred at night. Furthermore, the area representativeness implies a dependence of losses on the local building stocks, which needs to be taken into ac- count. To gain data comparable amongst districts it is thus necessary to consider relative values, i.e. losses standard- ized by the total amount of insured values (insured sum), in the specific district. Commonly used by insurers is the term loss ratio which denotes the loss (in EUR) divided by the insured sum (in thousand EUR), which is thus speci- fied in ‰ (=EUR 1/EUR 1000). Besides ensuring spatial ho- mogenization, the consideration of relative losses removes temporal inhomogeneities resulting from the growth of val- ues or inflation, for example. On the district level, the GDV recorded losses on residential buildings arising from storm and hail events (covered by the “Verbundene Wohngebäude Versicherung”, VGV) for the period 1997–2011. Here we consider the winter half year only (October through March).
For these months, damages are almost exclusively caused by windstorms. However, in a few cases damages are due to hail, which might take place in the vicinity of a storm’s cold front (e.g. hail was observed in the case of Kyrill; compare Fink et al., 2009). Since these hail-induced damages cannot be systematically separated in our analysis, another uncertainty that needs to be reflected in the (probabilistic) relationship between local wind gusts and resulting damages is posed.
2.2 COSMO-EU analyses
For training of the probabilistic storm damage model, analy- ses from the operational assimilation cycle for the COSMO- EU model (Schulz and Schättler, 2014) are employed. As a specific configuration of the non-hydrostatic COSMO- Model (Rockel et al., 2008; Doms, 2011), COSMO-EU is operationally run at German Weather Service (DWD) cov- ering the European domain in a resolution of 7 km, us- ing 40 vertical levels with the lowest level 10 m above the ground. Forecasts are operationally initialized every 6 h (00:00, 06:00, 12:00 and 18:00 UTC) and performed for up to 78 h. The COSMO-EU assimilation scheme (based on a nudging methodology) is performed every 3 h (00:00, 03:00, 06:00, . . . , 21:00 UTC) and analysis files are written every hour. Here we use hourly 10 m wind gusts, which are ex- tracted for each hour from the latest available analysis run.
These are finally used to calculate daily maximum 10 m wind gusts. The COSMO-EU analyses are available for the pe- riod 2006–2011.
2.3 ECMWF-EPS forecasts
ECMWF has operationally run its Ensemble Prediction System (EPS) since 1992 (Molteni et al., 1996). This system is based on the same numerical weather predic- tion (NWP) model that is used for the deterministic weather
forecast, the Integrated Forecasting System (IFS). How- ever, in ensemble prediction mode it is employed with a coarser vertical and horizontal resolution. The latter has been successively increased from an initial resolution of TL63 (∼200 km) to TL159 (∼120 km; changed in De- cember 1996), TL255 (∼80 km; November 2000), TL399 (∼50 km; February 2006) and finally to the current reso- lution of TL639 (∼32 km; since January 2010). To gener- ate the ensemble the method of singular vectors (Palmer et al., 1998; Leutbecher and Palmer, 2008) is used to perturb the initial conditions. Initially 32 ensemble members were produced. In December 1996 this number was increased to 50 members. One additional control forecast is calculated us- ing the same (unperturbed) initial conditions as the determin- istic run, but employing the coarser resolution of the EPS.
Additionally, stochastic perturbations of the model physics were introduced in October 1998 (Buizza et al., 1999; Palmer et al., 2009).
For the current study we use the 6-hourly output of in- stantaneous 10 m wind speed of the 50 perturbed ensemble members operationally produced between November 2000 and January 2010 (inTL255 andTL399 resolution) as input for a statistical downscaling. Each forecast is integrated over 15 days, but the horizontal resolution is reduced after forecast day 10. We thus confine all further processing and analyses to the first 10 forecast days of constant resolution throughout the respective integration.
According to the data availability, the different modelling steps described in the following chapter are performed for different time periods. The statistical downscaling (compare Sect. 3.1) is developed on the basis of a set of 181 simulations for individual storm events during the period 1959–2010.
The ensemble post-processing (compare Sect. 3.2) is per- formed for the years 2006–2009, for which both COSMO- EU analyses and ECMWF-forecasts are available. The train- ing of the probabilistic damage model (compare Sect. 3.3) is performed for the years 2006–2011, for which both damage data and COSMO-EU analyses are available. Assessment of forecast skill is done for the period 2001–2009, for which ECMWF-forecasts and damage data are available.
3 Methodology
3.1 Statistical downscaling of the ECMWF-EPS Within the COSMO-EU domain, the global ECMWF-EPS forecasts were statistically downscaled to the fine COSMO- EU resolution of approx. 7 km, following the approach devel- oped by Kruschke (2015). The basic concept of this down- scaling procedure is a multiple linear regression approach quantifying the relationship of fine-scale surface gusts to the coarse scale (instantaneous) surface winds given by the re- spective ECMWF-EPS forecast. For each COSMO-EU grid- box (436 905 in total) an individual statistical model, i.e. a
regression equation, is established. This is done by objec- tively choosing skilful predictors from a given set of potential predictors. Essentially, these potential predictors are the EPS surface-wind components and wind magnitudes scaled by the respective climatological 98th percentile (to achieve ho- mogenisation with respect to orographic effects) and subse- quently interpolated (first-order conservative) to the coarser of the analysed EPS resolutions, that isTL159. More specif- ically, for each individual COSMO-EU grid box the scaled and interpolated instantaneous 6-hourly surface wind com- ponents and magnitudes at EPS grid boxes within a radius of 300 km (calculated between respective COSMO-EU and EPS grid box centres), as well as the squared values of these parameters, are used to predict 6-hourly (temporal window centred over timestep of instantaneous predictors) maximum 10 m wind gusts at the respective COSMO-EU grid box.
Scaling and interpolation are done to reduce inhomogeneities potentially originating from employing two different genera- tions of the EPS. The objective selection of skilful predictors is done by applying a stepwise linear regression algorithm with forward selection and backward elimination. Starting with an empty statistical model – during the forward selec- tion – all potential predictors are tested whether they pro- vide significant benefit (p <5 % according tof test regard- ing residual sum of squares) to the model. The best predictor is chosen to enter the model. Subsequently, all remaining pre- dictors are tested equivalently whether they can significantly improve the model. This is done repeatedly until no more predictors yield significant additional value for the statistical model. Finally, the backward elimination conversely checks whether predictors can be removed again without signifi- cantly decreasing the statistical model’s quality (p <10 %).
The training of this statistical downscaling procedure and its evaluation (by three-fold cross-validation and several MSE-related metrics) is based on dynamical regionalization of 181 European winter storm episodes that was done by employing the numerical weather prediction model chain (global model GME and regional model COSMO-EU) of the German Weather Service (DWD). A comprehensive descrip- tion of this statistical downscaling approach, as well as its development and evaluation is given by Kruschke (2015).
This includes testing various other combinations of poten- tial predictors and demonstrating that this approach outper- forms (measured with respect to the mean squared error of wind gusts) a similar approach described by Haas and Pinto (2012), which is also based on multiple linear regres- sions. Kruschke (2015) additionally provided an effective quantification of uncertainties of the statistically modelled gusts. However, these uncertainty estimates are not used in the course of the current study.
3.2 Ensemble post processing
The benefits from using ensemble prediction systems instead of single deterministic forecasts is the possibility to estimate
the forecast uncertainty, which can differ for each meteo- rological situation. In practice, ensembles often systemati- cally under- or overestimate this uncertainty, which is re- ferred to as an under- or overdispersion. At the ECMWF, the method of singular vectors is used to generate a set of initial conditions that are used to calculate several members of a forecast ensemble with the intention to produce an op- timal spread. It should be noted, that the ECMWF-EPS has been constructed so that its spread is optimized for medium- range forecasts, thus for forecasts of 3–5 days. Despite of such sophisticated techniques for the perturbations, ensemble forecasts still often tend to be under-dispersive. This means, that the spread of the ensemble members (the members be- ing discrete random draws of the forecasted probability den- sity function) may be too small and it may not reflect the full uncertainty inherent to the forecast. “Calibrating” the en- semble spread, which is part of sophisticated post-processing techniques, can thus help address such underdispersion of ensemble forecasts (see Bröcker and Smith, 2008). Several methods exist to calibrate a forecast ensemble, partly de- pending on the ensemble type (single-model, multi-model or lagged-averaged-forecasts). An overview of calibration tech- niques for medium-range forecasts can be found in Gneit- ing (2014). For this study, we apply the approach of Bröcker and Smith (2008). This method states a so-called ensemble dressing approach, whose purpose is to estimate the prob- ability density function (PDF) of the ensemble, and can be used to adjust the spread. The chosen method has the ad- vantage that it can represent different methods of ensemble dressing depending on the selected parameter set. It trans- forms the discrete members (50 in our case) to a continuous distribution function by combing kernel functions for each individual member. The ECMWF-EPS is a single-model en- semble and all of the members are indistinguishable. For this reason, all members are dressed by using the same Gaussian kernel. However, ensemble post processing is performed for each grid cell separately. Aside from depending on the spe- cific forecast situation, the actual size of the Gaussian kernel is thus determined individually for each grid cell. The dress- ing is done using an affine ensemble transformed version of the original data (Bröcker and Smith, 2008). While the dress- ing is used to transform the discrete members to a distribu- tion function, the affine transformation is used to eliminate biases from the raw forecasts. Parameters for the transforma- tion as well as for the Gaussian kernel are estimated using the minimization of the continuously ranked probability score (CRPS; compare Gneiting and Raftery, 2007). The CRPS is a measure that describes the performance of an ensemble in its entity by comparing the forecast and observation cumulative distribution functions (CDFs).
In general, the aim of the method is the estimation of the entire PDF of forecasts, based on the 50 ensemble members.
However, in our case, we are interested in deriving a cor- rected 50-member forecast ensemble, which is representative of this full PDF. This can simply be accomplished by ran-
domly sampling the 50 members from the calibrated PDF.
However, the calibration should not be interpreted for these individual members, since the method is designed to cali- brate the ensemble properties (such as ensemble bias and dis- persion) rather than the individual members’ properties.
3.3 Probabilistic storm loss model
In the last step, the forecasts of near-surface maximum gusts are translated into probabilistic estimates for the exceedance of specified loss ratio thresholds (“damage occurrences”).
Due to insufficient information about meteorological condi- tions on sub-grid scales (e.g. turbulent gusts induced through localized orographic features), as well as lack of knowl- edge on individual building characteristics, it is impossible to model damage occurrences on individual entity level in a deterministic manner. Instead, a statistical relation, valid for the total stock of buildings within a district, is derived, which shall enable the specification of probability estimates to express these uncertainties. To do so, logistic regression analysis is performed for each district. Damage occurrences, defined as the exceedance of loss ratio above a certain thresh- old, are derived from the observed loss ratio time series. The resulting time series are then related to daily maxima of near- surface wind gusts from the COSMO-EU analyses to train the logistic regression curve. For each district, wind gusts at the closest grid point from the centre of the district are used.
3.4 Probabilistic forecasts of damage occurrences To be able to investigate the influence of the individual un- certainty sources (meteorological forecast uncertainty and damage modelling uncertainty) different probability fore- casts are set up. Specifically, four different setups result from (i) treating no uncertainty resulting in deterministic fore- casts, (ii) treating only meteorological forecast uncertain- ties, (iii) treating only damage-modelling uncertainty and iv) treating both uncertainty sources.
The derivation of probability forecasts for damage occur- rences is straightforward in the case of individual (single) member forecasts, which is done simply by applying the logistic regression function (described in Sect. 3.3) to cal- culate a probability estimate for the given forecasted wind gust. Similarly, the logistic regression function can be ap- plied to the ensemble mean. Resulting probability estimates include damage-modelling uncertainty, while neglecting me- teorological uncertainties (setup iii). Additionally, meteoro- logical forecast uncertainty information is taken into account by applying the transfer function to each ensemble member.
Assuming the members to be equally likely, probability fore- casts can then be calculated as the ensemble mean of the damage-occurrence probabilities derived for the individual ensemble member forecasts (setup iv). Similar to neglecting meteorological forecast uncertainties, the statistical uncer- tainty from the damage-modelling step can be neglected by
assuming a stepwise function instead of the logistic regres- sion curve (compare Fig. 1, top panel). This is done by as- suming a probability of one in case the forecasted gust wind speed exceeds a critical threshold and a probability of zero otherwise. Though not restricted to this choice, we choose this critical threshold to correspond to the gust wind speed for which the probability from the logistic regression analy- sis is 0.5. No treatment of uncertainty is accomplished when applying this “deterministic” damage occurrence function to the ensemble mean forecast (setup i). Finally, probability forecasts can be generated by applying the “deterministic”
damage occurrence function to individual ensemble member forecasts. Probability estimates are then again calculated by averaging over the resulting individual member probability (setup ii). Since this is either one or zero in the deterministic case, this is similar to the fraction of members exceeding the critical threshold for the gust wind speed.
3.5 Verification methodology
The statistically downscaled wind gust ensemble forecasts are investigated on grid-point basis by means of Talagrand di- agrams (see e.g. Jolliffe and Stephenson, 2003; Wilks, 2011).
A Talagrand (or rank) histogram can be used to illustrate model biases as well as an under- or overdispersion of the ensemble. To construct the Talagrand diagram, the ensemble members are ordered according to their rank for each time step and for each grid cell in ascending order. The frequency of observations falling in between these ranked ensemble members is counted. In a perfect ensemble, each rank would be equally populated, meaning that each ensemble member is equally likely. An asymmetry shows a bias, as too often the ranks of the weakest or the strongest members are pop- ulated. If the Talagrand diagram has au-shape, the ensem- ble is under-dispersive. This means that the observations are often outside the range spanned by the ensemble. In other words, the ensemble does not cover the entire range of un- certainty. In the opposite case of an over-dispersive ensem- ble, intermediate ranks of the Talagrand diagram would be overpopulated. This means that observations often lie close to the ensemble median, indicating an overestimation of the involved uncertainty.
Forecast quality of derived daily probability estimates for damages on district level are assessed by means of the Brier score (Wilks, 2011), which is the mean quadratic error of the probability forecast
BS= 1 Nt
X
t
(ft−ot)2, (1)
whereft is the forecasted probability at timet andot is the observation, being either one if an event has occurred or zero otherwise. Forecast skill is evaluated with respect to a refer- ence forecast, leading to the Brier skill score
Figure 1.Illustration of the methodology to derive probabilistic impact prediction from ensemble-forecasted gust wind speed. Top panel: probabilistic storm damage function – logistic regression curve – relating the forecasted gust wind speed to a probability of damage occurrence. The dashed line indicates the deterministic ver- sion of such a damage function being zero below the critical thresh- old for gust winds and one above it respectively. Bottom panel: il- lustration of gust winds forecasted by a 10-member ensemble in solid lines. Dashed line indicates the ensemble mean.
BSS=1− BS BSref
, (2)
with BSrefbeing the Brier score of the reference forecast. In the course of this study we use the climatological forecast, i.e. the climatological event frequency as reference. Sepa- rately for each district, Brier scores and Brier skill scores are evaluated. To summarize the verification statistics, Brier score and Brier skill score are evaluated additionally based on all forecast times and allNddistricts.
BStot= 1 Nd
1 Nt
X
d
X
t
ft,d−ot,d2
, (3)
whereft,dis the forecasted probability at timet in districtd andot,dis the corresponding observation. It should be noted that districts are equally weighted in Eq. (3), disregarding differences in size. It might be argued, that this leads to an overweighting of small districts, e.g. urban municipalities.
However, in our study we omitted such weighting since typ- ically the sum of insured values is higher in these urban mu- nicipalities, justifying such higher weighting.
Confidence intervals on derived Brier scores are calcu- lated by means of a bootstrap method, randomly generating 10 000 BStot values. This sampling is accomplished by ran- domly drawingNd·Nt times from the original set of indi- vidual contributions (ft,d−ot,d)2to the total Brier score in Eq. (3). Confidence intervals on BStotare then calculated as
Figure 2.Left panel: Talagrand diagram of statistically downscaled EPS forecasts, lead time 1 day (red), 5 days (green) and 9 days (blue) from January 2006 to January 2010. Right panel: Talagrand diagram of statistically downscaled and post-processed EPS forecasts, lead times 1, 5 and 9, from January 2006 to January 2010.
the 5 and 95 % quantiles of the 10 000 randomly generated BStotvalues. Differences in the Brier skill score are consid- ered significant if the derived 90 % confidence intervals are exceeded.
To assess the reliability of probabilistic forecasts, reliabil- ity diagrams – relating forecasted probabilities to observed event frequencies – are employed. In case of a perfectly re- liable forecast, an event should be expected in X% of the situations in which the forecast wasX%. Of course, devia- tions from this behaviour can occur, e.g. in case of an over- or under-forecasting the observed relative event frequencies are systematically lower or higher than forecasted. Details on reliability diagrams can be found in Wilks (2011).
To address “false alarms” and “missed events” in the case of probabilistic forecasts, ROC (relative operating char- acteristics) curves are considered. In case of the deter- ministic forecasts (no uncertainty treatment), the hit rate H=100 %·hits/(hits+misses) as well as the false alarm rate FAR=100 %·false alarms/(false alarms+correct re- jects) can be directly calculated from the contingency table.
In case of probability forecasts, a threshold needs to be cho- sen to translate them into a deterministic forecast to be able to calculate FAR andH. This threshold can be freely cho- sen and strongly influences FAR andH. Naturally, trying to reduce the FAR will also reduceH and vice versa. The opti- mal choice for the probability threshold (and resulting FAR and H) is user specific and can be determined through an assessment of the economic value, taking into account the user’s cost/loss ratio (Mylne, 2002). Insight into this relation can be gained by assessing the ROC curves, which relate the false alarm rate (FAR) to the hit rate (H), depending on the probability threshold chosen. See Wilks (2011) for details on ROC curves.
4 Results
4.1 Verification of severe wind-gust predictions based on statistically downscaled EPS
In a first step, the statistically downscaled ensemble forecasts were verified against the COSMO analyses by means of the rank histogram statistics described in Sect. 3.5. The resulting Talagrand diagrams for forecast lead times of 1, 3 and 9 days (red, green and blue respectively) are shown in Fig. 2 (left panel). First note that there is an asymmetry to the right-hand side. For 1 day forecast lead time it is found that in nearly 40 % of the cases, the observation is equal to or above the largest value of the ensemble. At first sight, such frequency bias appears to be rather critical. However, the absolute bias of the downscaled ensemble forecasts’ (not shown) range is only between 0.1 and 0.5 m s−1, depending on the grid box considered. Furthermore, the conditional bias of the ensem- ble forecasts (not shown) revealed that this underestimation is larger for weak gusts (<5 m s−1). Still, the application of this dataset for storm-damage modelling would lead to an underestimation of the estimated storm damage probabili- ties. The second thing to note in Fig. 2 (left panel) is the underdispersion demonstrated by theu-shape. As described in Sect. 3.5, this indicates an underestimation of the uncer- tainty on forecasted wind gusts. With increasing forecast lead time, bothu-shape as well as the asymmetry in the Talagrand diagram decreases (Fig. 2, left panel). This means that both underdispersion and frequency bias decrease with increas- ing forecast lead time, which might relate to the fact that the ECMWF-EPS system, as mentioned previously, is primarily designed for forecasts in the medium range. Thus, the en- semble spread is assumed to be optimized for lead times of several days. For shorter lead times however this might not be the case.
To correct both bias and underdispersion, the ensemble post-processing technique after Bröcker and Smith (2008)
Figure 3.Observed occurrences and forecasted probabilities for loss ratios exceeding 0.0001 ‰ for 31 October 2006 (winter storm “Britta”).
(a) Observation.(b) Deterministic forecast disregarding both uncertainty sources.(c) Only considering the meteorological uncertainty.
(d) Only considering the damage-modelling uncertainty.(e)Considering both uncertainties.(f)Considering both uncertainties based on the dressed ensemble (©GeoBasis-DE/BKG 2008).
was applied to the data. The Talagrand diagrams for the post- processed forecast (Fig. 2, right panel) shows nearly equally populated ranks. Slightly higher populations are found for the lowest and highest ranks. In case of forecast lead time of one day (red), the lowest and highest rank are populated with a frequency of about 0.05, which is roughly twice the frequency found for the intermediate ranks. In only 4 % of all forecasts, the observation falls below the lowest value and above the highest of the ensemble forecast members. Thus, the underdispersion is largely removed by post processing.
For increasing lead time the remaining underdispersion fur- ther declines. Also, the Talagrand histograms for the post- processed ensemble (Fig. 2, right panel) show no consider- able asymmetry, indicating that the bias found for the down- scaled forecasts is removed.
4.2 Prediction skill of storm-loss occurrences
The four different settings (as described in Sect. 3.4) are used to forecast storm damage occurrences from the statis- tically downscaled EPS forecasts. As an illustrative example, resulting forecasts on district level are visualized in Fig. 3 for 31 October 2006 (winter storm “Britta”). In about half of all 439 districts, the observed loss ratio within individual districts exceeded the threshold 0.0001 ‰. For a lead time of 1 day (forecasts initialized on 12:00 UTC of the previ- ous day) the deterministic setup (no uncertainty treatment) forecasts such exceedance in considerably fewer districts.
With a treatment of meteorological uncertainty only, non- zero probabilities are derived in a number of districts, for which the deterministic model does not forecast a threshold
exceedance. However, large areas which had been affected by damages feature only probabilities below 10 %. The treat- ment of the uncertainty on damage occurrences in the case of winter storm “Britta” yields a rather different picture. Now probabilities of 20 % or higher are derived for most northern regions that recorded damages. Particularly considering the dressed ensemble forecasts, forecasts applying a treatment of both uncertainties feature probabilities higher than 40 % on most regions affected, while probabilities of 10–20 % are featured in southern regions where only a few individual dis- tricts recorded damages.
Considering longer lead times, it shows that treating both uncertainties (particularly by means of the dressed ensem- ble) seems to be advantageous compared to the methods dis- regarding uncertainty information. In this example, consid- ering both uncertainty sources even 9 days in advance yields probabilities of 10–20 % in most of the areas affected, while neglecting the uncertainty information does not yield any sig- nal with respect to damage occurrences.
Of course, the quality of probabilistic forecasts cannot be judged by means of single forecasts or single storm situa- tions. Instead, a systematic evaluation of forecast quality is performed by means of Brier score and Brier skill score, which are objective measures for the quality of probabilistic forecasts. By means of reliability diagrams, further insight is gained into the calibration characteristics of the probabilistic forecasts. Additionally, ROC curves are considered to sys- tematically evaluate the potential forecast quality in terms of “false alarms” or “misses”. Verification of damage occur- rence forecasts is performed for exceedances of a low thresh-
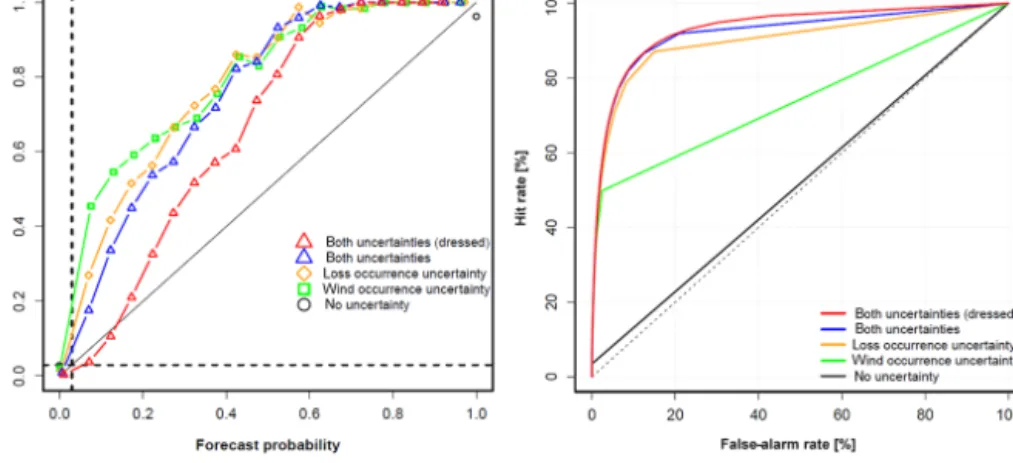
Figure 4.Reliability diagrams (left panel) and ROC curves (right panel) for the forecasts (2006–2009) with lead time 3 days for the high loss threshold (0.001 ‰). The climatological event frequency is indicated as a dashed horizontal/vertical black line in the reliability diagram (left panel). Forecasts considering only the meteorological (damage model) uncertainty are shown in green (yellow). Forecasts with treatment of both uncertainty sources using the undressed (dressed) ensemble are shown in blue (red).
old (loss ratio>0.0001 ‰) as well as a high threshold (loss ratio>0.001 ‰). Climatological occurrence frequencies for events defined in this way range from 9 to 45 days per winter half year for the former, and 1 to 11 days per winter half year for the latter depending on the district considered. When av- eraged over all districts, climatological event frequencies are about 20.9 days per winter half year (11.5 % of days) for the low threshold and 3.5 days (2 %) for the high threshold. It should be noted, that the events exceeding the high threshold are a subset of the events exceeding the low threshold. How- ever, for readability we call the former set of events “low- impact events”, since in terms of occurrence frequency the low-impact events strongly dominate (by a factor of about 6).
By means of the reliability diagrams (exemplarily shown for high impact events in Fig. 4, left panel) it can be found that considering the uncertainties inherent to the forecasts improves the reliability of probabilistic forecasts signifi- cantly. In the case of the deterministic forecasts (black cir- cles) they show that in about 3 % of all cases for which the forecasts reads “no event” a loss event has actually been ob- served. Similarly, in about 97 % of the cases for which an event is forecasted a loss event actually occurred. Consider- ing the probabilistic forecasts, it is found that if forecasted probabilities are low (<5 %), very few events are observed.
Using the forecasts treating both uncertainties and using the dressed ensemble results in an observed relative frequency of only 0.4 % (which is a considerable improvement compared to 3 % in the case of the deterministic forecast “no event”).
The diagrams show that in general an under-forecasting oc- curs for the probabilistic forecasts. Over a broad range of probabilities the observed relative frequency of events is found to be considerably higher than forecasted. As an ex- ample, one might consider all cases in which the forecast probability reads 30 %. According to the reliability diagram, in 40–60 % of these cases (depending on which uncertainties
are treated) an event had been observed. The diagrams fur- thermore show that this under-forecasting is successively re- duced (and thus the reliability increased) by explicitly treat- ing the different uncertainty sources. Particularly for inter- mediate forecast probabilities, the distance of the reliability diagram to the diagonal (representing perfectly reliable fore- casts) is reduced and is lowest if both uncertainty sources are treated. In addition, it can clearly be found, that the reliability is further increased when using the dressed ensemble instead of the raw ensemble forecasts.
Considering the example of winter storm “Britta” pre- sented in Fig. 3, it may be argued that by treating additional uncertainty sources the probability estimates increase, which may lead to an increase in false alarms. However an analysis using ROC curves (exemplarily shown for high impact events in Fig. 4, right panel) shows that this is not the case. They show that using the probabilistic forecasts, the hit rate (H) can be strongly increased with only slight increase in the false alarm rate (FAR). Exemplarily, when considering the deterministic forecasts for a lead time of 3 days, the hit rate is 3.5 % (of all observed events, only 3.5 % are forecasted), while the false alarm rate is 0.004 % (an event was fore- casted in only 0.004 % of the cases for which no event was observed) for the high threshold. By using the probabilistic forecasts, a much higher hit rate of 80 % can be achieved while keeping the false alarm rate below 10 %. In this way at least 80 % of all events are correctly forecasted, which poses a great improvement, particularly since dealing with severe and damaging events.
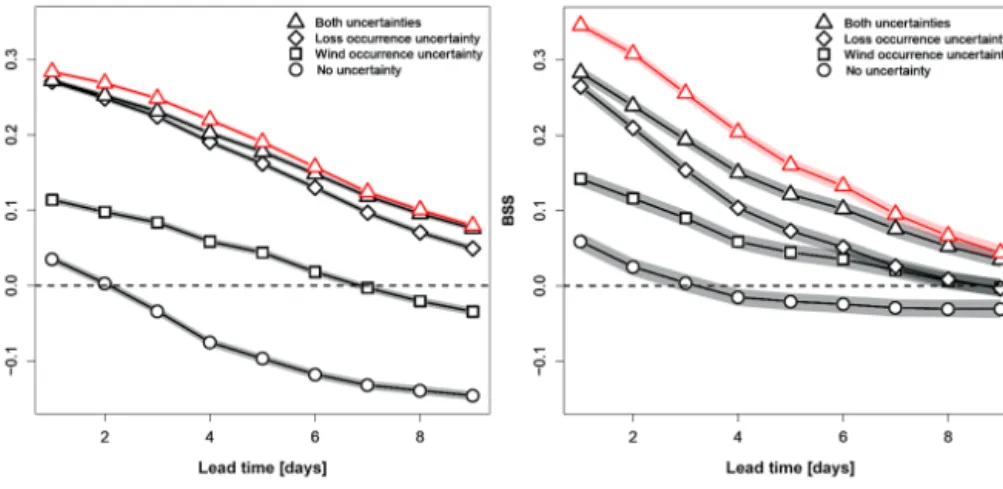
Considering the Brier skill score (as described in Sect. 3.5) with the climatology as a reference forecast it is confirmed, that the deterministic forecasts of damage occurrences only yield very low skill on the first forecast day (compare cir- cles in Fig. 5). Considering meteorological uncertainties for low-impact events (loss ratio>0.0001 ‰), significant fore-
Figure 5.Lead time dependent Brier skill score (BSS; employing climatology as the reference forecast) for events with a loss ratio exceeding low threshold (0.0001 ‰) (left panel) and loss events with a loss ratio exceeding high threshold (0.001 ‰) (right panel) for the period 2006–
2009. Shown in black symbols are verification results for the four different set-ups, red triangles show verification results using the ensemble dressing post processing method. 90 % confidence intervals from a bootstrapping method are shown as shaded areas.
cast skill is achieved for up to 6 days lead time (Fig. 5, left panel). However, skill is strongly increased if the damage model uncertainty, namely the statistical uncertainties within the relation between gust wind speed and damage occurrence probability, are treated. For a lead time of 1 day the Brier skill score raises from about 0.1 to nearly 0.3. Treating the damage model uncertainty yields skilful forecasts for the whole range of lead times considered. For low-impact events it shows that an explicit treatment of both uncertainties only yields small additional value, indicating that uncertainty in this case is dominated by the damage model uncertainty. Only for long lead times, for which meteorological forecast uncertainties naturally grow, is an additional advantage generated by the explicit and full treatment of both uncertainty sources. For lead times of 9 days this advance in forecast skill corresponds to a gain of about 1 day in lead time.
The situation is different in case of high impact events (loss ratio>0.001 ‰). Even for a lead time of 1 day, treat- ing both uncertainty sources yields a significant advantage compared to the other methods. This can be understood by considering that for the high impact situations (featuring se- vere wind conditions) even on such short lead times consid- erable meteorological uncertainty (on forecasted gust winds) is present. The gain of forecast skill (by treating both un- certainty sources) again increases with increased lead time.
This of course is due to growing meteorological forecast un- certainty which is even larger in case of the high impact events. Compared to the methods treating only individual un- certainty sources, the full treatment of uncertainty leads to an improvement of forecast skill corresponding to about 2–
3 days for lead times up to 9 days. Additionally, it is found that the ensemble post processing method (as described in Sect. 3.2) leads to an improvement in forecast skill. This im- provement is found to be larger and statistically significant for short lead times and particularly in the case of high im-
pact events. This is consistent with the finding that, on av- erage both bias and underdispersion are larger at short lead times. Particularly in the case of high impact events the cor- rection of bias and underdispersion results in a gain in fore- cast skill corresponding to about 1–2 days lead time.
The spatial stratification by districts shows that forecast skill is not homogeneous over German districts (Fig. 6). In general, higher skill is found in northern regions. It can be assumed that this higher skill in northern regions is due to an increasingly flat orography. Over complex terrain, pre- dictability of wind gusts can generally be assumed to be lower, which is thus consistent with the spatial differences in respect to the predictability of damage occurrences. Ad- ditionally the differences in skill might be influenced by the fact that the frequency of events with loss ratios exceeding the threshold is not constant throughout Germany. Since loss events are more frequent in the northern regions, skill might be larger in these regions. Furthermore, the spatial stratifi- cation also shows that skilful forecasts throughout Germany are only achieved through a treatment of the damage model uncertainty (Fig. 6), even for the shortest lead time of 1 day.
Further improvement is achieved by full treatment of uncer- tainty, which has been quantified in the previous paragraphs.
5 Summary, discussion and conclusions
A probabilistic approach to forecast local occurrences of damages due to winter storms was presented. The approach is based on a logistic regression analysis, relating daily max- ima of near-surface gust wind speeds from meteorological analysis data to damage occurrences for individual districts within Germany, defined through the exceedance of the loss ratio over a specified threshold. Due to unknown meteoro- logical conditions on subgrid scales as well as unknown de-
Figure 6.Brier skill score (employing climatology as reference forecast) for events with loss ratio exceeding low threshold (0.0001 ‰) in the period 2006–2009 (©GeoBasis-DE/BKG 2008).
tails on individual housing characteristics, it is impossible to model damage occurrences on an individual building level in a deterministic manner. Instead, only a statistical rela- tion valid for a certain stock of buildings within a district can be derived. The probability estimates for specific gust wind speeds then reflect the damage model uncertainty aris- ing from unknown details on unresolved spatial scales. An- other uncertainty in the relation between gust wind and dam- age probability arises from the fact that from a data point of view, hail-induced damages cannot be distinguished from wind-related damages in the dataset we use. According to the provider of the dataset (GDV), winter months are domi- nated by windstorm damages while summer is dominated by hail-induced damages. However in rare cases of severe win- ter storm events, hail damages may occur. For example, it is known that damaging hail occurred during the frontal pas- sage of storm Kyrill in 2007 (Fink et al., 2009). Taking into account the occurrence of hail and resulting damages could be done based on additional predictors such as the “convec- tive available potential energy” (CAPE) and “convective in- hibition” (CIN). Based on a logistic regression model with multiple predictors, both the individual effect of hail but also the contribution of hail in the case of winter storms could be quantified. It can be assumed, that the probability of hail will increase in case of the most severe winter storm events. Thus, for high gust winds the damage probability forecasts (which neglect the effects of hail) might be underestimated. Consid- ering the reliability diagrams for the probabilistic forecasts (exemplarily shown in Fig. 4, left panel) we do find such un- derestimation of the probability forecasts. However, a more in depth analysis is needed to clearly attribute this to effects due to hail. This has not been the scope of this paper but we plan to address this in further research.
When forecasting winter storm damages, further uncer- tainty arises due to meteorological forecast uncertainties. In this study, these uncertainties were addressed by applying the storm damage model to the operational EPS system of the ECMWF. Since the resolution of the ECMWF-EPS is too coarse, a statistical downscaling was applied to obtain near- surface wind gusts on the COSMO-EU grid (7 km).
In a first step, the statistically downscaled gust winds were verified against meteorological analyses, indicating a bias of the ensemble predictions towards lower gust wind speeds. In addition, the ensemble predictions were found to be under- dispersive, thus showing too little ensemble spread, which indicates an underestimation of uncertainty by the ensem- ble. By applying the probabilistic storm-damage model to the ensemble forecasts the influence of the individual un- certainty sources (meteorological forecast uncertainty and damage-model uncertainty) has been investigated. Results show that neglecting the statistical uncertainty arising within the damage model leads to rather poor forecast skill. Par- ticularly for low-impact events and for short lead times, the damage model uncertainty is found to dominate the overall uncertainty. This reflects the fact that meteorological fore- cast uncertainties are smaller at short lead times and partic- ularly in the case of low-impact (low wind) situations where basically an ensemble mean forecast or even a single deter- ministic forecast is sufficient to derive reasonable forecasts.
With longer lead times, meteorological forecast uncertain- ties naturally play an increasing role. Particularly for high- impact situations (due to severe wind gusts) it was shown that meteorological forecast uncertainties cannot be neglected without severe deficiency in skill. This means that an ex- plicit treatment of both uncertainties leads to considerable improvement in forecast skill. The reason for this can be
found in the non-linearity of the relation between the me- teorological parameter wind and resulting impact or impact probability. Basically such nonlinear relation implies the ne- cessity of weighing ensemble members in a more complex fashion compared to simply calculating the ensemble mean of gust wind speeds. This nonlinear weighing is taken into account by the impact modelling step and subsequent en- semble averaging for the forecast quantity of interest (in this case impact probability). Thus, in such a situation an ex- plicit treatment of uncertainty through the complete mod- elling chain is highly beneficial.
For short lead times and low-impact situations the effect from a treatment of both uncertainties is negligible. For large lead times (up to 9 days) this effect corresponds to a gain of one day in forecast lead time. For high-impact situations this effect is even larger, corresponding to a gain of 2–3 days lead time. Both bias and underdispersion of the ensemble fore- casted gust wind speeds have been treated by applying an en- semble post-processing method (ensemble dressing), which is found to effectively compensate both shortcomings. Using the ensemble dressed gust winds as the basis for the dam- age occurrence forecasts shows additional forecast skill cor- responding to a gain of 1–2 days lead time. This gain is par- ticularly large at shorter lead times of a few days, for which a greater bias as well as a larger underdispersion in forecasted gusts has been found.
Overall, this study shows, that in the case of winter storm damages, skilful predictions of storm loss occurrences on lead times of several days can be made using the pre- sented (fully probabilistic) framework to integrate meteoro- logical forecast uncertainties and uncertainties resulting from a downstream impact model. Such quantification of both po- tential impacts of severe weather and their respective likeli- hood forms the basis for developing risk-based warning sys- tems. By quantifying impacts and their likelihood, which is particularly relevant to recipients, the acceptance of weather warnings might be strongly enhanced. As one of the first national weather services, the UK Met Office has recently moved on to a risk-based warning system (Neal et al., 2013).
The basis of such a warning system is formed by the risk matrix, composed of the two dimensions impact and likeli- hood. By quantification of both these dimensions, the pre- sented framework can thus directly feed into such a warning system.
6 Data availability
The data set on insured losses is property of the Gesamtver- band der Deutschen Versicherungswirtschaft e.V. (GDV) and is not available to the public. Inquiries concerning data usage should be directed to GDV.
Information on the availability and accessibility of the op- erational COSMO-EU analyses can be found in Schulz and
Schättler (2014). Inquiries about data usage should be di- rected to Deutscher Wetterdienst.
Operational ECMWF forecast data are described in Palmer et al. (2007) and are accessible for authorized users via the ECMWF (ECMWF, 2016).
The statistically downscaled gust forecasts and resulting damage probabilities, generated as part of this work, are in- tellectual property of Freie Universität Berlin and are not available to the public. Researchers interested in scientific collaboration and data usage are asked to contact the authors.
Acknowledgements. This research was carried out in the Hans Ertel Centre for Weather Research. This research network of universities, research institutes and the Deutscher Wetterdienst is funded by the BMVI (Federal Ministry of Transport and Digital Infrastructures).
Furthermore, contributions to this work have been funded by the Federal Ministry of Education and Research in Germany (BMBF) through the research program MiKlip (FKZ: 01LP1104A) and by Munich Re. We wish to thank the Gesamtverband der Deutschen Versicherungswirtschaft e.V. (GDV) for providing the loss data.
We are also grateful to the German Weather Service (DWD) and the ECMWF for providing access to the EPS data. We would like to thank the editor Sven Fuchs and the two anonymous reviewers, whose constructive comments helped to improve the article.
Edited by: S. Fuchs
Reviewed by: two anonymous referees
References
Bröcker, J. and Smith, L.: From ensemble forecasts to pre- dictive distribution functions, Tellus A, 60, 663–678, doi:10.1111/j.1600-0870.2008.00333.x, 2008.
Buizza, R., Miller, M., and Palmer, T. N.: Stochastic represen- tation of model uncertainties in the ECMWF ensemble pre- diction system, Q. J. Roy. Meteorol. Soc., 125, 2887–2908, doi:10.1002/qj.49712556006, 1999.
Doms, G.: A Description of the Nonhydrostatic Regional COSMO- Model – Part I: Dynamics and Numerics Consortium for Small- Scale Modelling, Deutscher Wetterdienst, Offenbach, Germany, 2011.
Donat, M. G., Pardowitz, T., Leckebusch, G. C., Ulbrich, U., and Burghoff, O.: High-resolution refinement of a storm loss model and estimation of return periods of loss-intensive storms over Germany, Nat. Hazards Earth Syst. Sci., 11, 2821–2833, doi:10.5194/nhess-11-2821-2011, 2011.
ECMWF: Operational archive for the Ensemble prediction system, available at: http://apps.ecmwf.int/archive-catalogue/
?class=od&stream=enfo&expver=1 (last access: 1 April 2016), 2016.
Fink, A. H., Brücher, T., Ermert, V., Krüger, A., and Pinto, J. G.:
The European storm Kyrill in January 2007: synoptic evolution, meteorological impacts and some considerations with respect to climate change, Nat. Hazards Earth Syst. Sci., 9, 405–423, doi:10.5194/nhess-9-405-2009, 2009.
Gneiting, T.: Calibration of Medium-Range Weather Forecasts, Technical Memorandum 719, European Centre for Medium Range Weather Forecasts, Reading, England, 2014.
Gneiting, T. and Raftery, A. E.: Strictly Proper Scoring Rules, Prediction, and Estimation, J. Am. Stat. Assoc., 102, 359–378, doi:10.1198/016214506000001437, 2007.
Haas, R. and Pinto, J. G.: A combined statistical and dy- namical approach for downscaling large-scale footprints of European windstorms, Geophys. Res. Lett., 39, L23804, doi:10.1029/2012GL054014, 2012.
Heneka, P. and Hofherr, T.: Probabilistic winter storm risk assess- ment for residential buildings in Germany, Nat. Hazards, 56, 815–831, doi:10.1007/s11069-010-9593-7, 2010.
Heneka, P. and Ruck, B. : A damage model for the assessment of storm damage to buildings, Eng. Struct., 30, 3603–3609, doi:10.1016/j.engstruct.2008.06.005, 2008.
Jolliffe, I. T. and Stephenson, D. B. (Eds.): Forecast Verification – A Practitioner’s Guide in Atmospheric Science, 2nd Edn., John Wiley & Sons Ltd, Chichester, UK, 292 pp., 2003.
Klawa, M. and Ulbrich, U.: A model for the estimation of storm losses and the identification of severe winter storms in Germany, Nat. Hazards Earth Syst. Sci., 3, 725–732, doi:10.5194/nhess-3- 725-2003, 2003.
Kruschke, T.: Winter wind storms: Identification, verification of decadal predictions, and regionalization, PhD thesis, Institute of Meteorology, Dept. of Earth Sciences, Freie Universität Berlin, Berlin, Germany, 2015.
Leutbecher, M. and Palmer, T. N.: Ensemble forecasting, J. Comput.
Phys., 227, 3515–3539, doi:10.1016/j.jcp.2007.02.014, 2008.
Molteni, F., Buizza, R., Palmer, T. N., and Petroliagis, T.: The ECMWF Ensemble Prediction System: Methodology and vali- dation, Q. J. Roy. Meteorol. Soc., 122, 73–119, 1996.
MunichRe: Zwischen Hoch und Tief – Wetterrisiken in Mitteleu- ropa, Münchener Rückversicherungs-Gesellschaft, München, 2007.
MunichRe: GeoRisikoForschung, NatCatSERVICE, München, Jan- uary 2012.
MunichRe: Naturkatastrophen 2012 Analysen, Bewertungen, Po- sitionen Münchener Rückversicherungs-Gesellschaft, München, 2013.
Mylne, K. R., Decision-making from probability forecasts based on forecast value, Meteorol. Appl., 9, 307–315, doi:10.1017/S1350482702003043, 2002.
Neal, R. A., Boyle, P., Grahame, N., Mylne, K., and Sharpe, M.:
Ensemble based first guess support towards a risk-based se- vere weather warning service, Meteorol. Appl., 21, 563–577, doi:10.1002/met.1377, 2013.
Palmer, T. N.: Predicting uncertainty in forecasts of weather and climate, Rep. Prog. Phys., 63, 71–116, 2000.
Palmer, T. N., Gelaro, R., Barkmeijer, J., and Buizza, R.: Singular Vectors, Metrics, and Adaptive Observa- tions, J. Atmos. Sci., 55, 633–653, doi:10.1175/1520- 0469(1998)055<0633:SVMAAO>2.0.CO;2, 1998.
Palmer, T. N., Buizza, R., Leutbecher, M., Hagedorn, R., Jung, T., Rodwell, M., Vitart, F., Berner, J., Hagel, E., Lawrence, A., Pappenberger, F., Park, Y.-Y., von Bremen, L., and Gilmour, I.:
The Ensemble Prediction System – Recent and Ongoing De- velopments, Technical Memorandum 540, European Centre for Medium Range Weather Forecasts, Reading, England, 2007.
Palmer, T., Buizza, R., Doblas-Reyes, F., Jung, T., Leutbecher, M., Shutts, G., Steinheimer, M., and Weisheimer, A.: Stochas- tic Parametrization and Model Uncertainty, Technical Memoran- dum 598, European Centre for Medium Range Weather Fore- casts, Reading, England, 2009.
Prahl, B. F., Rybski, D., Kropp, J. P., Burghoff, O., and Held, H.: Applying stochastic small-scale damage functions to German winter storms, Geophys. Res. Lett., 39, L06806, doi:10.1029/2012GL050961, 2012.
Rockel, B., Will, A., and Hense, A.: The Regional Climate Model COSMO-CLM(CCLM), Meteorol. Z., 17, 347–348, doi:10.1127/0941-2948/2008/0309, 2008.
Schulz, J. P. and Schättler, U.: Kurze Beschreibung des Lokal- Modells Europa COSMO-EU (LME) und seiner Datenbanken auf dem Datenserver des DWD (Stand 13.06.2014), Deutscher Wetterdienst, http://www.dwd.de/SharedDocs/downloads/DE/
modelldokumentationen/nwv/cosmo_eu/cosmo_eu_dbbeschr_
201406.html (last access: 1 April 2016), 2014.
Slingo, J. and Palmer, T.: Uncertainty in weather and cli- mate prediction, Philos. T. Roy. Soc. A, 369, 4751–4767, doi:10.1098/rsta.2011.0161, 2011.
UNISDR – United Nations Office for Disaster Risk Reduction:
Sendai Framework for Disaster Risk Reduction 2015–2030, adopted at the Third United Nations World Conference on Disas- ter Risk Reduction, 18 March 2015, Sendai, Japan, http://www.
preventionweb.net/files/43291_sendaiframeworkfordrren.pdf (last access: 4 April 2016), 2015.
Wilks, D. S.: Statistical Methods in the Atmospheric Sciences, 3rd revised Edn., Academic Press, Burlington, USA, p. 704, 2011.