1 Paleoceanography and Paleoclimatology
Supporting Information for
Sedimentary ancient DNA from Kronotsky Peninsula: how sea ice, salinity and insolation dynamics have shaped diatom composition and richness over the past 20,000 years H. H. Zimmermann1, K. R. Stoof-Leichsenring1, S. Kruse1, D. Nürnberg2, R. Tiedemann3, and U.
Herzschuh1,4,5
1Polar Terrestrial Environmental Systems, Alfred Wegener Institute Helmholtz Centre for Polar and Marine Research, Potsdam, 14473, Germany
2Ocean circulation and climate dynamics, GEOMAR Helmholtz Centre for Ocean Research Kiel, Kiel, 24148, Germany
3Marine Geology, Alfred Wegener Institute Helmholtz Centre for Polar and Marine Research, Bremerhaven, 27568, Germany
4Institute of Biochemistry and Biology, University of Potsdam, 14476 Potsdam, Germany
5Institute of Environmental Sciences and Geography, University of Potsdam, 14476 Potsdam, Germany
Contents of this file
Figure S1 Figure S2 Figure S3 Table S3Additional Supporting Information (Files uploaded separately)
Captions for Table S1 to S22
Figure S1. Boxplot of rarefied richness (Hill number 0) of amplicon sequence variants (ASVs) assigned to centric (red) and pennate (blue) diatoms according to climatic phases of the past~19.9 cal kyr BP. The points represent the distribution of rarefied richness for each sample in the corresponding phases. The first and third quartiles are represented by the lower and upper limits of the box, the horizontal line inside the box represents the median and the whiskers
3
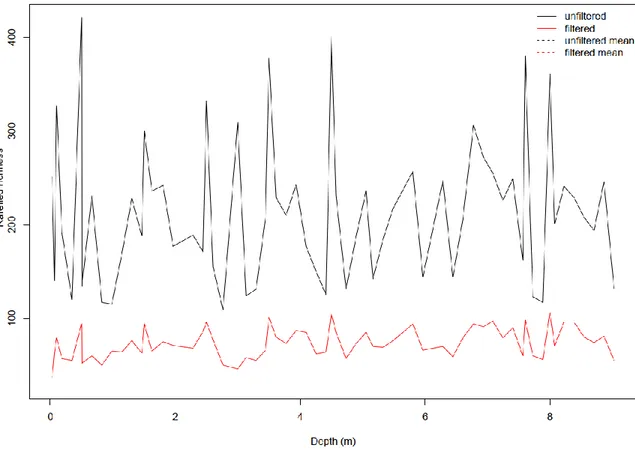
represent the maximum and minimum of 1.5 times the interquartile range, respectively. Points beyond whiskers are outliers.Figure S2. Rarefied richness (number of sequence variants) of the unfiltered diatom sedaDNA dataset in comparison to the filtered dataset used in our study.
4
Figure S3. Rarefaction curves (blue lines) of the diatom sedaDNA data. The vertical line marks the number of read counts, which was used as the basis for resampling (n = 8,882), while the horizontal black lines mark the rarefied richness estimates per for each sample.Table S1. Amplicon sequence variants (ASVs) that were assigned a taxonomic name based on 90-100% similarity to an entry in the EMBL nucleotide reference database (release 138) using OBITools (separate Excel file).
Table S2. Amplicon sequence variants (ASVs) that were assigned to negative controls.
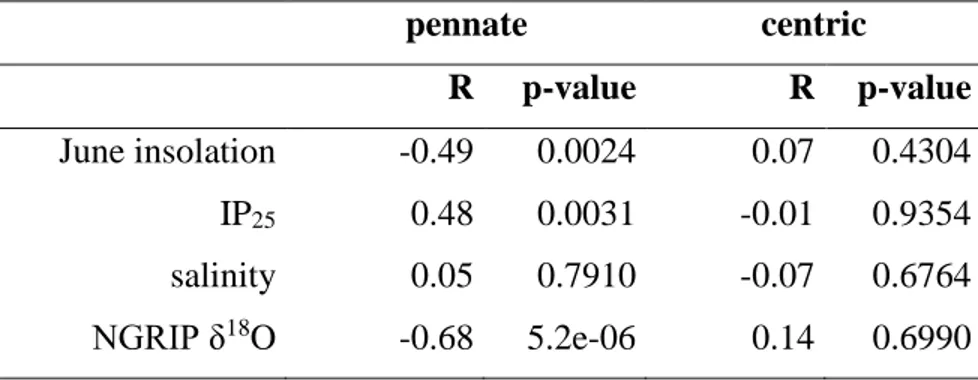
Table S3. Pearson correlation coefficients and corresponding p-values of pennate and centric diatom richness with environmental variables.