Modelling mobility tool ownership using a global indicator for accessibility
Veröffentlicht in / Published in:
M. Schmaus (2021): Modelling mobility tool ownership using a global indicator for accessibility. hEART 2020 – 9th Symposium of the European Association for Research in Transportation, 3/4. Februar 2021, Lyon.
Universität Stuttgart
Institut für Straßen- und Verkehrswesen
Lehrstuhl für Verkehrsplanung und Verkehrsleittechnik
www.uni-stuttgart.de/isv/vuv/
Modelling mobility tool ownership using a global indicator for accessibility
Matthias Schmaus1, Dr.-Ing.
Abstract
Mobility tool ownership, meaning the availability of resources that enable a person to use a particular transport system such as a car or a season ticket for public transport, is one of the most important factors influencing individual travel behavior. It is obvious that transport supply affects mobility tool ownership decision. For this reason, it should be determined integrally on a model-driven basis in travel demand models. The paper suggests a global indicator describing accessibility to be applied in this matter. The indicator is calculated based on the results of travel demand modelling, namely a combination of trip generation, trip destination and mode choice. It is implemented in a non-spatial travel demand model at municipal level.
An example illustrates the effect and importance of considering mobility tool choice in strategic transport planning.
Keywords
mobility tool ownership, mobility resources ownership, accessibility, travel demand modeling
1 Matthias Schmaus, Dr.-Ing.
matthias.schmaus@isv.uni-stuttgart.de;
University of Stuttgart,
Chair for Transport Planning and Traffic Engineering, Pfaffenwaldring 7,
70569 Stuttgart
1 Introduction
Mobility tool ownership (MTO), meaning the availability of a car, a season ticket for public transport, a registration with a carsharing provider or all other resources that enable a person to use a particular transport system, is one of the most important factors influencing individual travel behavior. In the recent past, two additional reasons have emerged for determining MTO- choice integrally in strategic travel demand models. Firstly, in order to counter climate change, it might be necessary to take measures that considerably change transport behavior. It seems obvious that corresponding measures such as increasing the fuel price to a multiple of its current state or fare-free public transport will also have impact on MTO-choice. Secondly, the market introduction of autonomous vehicles in combination with the offer of new mobility services is expected to bring about a disruption in both travel behavior and MTO [1–3].
Nevertheless, in regional travel demand models it is still common to specify MTO as an exogenous model input variable.
This paper focuses on an approach of modelling MTO-choice integrated in a strategic travel demand model on municipal level. The demand model reproduces the decision-making processes of trip generation, trip distribution and mode choice. The MTO-choice model uses the output of the travel demand model interpreting it as an indicator of accessibility. The overall model framework, the model input data and calibration process are described in detail by Schmaus [4].
2 Relevant literature
There is a wide range of approaches to model vehicle ownership and vehicle type choice. One group of models can be categorized as “static disaggregate car ownership models" [5]. These models have in common that they reproduce a static state and use the foundation of discrete choice theory [5]. The following will focus on these type of models. Regarding the model theory, reference is made to Ben-Akiva and Lerman [6]. Already in earlier models of this category, accessibility measures were included as explanatory variables in the utility functions [5]. As an example, the Sydney Strategic Transport Model uses the logsums of the results of mode choice and destination choice for home-work trips [7]. The specification suggests that it was a Hansen-based measure of accessibility
A
as it is defined as the logsum of the opportunitiesO
d (e.g. number of jobs, population) at a destinationd
multiplied by a function of generalized travel costs reaching this destinationc
d [8]. Equation (1) shows one option among others to transform the travel costs is using an exponential function.log
dexp(
d)
d D
A O c
=
(1)In opposite to vehicle ownership modeling, MTO modeling just appeared in literature within the last years (e.g. [9–12]). MTO models have in common, that they usually focus on personal level rather than on household level as car ownership models usually do. Different model specifications are applied. Weis et al. [9] estimated a mixed-logit model including variables such as the age of the currently owned vehicle and the holdings of season tickets. In order to deal with the possibility of owning several mobility tools at the same time, Kieser et al. [10]
chose the approach of modelling the decision between ownership and non-possession for
each mobility tool separately (binominal logit models). Car-availability was considered as a negative constant in the decision on season ticket ownership. Travel times to the nearest urban center by car and public transport held as variables indicating accessibility. Plevka et al. [11]
included bicycle ownership as further option in the decision making process. They applied a nested logit approach and an indicator of accessibility based on the concept of a „Perceived Activity Set“ (PAS) developed by Le Vine at al. [13]. This concept allows taking into account different types of opportunities within a single indicator. The indicator was computed on the results of a mode choice model. Loder and Axhausen [12] used a certain type of multivariate probit model and several indicators describing transport supply and accessibility. The accessibility indicators are based on Hansens definition [8] for both car and public transport, each for the two opportunities employment and population.
3 Modeling approach
3.1 Model framework
The model framework was developed to enable a strategic assessment of measures under changing surrounding conditions with regard to greenhouse gas emissions from transport at the municipal level. It reproduces the everyday travel behavior of the inhabitants of a municipality. The framework involves a population and household model, a vehicle fleet model, a travel demand model, the MTO model and serval further submodels for the final calculation of greenhouse gas emissions. For the illustration of the functionality of the MTO model, the following levels of disaggregation are of importance:
• Seven person categories
c
• Ten activities, each connected to a certain opportunity (e.g. work and number of jobs)
a
• Six combinations of mobility tool ownership
t
• Five modes
m
• 100 destination zones
d
The vehicle fleet model deals with different vehicle types, nevertheless the travel demand model and MOT choice model assumes only average cost values. The travel demand model reproduces the first three steps of the conventional four-step algorithm: Trip generation, trip distribution and mode choice. The modelling approach can be classified as non-spatial. The structure of traffic zones for modelling destination choice is consists of rings around the trip origin. Each of the 100 destination zone rings has a width of one kilometer. Due to that, modelling the fourth step of the four-step algorithm (traffic assignment) is not possible and travel distances are estimated by using detour factors. The MTO model determines the shares of the six possible combinations of mobility tool ownership, car only (
t =
car), public transport season ticket only (t =
st), both (t =
both) or neither (t =
none) for driving licence holders as well as public transport season ticket (t =
noDL,st) or no public transport season ticket (t =
noDL,n) for persons without driving licence for each person category.
3.2 Travel demand model and accessibility computation
The trip generation model provides the number of trips per year for each person-category for ten activities
D
c a, . The combined distribution and mode choice model is disaggregated in terms of activities and MTO combinations, meaning that for each combination (in total 60 combinations) different sets of model parameters are used. This model approach carries the simplifying assumption that travel behaviour differs due to the availability of mobility tools, but does not vary between person categories within an MTO combination. The nested logit model determines the probabilities for choosing each destination zone to be reached with each transport mode (walk, bicycle, car as driver, car as passenger, public transport)p
m d t a, | ,according to equation (2) and (3). For simplification, in equation (3) the scaling parameter within the nests is not shown as it is normalized to 1 for the reasons of model estimation [6].
, | , | , , | ,
m d t a m d t a d t a
p = p p
(2), , , ,
, , , , | ,
, , ,
, , , ,
exp ln exp( )
exp( )
exp( )
exp ln exp( )
d
d a m d t a a
m d t a m M m d t a
d m d t a
m M d a m d t a a
d D m M
v v
p v
v v v
+
=
+
(3)
The probability
p
m d t a, | , is a combination of the probabilities choosing a certain destination| , d t a
p
and reaching this destination using a certain modep
m d t a| , , . The termv
m d t a, , , is thesystematic component of the utility of a mode, depending also on destination, mobility tool ownership and trip purpose. It is a linear combination of different mode-specific cost terms.
,
v
d a is the systematic component of the utility of a destination depending additionally on the trip purpose. Number of opportunities and the direct distance are the explanatory variables used within this utility term. Schmaus [4] provides more detailed information on all model parameters and the calibration process.The approach of the developed accessibility term follows the idea, that this decision process and its input data involves all information describing the perceived accessibility of an individual of each person category. To use this information, the model’s hierarchy is extended by one level (equation (4)).
, , | | , , | , |
m d t a m d t a d t a t a
p = p p p
(4)The marginal choice probability of choosing an MTO combination
t
includes the logarithm of the denominator of the lower nests (comparable to the marginal probability of destination choice using the sum from the mode choice probability in equation (3)). Inserting the utility function ofv
d a, , this term describes an accessibility according to the definition of Hansen [8](equation (5)). In this equation,
O
d a, are the opportunities for each activity in each destination zone, the component
aD D
D reflects the influence of the direct distance.,
ln
,exp
Dln exp(
, , ,)
dt a d a a d m d t a a
d D m M
A O D v
= +
(5)As the MTO model’s disaggregation level are person categories, this accessibility term is weighted by the number of trips per activity computed in the trip generation model (equation 6).
, ,
,
, c a t a a A
t c
c a a A
D A
A D
=
(6)The measure
A
t c, thus describes the accessibility a person perceives under a certain MTO condition taking into account all trips a person requires to make. It is important to point out that this way summing up the accessibilities carries the risk of inconsistency of the model for two reasons. Firstly, it implies the assumption that each trip is of equal importance for the MTO decision. It can be argued that frequent trips on the same origin-destination relation (e.g. work trips) effect MTO choice more. For that reason, Le Vine et al. [13] include an activity-dependent weighting factor in their definition of accessibility. However, estimating a corresponding factor was not possible due to the use of aggregated behavioral data. Secondly, the parameters of the mode and destination choice model were estimated for eacha
-t
-combination separately.Nevertheless, the results of
A
t c, were reasonable in terms of differences between MTO combination for all person categories in different scenarios tested.3.3 Mobility tool ownership model
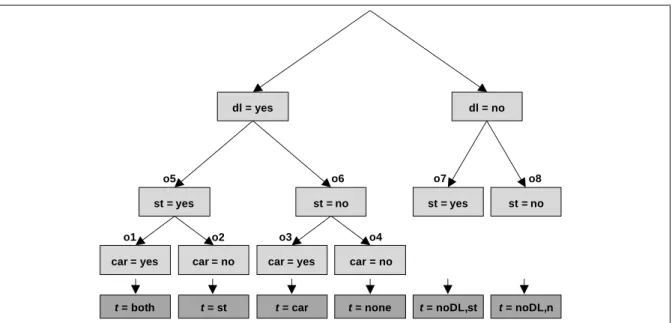
The MTO model is of hierarchical structure (Figure 1). On top level, the share of persons holding a driving licence is determined based on a model-exogenous variable. A binary multinomial logit model computes whether a person without driving licence owns a season ticket or not. Decisions on car and season ticket ownership of persons holding a driving licence are modelled using a nested logit approach. Interestingly the model parameter estimation indicated a structure determining season ticket ownership on the upper level and car ownership within the models nests.
Figure 1 Hierarchic structure of MTO model
Besides the accessibility term, two other independent variables are applied to describe the utility of each MTO combination: Firstly, the yearly costs of a season ticket depending on the person category and the price of an average personal car, and secondly, a term depending on the household composition referring to the number of cars in the household. The parameters of the model were calibrated on aggregated data for different areas classified by degree of urbanisation and using service elasticities as well as price elasticities from literature. For the application to a specific municipality, the MTO model has to be recalibrated by estimating its alternative specific constants using data on car density and the level of season ticket ownership.
4 Application: Climate Protection Scenario for the Municipality of Stuttgart
To show the effects of integrated MTO modelling, the model was applied to the municipality of Stuttgart, the center of a metropolitan region in the south of Germany with about 630.000 inhabitants. It was calibrated on data of the year 2010. On this basis, two future scenarios were developed and compared. In the Base Scenario, population, household composition, income and license holdings slightly change compared to the calibration case. Furthermore, the composition of the vehicle fleet and the underlying vehicle technology are changing significantly. Especially the high share of electric vehicles causes a considerable reduction of vehicle costs. These conditions remain unchanged in the second scenario which was developed with the objective of achieving a reduction of greenhouse gas emissions by 95 % (Climate Protection Scenario). The implementation of several measures, such as pricing measures (costs of electricity, fuel, car acquisition and public transport use), the number of pedelecs, extension of the bicycle path network and an investment in the public transport system, was assumed for this purpose. Table 1 shows an extract of values changed between the scenarios to operationalize these measures.
dl = no
car = yes dl = yes
st = yes st = no st = yes st = no
car = no car = no
car = yes
o1 o2 o3 o4
o5 o6 o7 o8
t = both t = st t = car t = none t = noDL,st t = noDL,n
Table 1 Variables describing transport supply and assumed changes between the modelled scenarios (extract)
Base Scenario Climate Protection Scenario
Annual fixed and operating costs of a car 580 €/a unchanged
Acquisition costs of a car 1,274 €/a 1,911 €/a
Average of distance-depending car travel costs 0.11 €/km 0.25 €/km
Price for public transport ride (average distance) 2.40 € 1.20 €
Bicycle travel speed (average) 12.5 km/h 20.8 km/h
Access and egress time for public transport (sum, average) 9.3 min 7.6 min Headway of long-distance/short-distance public transport system 10 min / 60 min 7.5 min / 30 min
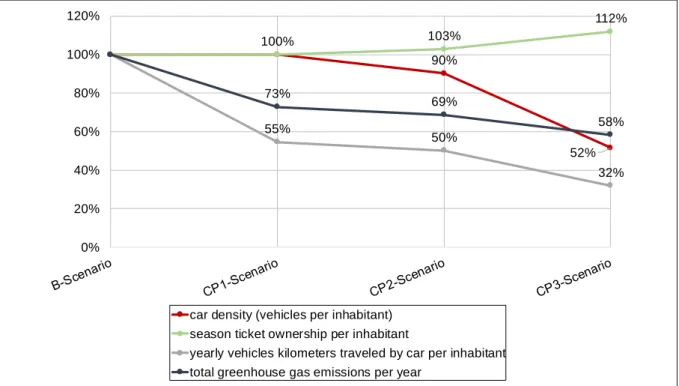
To illustrate the effects of different choice mechanisms implemented in the model, four model runs are compared: Base Scenario (B-Scenario), Climate Protection Scenario without MTO modelling (CP1-Scenario), Climate Protection Scenario only considering effects of acquisition costs for car and season ticket on MTO (CP2-Scenario) and Climate Protection Scenario also considering the effects of accessibility (CP3-Scenario). Figure 2 shows the results. In scenario CP1 MTO obviously remains unchanged. Nevertheless, the measures show considerable effect on mobility behavior visible by a 45 % increase of vehicle kilometers traveled. The model’s reaction on higher car prices are relatively small. However, taking into account the effects of the measures on MTO in terms of accessibility leads to a remarkable change in vehicle ownership. Overall, due to effects on MTO, the reduction of vehicles kilometers traveled increases by about 40 % and the reduction of greenhouse gas emissions by about 20 %.
Figure 2 Results of scenario runs with and without considering effects of MTO
100%
90%
52%
103%
112%
55% 50%
32%
73% 69%
58%
0%
20%
40%
60%
80%
100%
120%
car density (vehicles per inhabitant) season ticket ownership per inhabitant
yearly vehicles kilometers traveled by car per inhabitant total greenhouse gas emissions per year
5 Conclusion and outlook
The scenarios show the importance of an integrated MTO modelling for strategic transport planning. Not considering the effects of accessibility on MTO choice means neglecting important possibilities of the modelled population to react on changes in transport supply. Due to the suggested indicator of accessibility, the illustrated approach allows the consideration of all modes of transport and the individual trips of each person category.
Nevertheless, a major simplification embodied in the model is to consider car ownership as a yes-or-no-decision that applies to an average car with average costs. This neglects the possibility of responding to changes in vehicle costs by adapting vehicle type choice. Although this would make the model specification and calibration considerably more difficult, further development should focus on overcoming this shortcoming. Another important step towards application of the MTO model would be the integration in a regular spatial travel demand model. Here, the challenge is to keep the computation effort within a manageable range, since in contrast to the application in a non-spatial model, load-induced feedback effects will then come into play.
6 References
[1] A. Polydoropoulou, I. Pagoni, A. Tsirimpa, A. Roumboutsos, M. Kamargianni, and I.
Tsouros, “Prototype business models for Mobility-as-a-Service,” Transportation Research Part A: Policy and Practice, vol. 131, pp. 149–162, 2020, doi:
10.1016/j.tra.2019.09.035.
[2] F. Nazari, M. Noruzoliaee, and A. Mohammadian, “Shared versus private mobility:
Modeling public interest in autonomous vehicles accounting for latent attitudes,”
Transportation Research Part C: Emerging Technologies, vol. 97, pp. 456–477, 2018, doi: 10.1016/j.trc.2018.11.005.
[3] T. Litman, Autonomous vehicle implementation predictions. Victoria, Canada, 2017.
[4] M. Schmaus, Quantifizierung der Treibhausgasemissionen des Personenverkehrs in langfristigen Energieszenarien auf kommunaler Ebene. Stuttgart, 2019.
[5] G. De Jong, J. Fox, A. Daly, M. Pieters, and R. Smit, “Comparison of car ownership models,” Transport Reviews, vol. 24, no. 4, pp. 379–408, 2004, doi:
10.1080/0144164032000138733.
[6] M. Ben-Akiva and S. R. Lerman, Discrete Choice Analysis: Theory And Application To Travel Demand, 2000th ed. Cambridge: MIT Press, 1985.
[7] F. Tsang, A. Daly, J. Fox, and B. Patruni, “Sydney Strategic Model Re-estimation:
Licence, Car Ownership and Frequency Models,” 2010.
[8] W. G. Hansen, “How Accessibility Shapes Land Use,” Journal of the American Institute of Planners, vol. 25, no. 2, 1959, doi: 10.1080/01944365908978307.
[9] C. Weis, K. W. Axhausen, R. Schlich, and R. Zbinden, “Models of mode choice and mobility tool ownership beyond 2008 fuel prices,” Arbeitsberichte Verkehrs- und Raumplanung, vol. 566, 2009, doi: 10.3929/ethz-a-005864304.
[10] B. Kieser, M. Kowald, A. Justen, and N. Mathys, “Analysis of mobility tool ownership in Switzerland: A model-based comparison of the years 2000 and 2010,” Beitrag auf 15th Swiss Transport Research Conference, Monte Verità, Schweiz, 2015.
[11] V. Plevka, P. Astegiano, W. Himpe, C. Tampère, and M. Vandebroek, “How Personal Accessibility and Frequency of Travel Affect Ownership Decisions on Mobility
Resources,” Sustainability, vol. 10, no. 4, 2018, doi: 10.3390/su10040912.
[12] A. Loder and K. W. Axhausen, “Mobility tools and use: Accessibility's role in
Switzerland,” Journal of Transport and Land Use, vol. 11, no. 1, pp. 367–385, 2018, doi:
10.3929/ethz-b-000121743.
[13] S. Le Vine, A. Sivakumar, M. Lee-Gosselin, and J. Polak, “A new concept of
accessibility to personal activities: Development of theory and application to an empirical study of mobility resource holdings,” Journal of Tranport Geography, vol. 31, pp. 1–10, 2013, doi: 10.1016/j.jtrangeo.2013.04.013.