The effects of environmental conditions on growth and protease inhibitor production of the cyanobacterium
Microcystis aeruginosa
Inaugural-Dissertation zur Erlangung des Doktorgrades
der Mathematisch-Naturwissenschaftlichen Fakultät der Universität zu Köln
vorgelegt von
Christian Burberg
aus Köln
Köln, 2021
Gutachter: Prof. Dr. Eric von Elert Prof. Dr. Michael Bonkowski
Prüfungsvorsitzender: Prof. Dr. Frank Schäbitz
Tag der Disputation: 24.11.2020
“It's been a long road, getting from there to here.
It's been a long time, but my time is finally near.
And I can feel a change in the wind right now. Nothing's in my way.
And they're not gonna hold me down no more.
No they're not gonna hold me down.”
Russell Watson (2001) - Faith of the Heart.
Table of contents
Zusammenfassung ... 7
Abstract 9 General Introduction ... 11
Cyanobacteria – A success story ... 11
Cyanobacterial blooms – The role of humans and nutrients ... 11
Cyanobacterial Metabolites ... 13
Aim of this thesis ... 15
Chapter 1 Nitrate determines growth and protease inhibitor content of the cyanobacterium Microcystis aeruginosa ... 19
1.1. Abstract ... 21
1.2. Introduction ... 23
1.3. Material and Methods ... 25
1.3.1. Culturing conditions ... 25
1.3.2. Determination of POC and PON ... 26
1.3.3. Extraction and quantification of PIs ... 26
1.3.4. Modeling and statistical analyses ... 27
1.4. Results ... 28
1.4.1. Growth of M. aeruginosa NIVA Cya 43 under different nitrate conditions ... 28
1.4.2. Intracellular inhibitor content of M. aeruginosa... 28
1.4.3. Inhibitor content versus stoichiometry and growth rate ... 31
1.4. Discussion ... 33
1.5. Conclusion ... 37
1.6. References ... 38
Chapter 2 Phosphate limitation increases content of protease inhibitors in the cyanobacterium Microcystis aeruginosa ... 43
2.1. Abstract ... 45
2.2. Introduction ... 47
2.3. Material and Methods ... 50
2.3.1. Culturing conditions ... 50
2.3.2. Determination of POC, PON and PPart ... 50
2.3.3. Extraction and quantification of PIs ... 51
2.3.4. Modeling and statistical analyses ... 51
2.4. Results ... 54
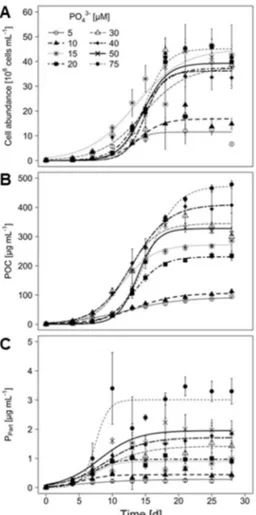
2.4.1. Growth performance of M. aeruginosa under different phosphate conditions ... 54
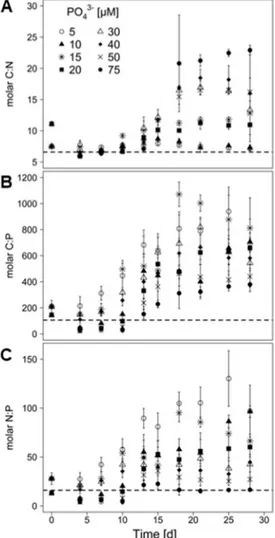
2.4.2. Stoichiometry of M. aeruginosa under different phosphate conditions ... 56
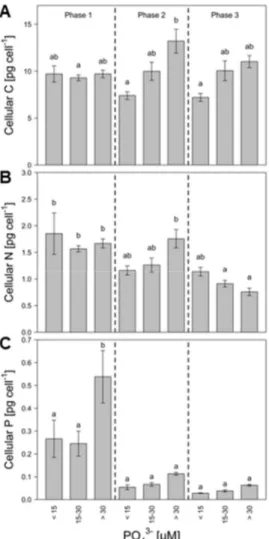
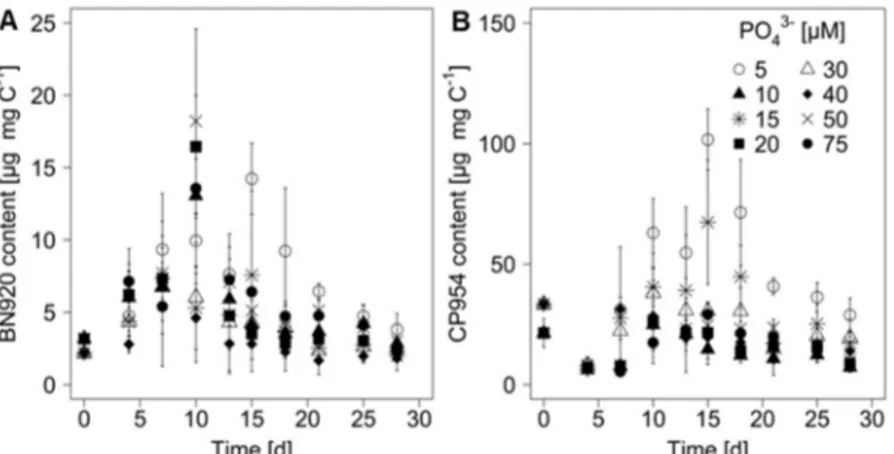
2.4.3. Inhibitor content of M. aeruginosa under different phosphate conditions ... 57
2.4.4. Inhibitor content as a function of growth rate and stoichiometry ... 60
2.5. Discussion ... 63
2.6. References ... 68
Chapter 3 A dynamic process-based modeling approach to understand the effects of nutrients on protease inhibitors in cyanobacteria ... 73
3.1. Abstract ... 75
3.2. Introduction ... 77
3.3. Material and Methods ... 79
3.3.1. Culturing conditions ... 79
Table of contents
6
3.3.3. Modeling and statistical analysis ... 80
3.4. Results ... 84
3.4.1. Data dynamics and model quality ... 84
3.4.2. Effect of N concentration on model parameters ... 85
3.4.3. Effect of P concentration on model parameters ... 86
3.5. Discussion ... 89
3.6. References ... 94
Chapter 4 The effect of light intensity on growth and protease inhibitor content of Microcystis aeruginosa ... 99
4.1. Abstract ... 101
4.2. Introduction ... 103
4.3. Material and Methods ... 105
4.3.1. Culturing conditions ... 105
4.3.2. Determination of POC, PON and PPart ... 105
4.3.3. Extraction and quantification of PIs ... 106
4.3.4. Data analysis ... 106
4.4. Results ... 108
4.4.1. Growth performance of M. aeruginosa under different light intensities ... 108
4.4.2. Elemental stoichiometry of M. aeruginosa ... 109
4.4.3. Inhibitor content of M. aeruginosa ... 112
4.4.4. Effects of stoichiometry and growth on the PI content ... 114
4.5. Discussion ... 117
4.5.1. Light and cyanobacterial growth ... 117
4.5.2. The effects of light on the toxicity of Microcystis ... 119
4.6. Conclusion ... 123
4.7. References ... 124
4.8. Supplementary ... 129
General Discussion and concluding remarks ... 131
M. aeruginosa under varying environmental conditions: growth performance ... 131
M. aeruginosa under different environmental conditions: protease inhibitors ... 136
Protease inhibitors: Potential nitrogen storage compounds? ... 139
Protease inhibitors: A potential anti-grazer defense? ... 140
Conclusion ... 141
General References ... 143
Authors contribution ... 151
Eidesstattliche Erklärung (gemäß §7 Absatz 8) ... 153
Curriculum vitae ... 155
Publication record ... 156
Danksagung ... 157
Zusammenfassung
Cyanobakterien sind photoautotrophe Organismen, die sich unter günstigen Bedingungen massenhaft in Seen, Teichen und Flussmündungen vermehren. Aufgrund der starken Nährstoffbelastung vieler Gewässer, sowie steigender Temperaturen und CO2
Konzentrationen hat die Häufigkeit von cyanobakteriellen Massenvermehrungen („Blüten“) in den letzten Jahrzehnten stark zugenommen, mit weitreichenden ökologischen und ökonomischen Folgen. Daher bilden Cyanobakterien seit Jahrzehnten einen Schwerpunkt der limnologischen Forschung. Dabei liegt der Fokus auf zwei Fragen: Welche Bedingungen kontrollieren die Entstehung von cyanobakteriellen Blüten und welche Rolle spielt die Vielfalt an Sekundärmetaboliten, welche von Cyanobakterien produzieren werden, für den Erfolg von Cyanobakterien?
Einige dieser Metabolite wirken sich nachgewiesenermaßen toxisch auf andere Wasserorganismen aus, können aber auch massive gesundheitliche Probleme bei Menschen hervorrufen. Ein großer Teil der Forschung konzentrierte sich daher auf Microcystine, eine der toxischsten Gruppen von cyanobakteriellen Metaboliten. Andere Sekundärmetabolite, wie z. B. die Gruppe der Proteaseinhibitoren, wurden hingegen eher vernachlässigt.
Proteaseinhibitoren, wie beispielsweise Nostopeptin 920 und Cyanopeptolin 954, inhibieren spezifisch Serinproteasen, z. B. im Darm vom Wasserfloh Daphnia, was unter anderem zu einem Mangel an Aminosäuren und daraus folgend zu weiteren negativen Konsequenzen führt (z. B. reduziertem Wachstum). Dies hat wiederum weitreichende Folgen für das gesamte Ökosystem, da Daphnien als Hauptkonsumenten von Phytoplankton (u. a. auch Cyanobakterien) und als Nahrung für eine Vielzahl an Räubern essentiell für den Energie- und Nährstofftransfer von der Ebene der Primärproduzenten hin zu den höheren trophischen Ebenen sind. Die Erforschung von Proteaseinhibitoren ist daher notwendig, um das Entstehen und die Auswirkungen von Cyanobakterien-Blüten vollständig zu verstehen. Dabei sind besonders Kenntnisse über den Einfluss verschiedener Umweltfaktoren auf Cyanobakterien, deren Wachstum und die Produktion von Proteaseinhibitoren erforderlich.
Im Rahmen dieser Dissertation sollte daher der Effekt von drei wesentlichen Umwelt- faktoren auf das Cyanobakterium Microcystis aeruginosa, einem der bedeutendsten blüten- bildenden Cyanobakterien, untersucht werden. Die grundlegende Fragestellung war: Wie beeinflussen verschiedene Konzentrationen von Stickstoff und Phosphor, aber auch verschiedene Lichtintensitäten, das Wachstum und vor allem die Produktion und den Gehalt von Proteaseinhibitoren in M. aeruginosa? Zur Beantwortung dieser Fragen wurden Wachstumsexperimente (Batch-Kulturen) mit M. aeruginosa NIVA Cya 43 durchgeführt, bei denen die Startkonzentrationen von Stickstoff und Phosphor variiert wurden, bzw. bei denen
Zusammenfassung
8
das Cyanobakterium verschiedenen Lichtintensitäten ausgesetzt wurde. Die Kulturen wurden regelmäßig beprobt, um das Wachstum des Cyanobakteriums, dessen Stöchiometrie und den Gehalt der zwei Proteaseinhibitoren (Nostopeptin 920 und Cyanopeptolin 954) zu bestimmen.
Bei der Auswertung der Proben nutzte ich eine Kombination von klassischen (z. B.
mikroskopische Zellzählungen) und modernsten analytischen Methoden (z. B. Hochdruck- flüssigkeitschromatographie und hochauflösende Massenspektrometrie). Darüber hinaus nutzte ich mathematische Modelle, darunter ein selbst entwickeltes, dynamisches, prozessbasiertes Modell, um das Wachstum aber auch die Dynamiken der Proteaseinhibitoren zu beschreiben und auszuwerten.
In dieser Dissertation konnte ich zeigen, dass M. aeruginosa unter einer Vielzahl von experimentellen Bedingungen wachsen kann und dass besonders erhöhte Nährstoffkonzentrationen und geringe Lichtintensitäten das Wachstum fördern. Außerdem zeigt diese Arbeit, dass die beiden untersuchten Inhibitoren permanent produziert werden, der Gehalt sich aber stark mit der Wachstumsphase und den getesteten Versuchsbedingungen verändern kann. Dementsprechend habe ich auch Zusammenhänge zwischen dem Inhibitorgehalt und der Wachstumsrate bzw. der Stöchiometrie des Cyanobakteriums finden können. Außerdem konnte ich zeigen, dass die Proteaseinhibitoren besonders unter nährstoffreichen Bedingungen in den frühen Wachstumsphasen gebildet werden, aber mit Abnahme der externen Nährstoffe und gleichzeitig steigender Nährstofflimitierung in den späteren Wachstumsphasen auch wieder abgebaut werden. Diese Dynamiken deuten darauf hin, dass die zwei untersuchten Inhibitoren an intrazellulären Prozessen beteiligt sind. Eine mögliche Beteiligung der Proteaseinhibitoren an der Speicherung von Stickstoff scheint dabei aufgrund meiner Ergebnisse wahrscheinlich und sollte zukünftig weiter untersucht werden.
Die Ergebnisse dieser Dissertation unterstützen das bereits vorhandene Wissen, dass M. aeruginosa vom anthropogenen Nährstoffeinträgen profitiert, und liefern zudem neue Erkenntnisse über den Einfluss von Umweltbedingungen auf Cyanobakterien, insbesondere mit Hinblick auf Proteaseinhibitoren. Diese Dissertation gibt einen Einblick in die funktionelle Rolle von Proteaseinhibitoren in Cyanobakterien, diskutiert aber auch die potentiellen ökologischen Auswirkungen, die mit Schwankungen des Gehalts von Proteaseinhibitoren einhergehen. Dabei könnten besonders nährstoffreiche Bedingungen zu einem Anstieg der cyanobakteriellen Biomasse und zugleich erhöhten Inhibitorgehalten führen, was eine potentielle Kontrolle von Cyanobakterien durch Daphnien verhindern und das Entstehen von Blüten begünstigen könnte. Daher sollten zum einen die Bemühungen zur Reduktion von Nährstoffen (Stickstoff, Phosphor) in Seen zukünftig weiter erhöht werden und zum anderen mehr Fokus auf die Gesamtheit der von Cyanobakterien produzierten Metabolite gelegt werden, um so die ökologischen Auswirkungen von cyanobakteriellen Blüten in der Zukunft zu minimieren.
Abstract
Cyanobacteria are photoautotrophic organisms that proliferate in lakes, ponds and estuaries under favorable conditions. The nutrient pollution of waterbodies, together with increasing temperatures and CO2 levels, has led to an increased frequency of cyanobacterial mass developments (‘blooms’) in the last decades, with severe economic and ecological consequences. Therefore, cyanobacteria became an important topic within limnological research. Special emphasis lies on two central question: Which conditions control the development of cyanobacterial blooms and what is the role of the variety of secondary metabolites produced by cyanobacteria in the success of cyanobacteria?
Some of those metabolites have proven to be toxic for other aquatic organisms, but have also detrimental effects on human health. Much research was focused on microcystins, one of the most toxic groups of cyanobacterial metabolites. Other secondary metabolites, such as protease inhibitors, have received less attention. Protease inhibitors, like nostpeption 920 and cyanopeptolin 954, specifically inhibit serine proteases, for example in the gut of the water flea Daphnia, which results in a limitation by amino acids and leads subsequently to other negative consequences (e.g. reduced growth). This in turn has detrimental effects on the whole ecosystem, because Daphnia are the main consumers of phytoplankton (including cyanobacteria) and serve additionally as food for a number of predators and are therefore essential for the transfer of nutrients and energy from the level of primary production to higher trophic levels. The investigation of protease inhibitors is therefore necessary to understand the development and consequences of cyanobacterial blooms. In particular, knowledge about the influence of environmental factors on cyanobacteria, their growth and the production of protease inhibitors is required.
This dissertation investigated the effect of three major environmental factors on the cyanobacterium Microcystis aeruginosa, one of the most common bloom-forming cyanobacteria. The fundamental question was: How do different concentrations of nitrogen and phosphorus as well as different light intensities affect the growth and more interestingly the production and content of protease inhibitors in M. aeruginosa? To answer this question, I performed growth experiments (batch cultures) with M. aeruginosa NIVA Cya 43 in which the cyanobacterium was grown at different initial nitrogen and phosphorus concentrations as well as under different light intensities. The cultures were sampled regularly to measure the growth, stoichiometry and the content of two protease inhibitors (nostopeptin 920 and cyanopeptolin 954) of M. aeruginosa. The samples were analyzed using a combination of classical (e.g.
microscopic cell counting) and modern analytic methods (e.g. high-pressure liquid chromatography and high resolution mass spectrometry). Additionally, I used mathematical
Abstract
10
models, including a new developed dynamic process-based model, to describe and analyze the growth and the dynamics of the protease inhibitor content.
In this dissertation, I showed that M. aeruginosa can grow under various experimental conditions and that in particular high nutrient concentrations and low light intensities support cyanobacterial growth. This thesis, furthermore, shows that the protease inhibitors are constitutively produced, but that the inhibitor content changes with the growth phase and the tested experimental conditions. Accordingly, I found coherences between the inhibitor content and the growth rate, respectively the stoichiometry, of the cyanobacterium. Additionally, I showed that protease inhibitors are especially produced under nutrient-rich conditions during the early growth phases, while they are degraded in the late growth phase, when the external nutrients are depleted and the nutrient limitation increases. These dynamics indicate that both investigated inhibitors are involved in intracellular processes. A potential involvement of protease inhibitors in the storage of nitrogen is, according to my results, plausible and should be investigated in the future.
The results of this dissertation support the already existing knowledge that M. aeruginosa benefits from the anthropogenic nutrient input and adds new insights about the influence of environmental factors on cyanobacteria, in particular on protease inhibitors. This dissertation also provides insights into the functional role of protease inhibitors in cyanobacteria, but also discusses the ecological consequences of changes in the protease inhibitor content. Especially nutrient-rich conditions will most likely result in an increase of the cyanobacterial biomass and a simultaneously increase in the inhibitor content, which will reduce the potential control of cyanobacteria by Daphnia and could promote the development of cyanobacterial blooms.
Hence, we should increase the efforts to reduce the nutrient input (nitrogen, phosphorus) into lakes and should additionally put more focus on the variety of metabolites produced by cyanobacteria to mitigate the ecological consequences of cyanobacterial blooms in the future.
General Introduction
Cyanobacteria – A success story
Cyanobacteria, also called blue-green algae, are photoautotrophic prokaryotes that have inhabited Earth for at least 2.4 billion years (Demoulin et al. 2019). During this time, they adapted to various habitats from oceans and freshwater lakes to even the most inhospitable habitats, like hot springs or hypersaline ponds (Whitton 2012). The conquest of these habitats was possible because cyanobacteria possess many special traits, such as the ability to regulate their buoyancy (Reynolds et al. 1987), a wide range of photosynthetic pigments, including the special phycobiliproteins (Saini et al. 2018), or the capability of some cyanobacteria to fix atmospheric N2 (Latysheva et al. 2012; Huisman et al. 2018). Additionally, some cyanobacteria are well protected against grazers, e.g. through the formation of colonies (Xiao et al. 2018) or the production of toxic metabolites (Hansson et al. 2007). Altogether, this led to the long standing success of cyanobacteria and permanent changes for the entire world.
Cyanobacteria were involved in the transformation of Earth´s atmosphere from an anaerobic to an aerobic state (Demoulin et al. 2019), are the progenitor of chloroplasts in all eukaryotic algae and higher plants (Cavalier-Smith 2002; Archibald 2009) and are an essential component in the global carbon and nitrogen cycle (Flores and Herrero 2005; Bergman et al.
2013; Fuchsman et al. 2019).
Cyanobacterial blooms – The role of humans and nutrients
Under favorable conditions, cyanobacteria and other algae groups mass-proliferate and form dense algae blooms. Globally the magnitude, frequency and duration of such blooms has increased in the last decades due to anthropogenic nutrient pollution, rising water temperatures and increasing CO2-levels (Kosten et al. 2012; O’Neil et al. 2012; Huisman et al.
2018; Glibert 2019). A prominent example is Lake Taihu, where the frequency and duration of blooms formed by the cyanobacterium Microcystis aeruginosa has increased dramatically in the last decades (Duan et al. 2009). In particular nutrient-rich manure and fertilizers, but also untreated sewage water and atmospheric N deposition, substantially contribute to the eutrophication of lakes, rivers and estuaries (Ebeling et al. 2002; Dumont et al. 2005; Harrison et al. 2005; Erisman et al. 2007; Robertson and Saad 2011). Due to an increasing world population, the usage of fertilizers has dramatically increased over the past century (Erisman et al. 2007; Glibert and Burford 2017) and is assumed to further increase, in particular for fertilizers containing urea (Glibert et al. 2014; Glibert et al. 2018). In some parts of the world, regulations of fertilizer usage and wastewater management will likely improve the situation (Glibert 2019), but the global demand for food, fuel and water is still on the rise, so that the
General Introduction
12
to the expansion of cyanobacterial blooms. As a consequence, ecological problems caused by cyanobacterial blooms, such as the suppression of submerged vegetation through shading or the killing of fish through hypoxia during the decay of blooms (Havens 2008; Huisman et al.
2018), will also continue and create tremendous economic costs as fishery, tourism and other important sectors are affected (Steffensen 2008; Sanseverino et al. 2016).
The productivity of aquatic systems and therefore the proliferation of cyanobacteria is usually limited by the availability of either nitrogen (N) or phosphorus (P). Both are essential to all organisms as they are required for the production of all major biomolecules (Conley et al.
2009; Tetu et al. 2009; Stal 2015) and a limitation by one of the nutrients consequently leads to the inhibition of essential processes, such as photosynthesis (Dong et al. 2019).
Traditionally, P is seen as the limiting factor in freshwater systems (Schindler and Fee 1974;
Schindler et al. 2008) and N as the limiting factor in marine ecosystems (Nixon 1995; Beman et al. 2005). But such generalizations are not valid for all systems, as studies show that P-rich lakes can be limited by N and that P limitation is common in open ocean areas (e.g. Tetu et al.
2009; Chaffin et al. 2013; Paerl et al. 2016). However, when massive amounts of nutrients are introduced into the system the natural limitation of cyanobacteria vanishes, resulting in their mass proliferation. This is further supported by traits that help cyanobacteria outcompete other algae. Cyanobacteria can for example use most N sources, including nitrate, urea, amino acids, and in some cases atmospheric N2 (Flores and Herrero 2005), and have a particular high affinity for reduced N forms, which are commonly used in fertilizers (Erisman et al. 2007;
Donald et al. 2011). Furthermore, nutrient pollution does not only increase the absolute nutrient concentrations, but shifts the stoichiometry towards lower N/P ratios (Elser et al. 2009; Glibert 2019). This is beneficial for cyanobacteria, as they prefer low N/P ratios and outcompete other algae under those conditions (Elser 1999). Additionally, cyanobacteria can take up more N and P than actually required for growth, a process called luxury consumption (Sterner and Elser 2008), and store those nutrients in the two storage compounds cyanophycin (Berg et al. 2000;
Flores et al. 2019) and polyphosphates (Jacobson and Halmann 1982; Solovchenko et al.
2019). This reduces the nutrient availability to other organisms, while allowing cyanobacteria to grow even when external nutrients are depleted. However, a major contributor for the dominance of cyanobacteria is their ability to produce a wide range of secondary metabolites.
Cyanobacterial Metabolites
Cyanobacteria produce several hundred known compounds (Welker and Von Döhren 2006; Gademann and Portmann 2008), for which cellular or ecological function are often unknown or under discussion. Some metabolites are known for their anti-grazer properties (DeMott et al. 1991; Agrawal et al. 2001), while other increase the fitness of cyanobacteria under oxidative stress (Zilliges et al. 2011; Schuurmans et al. 2018) or work allopathic by suppressing the growth of competing phytoplankton species (Leão et al. 2009; Pei et al. 2018).
The huge repertory of compounds generates special interest as those compounds could be utilized as potential drugs (Nagarajan et al. 2013). However, many cyanobacterial compounds have been proven toxic to animals (McBarron and May 1966; Backer et al. 2013; Davis et al.
2019) and humans (Jochimsen et al. 1998). With an increasing number of cyanobacterial blooms, the risk of exposure to such toxins increases as well, in particular when contaminated water is used for drinking or recreational purposes (Codd et al. 1999; Sanseverino et al. 2016).
Symptoms range from skin irritations to allergic reactions to organ failures (Jochimsen et al.
1998; Codd et al. 1999). Some diseases, like ALS or Alzheimer´s (Dunlop and Guillemin 2019), and certain forms of cancer (Fleming et al. 2002; Martínez Hernández et al. 2009) have also been related to cyanobacterial toxin exposure.
One of the most toxic metabolite groups are microcystins (MCs). MCs are cyclic heptapeptides, that are synthesized by a non-ribosomal enzyme complex (Tillett et al. 2000) and specifically inhibit protein phosphatases type 1 and 2A, leading to acute liver necrosis and consequently death (MacKintosh et al. 1990; Jochimsen et al. 1998). By now, more than 250 MCs congeners are known, of which MC-LR (Fig. 1 A) is the most common variant (Díez- Quijada et al. 2019). Due to their medical implications, their wide distribution among cyanobacterial taxa (Sivonen 2009) and their presence in cyanobacterial blooms worldwide (e.g. Vegman and Carmeli 2013; Bortoli et al. 2014; Beversdorf et al. 2017), MCs became the best studied group of cyanobacterial toxins. However, cyanobacteria produce several other metabolite groups, including protease inhibitors (PIs). Like MCs, PIs are non-ribosomal synthesized (Köcher et al. 2019), widespread among cyanobacteria (Rohrlack et al. 2005;
Gademann and Portmann 2008; Janssen 2019) and can be found in significant concentrations in surface waters (Beversdorf et al. 2017; Beversdorf et al. 2018). According to their structure, PIs are divided into several groups, of which cyclic depsipeptides with a 3-amino-6-hydroxy-2- piperidione (Ahp)-moiety are the most common (Namikoshi and Rinehart 1996; Köcher et al.
2019). This class of PIs includes more than 200 known compounds, including cyanopeptolins, most of which specifically inhibit serine proteases. Two cyanopeptolins are cyanopeptolin 954 (CP954, Fig. 1 B) and nostopeptin 920 (BN920). The latter was first isolated and structurally described from the cyanobacterium Nostoc sp. (Ploutno and Carmeli 2002), but was later also
General Introduction
14
congener CP954 (Von Elert et al. 2005). Both PIs are structurally identical, except that CP954 contains a chloride whereas BN920 does not (Fig. 1 B). Even though PIs are getting more attention in recent years (Janssen 2019), they were often considered as non-toxic (Neumann et al. 2000) and were therefore not in the focus of cyanobacterial research, so that many aspects concerning PIs are still unresolved.
An important aspect, that has been insufficiently studied, is the involvement of PIs in the interaction between cyanobacteria and zooplankton. Zooplankton, in particular Daphnia, is the major consumer of cyanobacterial biomass in most lakes and ponds and is capable of controlling cyanobacterial blooms (Elser 1999; Chislock et al. 2013), although cyanobacteria are in general considered a bad food source. Cyanobacteria contain only small amounts of nutritional molecules, such as polyunsaturated fatty acids and sterols (Ahlgren et al. 1992;
Müller-Navarra et al. 2000; Von Elert et al. 2003), and often form colonies and filaments that interfere with the filter apparatus of potential grazers (DeMott et al. 2001; Wejnerowski et al.
2017; Xiao et al. 2018). However, the production of potentially toxic metabolites, including PIs, makes cyanobacteria a particularly bad food source. Due to their detrimental effects on natural grazers, PIs might even be considered as a chemical defense of cyanobacteria. Despite the benefit of reducing the grazing pressure, the production of defensive metabolites is probably costly in terms of resources and energy, as assumed by the optimal defense theory (ODT, Rhoades (1979)), and might lead to a trade-off between defense and other processes, such as growth. This trade-off is potentially disadvantageous, in particular when energy (light) and resources (nutrients) are limiting, and might, for example, lead to growth reduction (Agrawal 1998; Briand et al. 2012). Thus a constitutive production of defensive PIs would be unfavorable and it would be beneficial for cyanobacteria to regulate their PI content depending on the actual grazing pressure. Such a inducible defense mechanism is supported by findings that actively grazing zooplankton (e.g. Daphnia) as well as chemical cues released during grazing both induce morphological and physiological changes in algae and cyanobacteria, including increased toxin contents (e.g. Hansson et al. 2007; Jang et al. 2007; Bergkvist et al. 2008).
Overall, the interaction between cyanobacteria and zooplankton is essential for the whole ecosystem, because the interface between phytoplankton and zooplankton is responsible for the transfer of carbon and energy from the level of primary producers to higher trophic levels (Müller-Navarra et al. 2000; Von Elert et al. 2003). The disturbance of this link due to the detrimental effects of cyanobacterial an their metabolites on zooplankton consequently affects the productivity of the rest of the ecosystem (Müller-Navarra et al. 2000; Von Elert et al. 2003;
García-Comas et al. 2016).
Figure 1. Chemical structure of microcystin-LR (A, Gademann and Portmann 2008) and the two protease inhibitors (B, Von Elert et al. 2005) nostopeptin 920 (BN920, R = H) and cyanopeptolin 954 (CP954, R = Cl).
Aim of this thesis
As described above, the massive inflow of nutrients into many aquatic systems promotes cyanobacteria and is therefore detrimental for the balance between phytoplankton and zooplankton. Additionally, studies have shown that the nutrient availability affects the production and content of MCs and other metabolites (e.g. Amé and Wunderlin 2005; Sevilla et al. 2010; Van de Waal et al. 2014), which is probably also the case for PIs and might therefore directly affect the toxicity of cyanobacteria. The carbon-nutrient balance hypothesis (CNBH, Bryant et al. 1983) assumes that the concentration of defensive secondary metabolites in plant tissue is primarily determined by the availability of carbon, light and nutrients and less by the grazing risk. This might equally be true for cyanobacteria, as one study already showed that cyanobacterial MC production followed the presumption of the CNBH (Van de Waal et al.
2009). However, the effects of major nutrients and other environmental factors on PI production and content in cyanobacteria are mostly unknown, because only a few studies (e.g. Tonk et al. 2009; Schwarzenberger et al. 2013) have targeted this topic. In this thesis, I therefore investigated three major environmental factors for their effect on the cyanobacterium Microcystis aeruginosa, which is the most common bloom-forming cyanobacterium in lakes and ponds (Sanseverino et al. 2016; Svirčev et al. 2019).
In chapter 1, the cyanobacterium M. aeruginosa NIVA Cya 43 was grown in batch-cultures at varying nitrate (NO3–) concentrations with the goal to understand how N availability affects growth, stoichiometry and PI content of M. aeruginosa. This particular cyanobacterial strain does not produce any MCs, but the two PIs BN920 and CP954 (Von Elert et al. 2005), which makes it an optimal candidate to investigate PIs without the influence of MCs. The N availability is an important factor for the synthesis of PIs, because PIs can be considered N-rich and their production therefore requires N. It was hypothesized that higher NO3– concentrations will promote the growth of the cyanobacterium and simultaneously lead to increased PI contents, while N limitation might result in growth inhibition and a decreased PI content. Throughout the
General Introduction
16
classical methods (e.g. microscopic cell counting) and modern analytical techniques (e.g. liquid chromatography - mass spectrometry (LC-MS)). This allowed me to not only measure PI contents at single time points, but to follow the dynamical changes in the PI content during the growth of M. aeruginosa. A logistical growth model was used to model cyanobacterial growth, what also allowed me to analyze the relationship between growth rate, estimated from the growth model, and PI content. Furthermore, stochiometric ratios of the cyanobacterial biomass were used as indication for possible nutrient limitation and tested for their effect on the PI content. Altogether, the results in this chapter indicate that increasing NO3– concentrations foster cyanobacterial blooms by supporting the biomass production and increasing the content of defensive PIs. Additionally, chapter 1 highlights the potential intracellular role of PIs in the storage of N.
Chapter 2 focused on another important nutrient that contributes to the eutrophication of freshwater systems: phosphorous. P promotes cyanobacterial blooms, but PIs do not contain P and their content might therefore be unaffected by the P availability. However, under P limitation, growth might become inhibited and N might be reallocated to the production of PIs, resulting in increasing PI contents. This hypothesis was tested in chapter 2, using the same experimental setup as described in chapter 1, with the exception that this time a range of phosphate (PO 3–) concentrations was tested. Additionally to the analyses performed in chapter 1, the PI content was not only compared between treatments but also between different growth phases (early exponential, mid-exponential and late growth), which showed that the effect of the P availability depends on the growth phase of M. aeruginosa. Overall, the results of chapter 2 indicate that P limitation supports higher PI contents and therefore increases the toxicity towards potential grazers.
Following the experimental studies in chapter 1 and 2, chapter 3 describes a new dynamic process-based model that was developed to describe how PI production and degradation were affected by the N and P availability. Different from the logistical growth models used in chapter 1 and 2, the new model does not only describe cyanobacterial growth but also the turnover in the PI concentration in dependence of the supplied nutrients. The model assumes that M. aeruginosa takes up N to produce either PIs or other N-containing compounds, e.g. proteins or storage compounds, until the extracellular N is depleted. Similar, P is also taken up and used for biomass production and other processes. At some point, either N or P starts limiting growth (Liebig’s minimum principle), so that biomass production stops. The assumption that PIs may serve as N storage was also implemented into the model. According to the model, Microcystis degrades the PIs when the extracellular N is depleted and reallocates the stored N to further growth. Chapter 3 highlights that mathematical models are a useful tool to analyze data from experimental studies and gain a deeper knowledge of the underlying processes. The results from this chapter support the assumption made in chapter 1, that PIs might be involved
in the storage of N and that both nutrient species and nutrient concentration affected the production, degradation and therefore the dynamics of PI found during the experiments.
In the final chapter, chapter 4, another environmental factor was investigated. Light provides the energy required for carbon fixation and therefore the production of all organic molecules, including PIs. Batch cultures of M. aeruginosa were grown at a range of light intensities, by covering the culture flasks with neutral density foil (ND-foil), which reduces the light intensity without affecting the light quality. According to literature, cyanobacteria are better adapted to low light intensities (e.g. Muhetaer et al. 2020), so that M. aeruginosa was expected to grow better at low light intensities. Accordingly, it was expected that the PI content will be higher at low light intensities. Chapter 4 shows that high light intensities can have detrimental effects on the growth of M. aeruginosa and that the light intensity affects not only the PI content but also the PI composition of the cyanobacterium. Furthermore, I discuss my results regarding their potential implications for the rest of the ecosystem.
In summary, this dissertation combined laboratory experiments with modern analytical methods and modeling approaches to broaden our understanding of how major environmental factors affect cyanobacteria, with emphasis on protease inhibitors. This thesis shows how the content of PIs is affected by tested conditions, provides insights into potential roles of PIs in intracellular processes and discusses the implications that changing PI contents might have on the entire ecosystem. In a world that is constantly changing due to human activities, understanding the principles that allow cyanobacteria to become dominant is essential for all efforts aiming to mitigate cyanobacterial blooms.
Chapter 1
Nitrate determines growth and protease inhibitor content of the cyanobacterium Microcystis aeruginosa
corresponds to the publication:
Burberg, C; Ilić, M; Petzoldt, T. & Von Elert, E. 2018. Nitrate determines growth and protease inhibitor content of the cyanobacterium Microcystis aeruginosa. J Appl Phycol 464, 37. DOI:
10.1007/s10811-018-1674-0.
1.1. Abstract
The eutrophication of lakes and ponds through anthropogenic nutrient input has resulted in higher frequencies of cyanobacterial blooms worldwide. The increased availability of nitrate (NO3–) plays an important role for the development of such blooms and also affects the content of secondary metabolites in cyanobacteria. Cyanobacterial protease inhibitors (PIs) are widespread, nitrogen (N)-rich metabolites that can be considered potential defense molecules, as they have detrimental effects on herbivorous zooplankton, the major consumer of cyanobacteria. In batch culture experiments, we investigated the effect of varying NO3– concentrations on the growth, stoichiometry, and PI content of the cyanobacterium Microcystis aeruginosa NIVA Cya 43, which synthesizes the two PIs nostopeptin 920 (BN920) and cyanopeptolin 954 (CP954). The dynamics of particulate organic nitrogen (PON) and the concentration of the two PIs indicate that BN920 and CP954 serve as temporary N storage compounds and are suggested to be degraded under N limitation. When related to the cyanobacterial biomass, the inhibitor content varied by more than 80% with NO3– concentration and time. The PI content increased with growth rate and N content of the cyanobacterium, which indicates that increased N availability supports higher cyanobacterial biomass with a higher content of defensive PIs. Therefore, increased NO3– concentrations foster cyanobacterial blooms directly by providing more nutrients and indirectly by increasing the negative interference of cyanobacteria with their consumers due to an increased content of PIs.
Keywords: Cyanobacteria – Eutrophication – Nitrogen – Nutrients – Secondary metabolites
1.2. Introduction
Over the last decades the number and frequency of toxic cyanobacterial blooms in freshwater systems has increased worldwide (Harke et al. 2016b). Under favorable conditions cyanobacterial genera, like Planktothrix, Anabaena or Microcystis, can form blooms with severe ecological and economic consequences, especially with regard to drinking water production (Steffensen 2008). Cyanobacterial blooms are an issue of concern because they dramatically change the ecosystem, e.g. by suppressing macrophytes or by fish kills (Paerl and Otten 2013). Additionally, many cyanobacteria produce a wide range of secondary metabolites of which many are toxic to other organism, including livestock and humans (Dittmann and Wiegand 2006; Gademann and Portmann 2008). Besides rising temperatures and CO2-levels, the main cause of cyanobacterial blooms is the eutrophication of water bodies due to anthropogenic nutrient input (Huisman et al. 2018). Traditionally, phosphorus (P) is considered the most limiting nutrient in freshwater systems, whereas nitrogen (N) is normally limiting the productivity of marine ecosystems (Schindler 1974; Xu et al. 2010). However, N limitation has also been reported for lakes, mainly when the availability of P is high (Dolman et al. 2012; Paerl et al. 2016).
Research on toxic cyanobacterial metabolites has mainly focused on microcystins (MCs), a group of cyclic heptapeptides that are produced by different cyanobacterial genera and which specifically inhibit protein phosphates type 1 and 2A, which renders them toxic to mammals and humans (MacKintosh et al. 1990; Runnegar et al. 1993). Several studies have shown that the production and the cellular content of MCs are affected by environmental factors, such as light, CO2, iron, temperature and sulphur (Wiedner et al. 2003; Amé and Wunderlin 2005;
Jähnichen et al. 2011). Nutrients, most importantly N and P, as well as their ratio are considered crucial factors determining the MC production (Downing et al. 2005; Van de Waal et al. 2009; Van de Waal et al. 2014). Van de Waal et al. (2009) found that the total cellular MC content increased with increasing nitrogen to carbon (C) ratio. This finding is in accordance with the carbon nutrient balance hypothesis (CNBH, Bryant et al. 1983), which predicts that C-rich metabolites are favored under nutrient limitation, whereas in nutrient-replete or C-poor environments more N-based metabolites are produced. Even though MCs are important from the perspective of human health, it was shown that Microcystis aeruginosa NIVA Cya 43 inhibited the growth of Daphnia, a key genus in freshwater systems, although NIVA Cya 43 does not contain MCs (Lürling 2003). Instead, this strain contains other secondary metabolites, like the two serine protease inhibitors (PIs) nostopeptin 920 (BN920) and cyanopetolin 954 (CP954), which chemically belong to the group of cyanopeptolines (Von Elert et al. 2005). PIs are depsipeptides that are present in many cyanobacterial taxa and have been found in high
Chapter 1
24
frequencies in blooms worldwide (Weckesser et al. 1996; Agrawal et al. 2001; Gademann and Portmann 2008).
Representatives of the genus Daphnia are the most important herbivores in freshwater plankton and play an important role in controlling cyanobacterial biomass (Chislock et al. 2013;
Urrutia-Cordero et al. 2015). In a study by Chislock et al. (2013), Daphnia reduced the biomass of a phytoplankton community dominated by cyanobacteria by over 70% even with high initial MC concentrations. In case of cyanobacterial PIs it was shown that they effectively inhibit trypsin and chymotrypsin, two classes of digestive proteases in the gut of Daphnia (Von Elert et al. 2004; Agrawal et al. 2005). The inhibition of proteases resulted in a reduced growth of Daphnia and was shown to increase the mortality of zooplankter in general and of Daphnia in particular (Agrawal et al. 2001; Rohrlack et al. 2004; Gademann et al. 2010; Von Elert et al.
2012). These negative effects on Daphnia suggest that PIs might reduce the control of Daphnia over the cyanobacterial biomass and thus may foster the development of cyanobacterial blooms.
The high prevalence and the negative environmental impact of cyanobacterial PIs makes it necessary to understand how the availability of nutrients affects the cyanobacterial production of PIs. Furthermore, the above mentioned effects of dissolved N on the MC content of cyanobacteria do not necessarily hold for cyanopeptolines, which are synthesized by a different synthetase complex than MCs (Tooming-Klunderud 2007). In this study we performed batch culture experiments with M. aeruginosa strain NIVA Cya 43, which produces the two PIs BN920 and CP954, to analyze the effect of different initial NO3– concentrations on growth, carbon to nitrogen (C/N) ratios and PI content of the cyanobacterium. The two PIs are relatively rich in N, an element that can be limiting for cyanobacteria. We hypothesized that a higher initial NO3– concentration will result in a higher growth rate, an elevated cyanobacterial biomass and a higher content of PIs in the biomass of Microcystis.
1.3. Material and Methods
1.3.1. Culturing conditions
The cyanobacterium Microcystis aeruginosa NIVA Cya 43 (NORCCA, Norwegian Institute for Water Research) does not produce any microcystins but contains two N-rich protease inhibitors (PIs): cyanopetolin 954 (CP954) and nostopeptin 920 (BN920, Von Elert et al. 2005).
The two PIs are structurally identical, except for that CP954 contains a chloride whereas BN920 does not. M. aeruginosa was grown in pre-cultures for 9 days in 1 L Erlenmeyer flasks filled with 400 mL modified WC medium (Guillard 1975) under constant light (45 ± 3 µE m-2 s-
1) at 20 ± 1°C on a horizontal shaker (90 rpm) with 500 µM initial nitrate (NO3–).
Experiments were performed with 500, 1000, 1500 and 2000 µM initial NO3– with four replicates each. 1 L flasks were filled with 400 mL of the respective medium, autoclaved and inoculated under sterile conditions with 1.5 ּ 105 cell mL-1 of M. aeruginosa from the pre-culture, which is similar to inocula used in similar studies before (Long 2001; Jähnichen et al. 2011).
The flasks were cultivated for 28 days and daily randomized to compensate for inhomogeneities in the light regime. Until day 22, samples (0.5 mL) were taken every 1 – 2 days to microscopically determine the cell density using a Neubauer improved counting chamber, and every 2 – 4 days volumes between 10 and 200 mL were taken for the determination of particulate organic carbon (POC) and nitrogen (PON) as well as for the extraction and quantification of the two PIs. An additional sample was taken after 28 days. The volume needed for the analyses was estimated from the cell density.
During the experiment the cultures were also checked for heterotrophic bacteria. The biovolume of the heterotrophic bacteria reached between 5.27 ± 0.98 % and 6.07 ± 0.98 % of the cyanobacterial biovolume. For the determination of the biovolume, samples were taken from the cultures, fixed with formaldehyde (2%) and filtered onto polycarbonate filters (Whatman). After staining the samples with 4′,6-diamidino-2-phenylindole (DAPI), heterotrophic bacteria and Microcystis cells were counted and their cell size was measured using a fluorescence microscope (Axio Lab.A1, Zeiss). Based on the cell abundance and the measured cell sizes the total biovolume of Microcystis and the heterotrophic bacteria in the cultures was calculated.
Chapter 1
26
1.3.2. Determination of POC and PON
For the determination of POC and PON a sample volume equivalent to approx. 0.5 mg POC was filtered on pre-combusted GF/F filters (Macherey & Nagel), which subsequently were dried at 60°C for at least 24 hours and then packed into tin capsules for the measurements using a Flash 2000 elemental analyzer (Thermo Fisher). The results were used to calculate the concentration of POC and PON in the cultures and to determine the molar C/N ratio of the cyanobacterial biomass.
1.3.3. Extraction and quantification of PIs
For the extraction of the two PIs from the cyanobacterial cells, samples (approx. 0.25 mg C) were centrifuged for 5 minutes at 15557 g or 4500 g respectively depending on the sample volume. The supernatant was discarded and 10 mL methanol (MeOH, 80%) were added to the cell pellet. The re-suspended pellets were sonicated for 7 minutes and then centrifuged for 3 minutes (4500 g). The supernatant was transferred into test tubes, evaporated to dryness using a vacuum centrifuge (RVC 2-25, Christ) and re-dissolved in 1 mL MeOH (100%). The samples were dried again, taken up in 100 µL MeOH, centrifuged for 2 minutes (20000 g). The supernatant was transferred into HPLC vials.
PIs were quantified using an ultra-high-pressure liquid chromatography system (UHPLC, Accela, ThermoFisher Scientific) coupled with an Exactive Orbitrap mass spectrometer (MS, ThermoFisher Scientific). The chromatographic separations was carried out on a C18-column (Nucleosil, 125/2, 100-3, Macherey and Nagel) as stationary phase and acetonitrile (A) and ultra-pure water (B), each containing 0.05% trifluoracetic acid (TFA), as mobile phase with the following gradient: 0 min: 20% A, 14 min: 100% A, 16 min: 100% A, 16.5 min: 20% A, 18 min:
20% A. The column temperature was set to 30°C, the flow rate was 300 µL min-1 and the injection volume of the sample was always 10 µL.
The MS was operated in positive scan mode using an electrospray ionization (ESI) source.
The source parameters were set as follows: spray voltage 4.5 kV, capillary temperature 325°C, capillary voltage 60 V, flow rate of sheath (N2) 40 a.u. and aux gas (N2) 15 a. u. Under these conditions BN920 and CP954 form two positively charged adduct ions ([M+H-H2O]+; [M+Na]+) with m/z = 903.46108 and 943.45331 (BN920 adducts) and m/z = 937.42211 and 977.41394 (CP954 adducts). The adducts of each PI were summed up to ´BN920´ and ´CP954´. The internal standard microcystin LR (MC-LR, Enzo Life Sciences), which was added at a final concentration of 1 µg mL-1 prior to the extraction, was measured at m/z = 995.55604 ([M+H]+).
All measurements were carried out at mass range of m/z = 120 – 1500 with a granted mass deviation of 10 ppm. Peak intensities were extracted from the chromatograms using the R-package ’enviMass‘ (Loos 2018) and converted to concentrations via previously established
calibration curves. Subsequently, the PI concentrations in the samples were normalized to the volume of the cultures or to extracted POC, as proxy for the cyanobacterial biomass.
1.3.4. Modeling and statistical analyses
All analyses were carried out using R (R Core Team 2018) and RStudio (RStudio Team 2016).
Microcystis was expected to show logistic growth, which is characterized by an initial exponential growth phase followed by a leveling off as the growth becomes limited by one or more resources, e.g. N, resulting overall in a sigmoidal (S shaped) growth curve. A logistic growth model was fitted to the POC or the cell abundance data using the R-package
‘growthrates‘ (Petzoldt 2017), to test if Microcystis grew logistically. The model equation was Nt = K' ⋅ N0 ⁄(N0 + K' – N0 ⋅ e –µmax ⋅ t)
with N0 as the initial biomass or cell abundance, Nt as the biomass or cell abundance at time (t) and the two model parameters carrying capacity (K´) and maximal growth rate (µmax).
K´ and µmax were tested for effects of the initial NO3– concentrations using one-way analysis of variances (ANOVAs) followed by Tukey HSD post hoc tests. Further, one-way ANOVAs were used to test for differences in the PON and PI concentration between the treatments and a two-way repeated measures ANOVAs was used to determine the effects of time and initial NO3– concentration on the PI content of the cyanobacterium. The assumptions of the ANOVA, approximate normal distribution and variance homogeneity, were checked using Shapiro- Wilk´s and Levene´s test, respectively.
Instantaneous growth rates for each sampling day were extrapolated from the model and correlated to the PI content to analyze the effect of growth rate on inhibitor content. A linear model was applied in case of BN920, while the content of CP954 was better described with a logistic model.
Chapter 1
28
1.4. Results
Batch culture experiments were performed to investigate the effects of different initial nitrate (NO3– concentrations in the medium on the growth performance, stoichiometry and content of the two N-rich secondary metabolites CP954 and BN920 in a strain of Microcystis aeruginosa that does not produce microcystins.
1.4.1. Growth of M. aeruginosa NIVA Cya 43 under different nitrate conditions
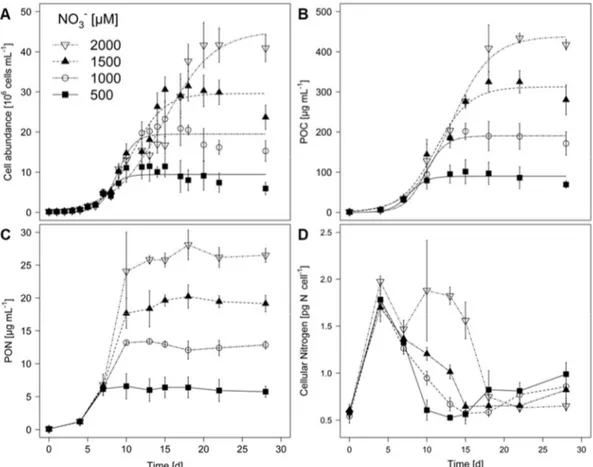
M. aeruginosa showed logistic growth under all tested NO3– concentrations, regardless whether growth was determined by cell abundances or particulate organic carbon (POC; Fig. 1 A & B). The carrying capacity (K´) was reached between days 10 and 21, depending on the treatment. K´ and maximal growth rate (µmax) were both affected by the initial NO3– concentration (Tab. 1 & 2). K´ increased with increasing NO3–concentration, whereas µmax in the two lower NO3– treatments exceeded those in the two higher NO3–concentrations.
The initial NO3– concentration significantly affected the particulate organic nitrogen (PON) concentration in the cultures at the end of the experiment (Fig. 1 C, one-way ANOVA:
F3,12 = 332.6, p < 0.001). After 28 days, the highest PON was found with the highest initial NO3– concentration, whereas the lowest PON was found in the lowest NO3– condition.
However, PON did not increase in any of the treatments after day 10. The nitrogen content per cell showed similar dynamics across all treatments, such that it peaked on day 4 and reached identical values towards the end of the experiments (Fig. 1 D). Cellular nitrogen quota decreased after day 4 in line with the increase of cell numbers (Fig. 1 A).
1.4.2. Intracellular inhibitor content of M. aeruginosa
M. aeruginosa NIVA Cya 43 produces the two PIs BN920 and CP954, which were measured in intervals of 2 – 4 days.
The dynamics of the concentrations of each PI differed from those of the cyanobacterial biomass. Both PIs were present in the batch cultures at all time points with maximal mean concentrations at day 10 of the experiments (Fig. 2). For BN920 the maximal mean concentrations ranged between 1.3 and 2.1 µg mL-1. The concentrations of CP954 were 4 – 5 times higher than those of BN920 with maxima between 4.8 – 10.8 µg mL-1. Remarkably, differences between the four treatments occurred only from day 10 onwards. On day 10, concentrations of both inhibitors were significantly different between the treatments (one-way ANOVA, BN920: F3,12 = 5.754, p = 0.0112; CP954: F3,12 = 14.04, p < 0.001): PI concentrations were significantly higher in the 1500 and 2000 µM treatment compared to the lowest NO3– treatments (Tukey HSD post hoc test, p < 0.05).
Figure 1. Cell abundance (A), particulate organic carbon (POC, B), particulate organic nitrogen (PON, C) and cellular nitrogen (D) in batch culture growth experiments of the cyanobacterium M. aeruginosa NIVA Cya 43 grown with 500 µM, 1000 µM, 1500 µM and 2000 µM initial nitrate (NO3–). Mean ± SD, n = 4. Curves in plot A and B were fitted using a logistic growth model. Equations and parameters are given in Tab. 1 and 2.
Table 1. The cyanobacterium M. aeruginosa NIVA Cya 43 was grown in batch cultures with 500 µM, 1000 µM, 1500 µM and 2000 µM initial nitrate (NO3–). The cell abundance was determined (Fig. 1 A) and used to model the growth of the cyanobacterium using the R-package ‘growthrates‘. Equation and R² are given for curve fits based on the mean cell abundance (n = 4). The growth parameters N0 (initial cell abundance), µmax (maximal growth rate) and K´ (carrying capacity) were determined for all replicates separately. Mean values (± SD) were calculated and the parameters µmax and K´ were tested for differences between treatments (Tukey HSD post hoc test after one-way ANOVA, p = 0.05). Capital letters indicate significant differences between treatments.
NO3–
[µM]
Equation a R² N0
[104 cells mL-1] µmax
[d-1]
K´
[104 cells mL-1]
500 N 6.77 ּ 10
7.2 ּ 10 9.4 ּ 10 e .
0.74 0.74 ± 0.52 1.00 ± 0.13 A 945 ± 267 A
1000
N 1.32 ּ 10
6.8 ּ 10 1.9 ּ 10 e .
0.91 1.02 ± 0.98 0.92 ± 0.19 A 1954 ± 124 B
1500
N 4.38 ּ 10
1.5 ּ 10 2.9 ּ 10 e .
0.93 13.19 ± 9.34 0.52 ± 0.08 B 2963 ± 333 C
2000
N 2.03 ּ 10
4.5 ּ 10 4.5 ּ 10 e .
0.95 44.32 ± 13.07 0.31 ± 0.02 B 4508 ± 437 D
a General equation: Nt = (K´ ּ N0) / (N0 + (K´ – N0) ּ e– µmax ּ t) with t = time [d], Nt = cell abundance at time t [cells mL-1].
Chapter 1
30
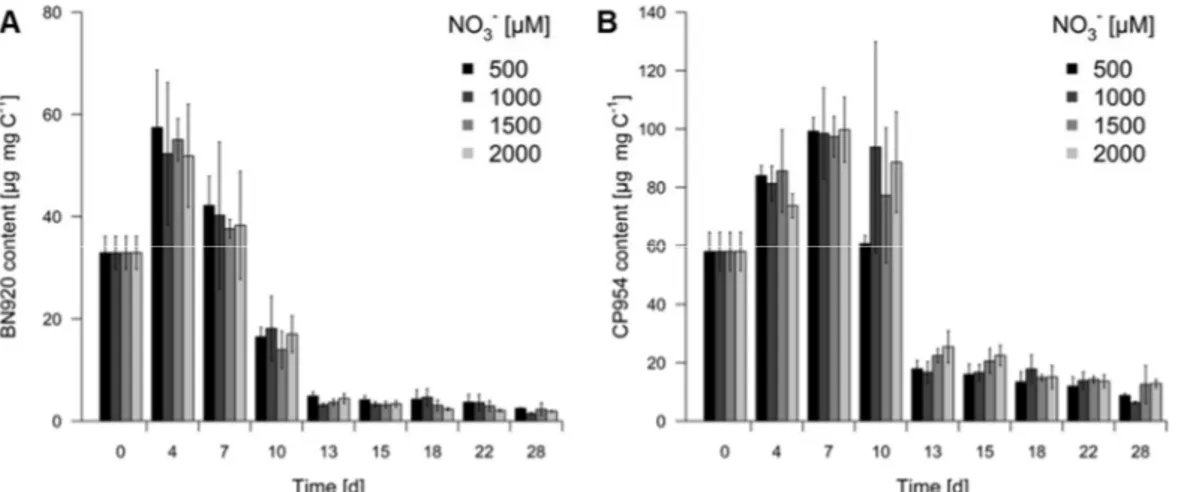
In order to determine the PI content of the cyanobacterium, values were normalized to the cyanobacterial biomass, measured as POC. The mean content of both PIs increased until day 4 (BN920) or day 7 (CP954) and declined thereafter to relatively low values for the rest of the experiment (Fig. 3). These low values were more than 95% (BN920) and 85% (CP954) lower than the maximal inhibitor content. Both, sampling date and the treatment affected the content of BN920 and CP954, and the significant interaction of treatment with sampling date indicating that the dynamics of PI content over time differed with initial NO3– concentration (Tab. 3).
Because there was a linear correlation between the biomass and cell abundance of Microcystis (R² = 0.9322), PI content per cell showed a similar pattern as the content per cyanobacterial biomass (data not shown). The cellular PI quota ranged from 16 to 527 pg cell-1 for BN920 and from 72 to 850 pg cell-1 for CP954.
Table 2. The cyanobacterium M. aeruginosa NIVA Cya 43 was grown in batch cultures with 500 µM, 1000 µM, 1500 µM and 2000 µM initial nitrate (NO3–). POC was measured as proxy for the cyanobacterial biomass (Fig. 1 B) and used to model the growth of the cyanobacterium using the R-package ‘growthrates‘. Equation and R² are given for curve fits based on the mean POC (n = 4). The growth parameters N0 (initial concentration of POC), µmax (maximal growth rate) and K´ (carrying capacity) were determined for all replicates separately. Mean values (± SD) were calculated and the parameters µmax and K´ were tested for differences between treatments (Tukey HSD post hoc test after one-way ANOVA, p = 0.05). Capital letters indicate significant differences between treatments.
NO3– [µM] Equation a R² N0 [µg C mL-1] µmax [d-1] K´ [µg C mL-1]
500 N 9.02
0.1 89.8 e .
0.79 0.12 ± 0.09 0.88 ± 0.09A 89.9 ± 23.1A
1000
N 24.49
0.13 190.3 e .
0.93 0.13 ± 0.11 0.83 ± 0.21A 191.1 ± 27.2B
1500
N 661.88
2.1 310.5 e .
0.95 1.88 ± 1.15 0.48 ± 0.08B 312.1 ± 26.9C
2000 N 1287
2.9 435.6 e .
0.97 3.53 ± 3.35 0.39 ± 0.06B 439.6 ± 12.9D
aGeneral equation: Nt = (K´ ּ N0) / (N0 + (K´ – N0) ּ e– µmax ּ t) with t = time [d], Nt = POC at time t [µg mL-1].
Table 3. Two-way ANOVAs with repeated measures performed for the content of nostopeptin 920 (BN920, in µg mg C-1) and cyanopeptolin 954 (CP954, in µg mg C-1).DF: Degrees of freedom, SS: Sum squares, MS: Mean squares, Test statistics: F- and p-value.
Inhibitor Source DF SS MS F p a
BN920 Treatment 3 0.9178 0.30593 5.538 0.0197 *
Day 8 215.67 26.959 181.7 < 0.001 ***
Treatment : Day 24 2.156 0.08982 2.144 0.00697 **
Residual 72 3.016 0.04189
CP954 Treatment 3 0.6756 0.22518 4.351 0.0374 *
Day 8 105.66 13.207 257.1 < 0.001 ***
Treatment : Day 24 1.874 0.07810 2.388 0.00244 **
Residual 72 2.355 0.03271
a Significance levels: * p < 0.05, ** p < 0.01, *** p < 0.001.
Figure 2. Concentration of the protease inhibitors nostopeptin 920 (BN920, A) and cyanopeptolin 954 (CP954, B) in batch culture growth experiments of the cyanobacterium M. aeruginosa NIVA Cya 43 grown with 500 µM, 1000 µM, 1500 µM and 2000 µM initial nitrate (NO3–
). Mean ± SD, n = 4. Asterisks denote significant differences in inhibitor concentration among treatments for the indicated day based on one-way ANOVAs (*p < 0.05, **p < 0.01, ***p < 0.001).
Figure 3. Content of the protease inhibitors nostopeptin 920 (BN920, A) and cyanopeptolin 954 (CP954, B) in batch culture growth experiments of the cyanobacterium M. aeruginosa NIVA Cya 43. The cyanobacterium was grown with 500 µM, 1000 µM, 1500 µM and 2000 µM initial nitrate (NO3–). Inhibitor content was normalized to the particulate organic carbon (mg C), as a proxy for the cyanobacterial biomass. Mean ± SD, n = 4.
1.4.3. Inhibitor content versus stoichiometry and growth rate
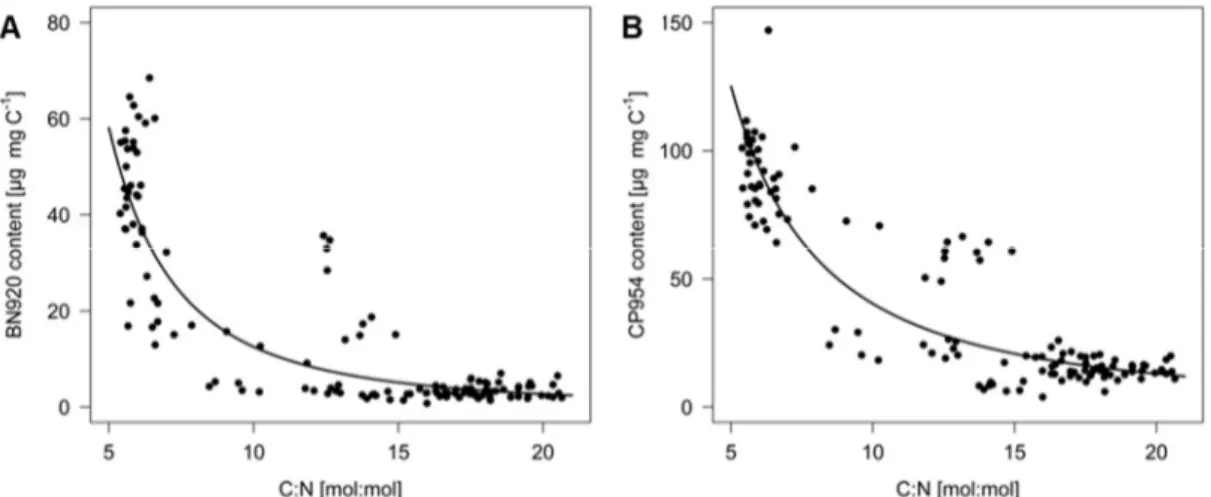
When the PI content of the cyanobacterial biomass was plotted as a function of the carbon to nitrogen (C/N) ratio of the cyanobacterium, the PI content was inversely related to the C/N ratio (Fig. 4), indicating that N depletion of the cyanobacterium resulted in decreased PI contents.
An inherent feature of logistic growth is the change of the instantaneous specific growth rate over time. Here the specific growth rates had been obtained from the logistic growth model based on the POC data (Fig. 1 B). In order to test for effects of growth, the content of the two cyanopeptolines in the cyanobacterium was plotted versus the respective growth rate. The content of BN920 increased significantly with the growth rate (Fig. 5 A, linear regression,