• Keine Ergebnisse gefunden

Using root cause analysis to handle intrusion detection alarms

N/A
N/A
Protected

Academic year: 2021

Aktie "Using root cause analysis to handle intrusion detection alarms"

Copied!
148
0
0

Wird geladen.... (Jetzt Volltext ansehen)

Volltext

(1)

to Handle

Intrusion Detection Alarms

Dissertation

zur Erlangung des Grades eines Doktors der Naturwissenschaften

der Universit¨at Dortmund am Fachbereich Informatik

von Klaus Julisch

Dortmund

2003

(2)

Prof. Dr. Heiko Krumm

(3)

Using Root Cause Analysis to Handle Intrusion Detection Alarms Klaus Julisch

IBM Zurich Research Laboratory S¨aumerstrasse 4

8803 R¨uschlikon, Switzerland e-mail: kju@zurich.ibm.com

In response to attacks against enterprise networks, administrators are increas- ingly deploying intrusion detection systems. These systems monitor hosts, net- works, and other resources for signs of security violations. Unfortunately, the use of intrusion detection has given rise to another difficult problem, namely the han- dling of a generally large number of mostly false alarms. This dissertation presents a novel paradigm for handling intrusion detection alarms more efficiently.

Central to this paradigm is the notion that each alarm occurs for a reason, which is referred to as the alarm’s root causes. This dissertation observes that a few dozens of root causes generally account for over 90% of the alarms in an alarm log. Moreover, these root causes are generally persistent, i.e. they keep triggering alarms until someone removes them. Based on these observations, we propose a new two-step paradigm for alarm handling: Step one identifies root causes that account for large numbers of alarms, and step two removes these root causes and thereby reduces the future alarm load. Alternatively, alarms originating from benign root causes can be filtered out. To support the discovery of root causes, we propose a novel data mining technique, called alarm clustering.

To lay the foundation for alarm clustering, we show that many root causes manifest themselves in alarm groups that have certain structural properties. We formalize these structural properties and propose alarm clustering as a method for extracting alarm groups that have these properties. Such alarm groups are gener- ally indicative of root causes. We therefore present them to a human expert who is responsible for identifying the underlying root causes. Once identified, the root causes can be removed (or false positives can be filtered out) so as to reduce the

i

(4)

future alarm load. We experimentally validate the proposed two-step alarm han- dling paradigm with alarms from a variety of different operational environments.

These experiments show that alarm clustering makes the identification of root

causes very efficient. Moreover, the experiments demonstrate that by judiciously

responding to root causes one can reduce the future alarm load by 70%, on the

average.

(5)

This thesis work began under the guidance of Prof. Marc Dacier, who at the time, was my manager at the IBM Zurich Research Laboratory. Prof. Dacier always gave me the feeling that my research was important and exciting, and he pushed me hard to get results early on. Moreover, I benefited greatly from his long expe- rience in the field. For all that, I thank you, Marc.

As companies do not award academic titles, I had to register as a PhD student at a university. When I presented my fledgling research project to Prof. Joachim Biskup, he saw value in it, and agreed to supervise me. Prof. Biskup has a natural talent for asking all the difficult questions, and while he pushed me hard to make progress with these questions, he also showed considerable understanding for my somewhat special situation as an external PhD student. He was always prompt in answering my questions, and generously allocated time for discussions with me.

Thanks to that, I could finish my thesis work before my contract at IBM expired.

Thank you, Joachim, is the least I can say.

I also thank my colleagues at the IBM Zurich Research Laboratory, all of whom have contributed to this thesis in one way or another. In particular, I thank Andreas Wespi, my current manager, for giving me a lot a freedom to work on my thesis. Dominique Alessandri and James Riordan have been wonderful friends and a great help in administering the Linux server, on which I ran my experiments.

I am very grateful to Birgit Baum-Waidner for her excellent comments on an earlier draft of this document. Finally, I thank Larry Oliver and Alex Wood of IBM Managed Security Services Delivery (formerly Emergency Response Team).

They supported me with their expertise, and shared real-world data with me, so that I could validate my thesis work.

Last but not least, I acknowledge the support from the European IST Project MAFTIA (IST-1999-11583), which is partially funded by the European Commis- sion and the Swiss Department for Education and Science.

iii

(6)
(7)

1 Introduction 1

1.1 Motivation . . . . 1

1.2 Thesis Statement and Contributions . . . . 2

1.3 Overview . . . . 3

1.4 Datasets Used in the Expriments . . . . 6

2 Related Work 11 2.1 On the Difficulty of Intrusion Detection . . . . 11

2.2 Root Cause Analysis . . . . 14

2.3 Data Mining . . . . 17

2.4 Alarm Correlation . . . . 24

3 Using Data Mining for Root Cause Analysis 31 3.1 Root Causes and Root Cause Analysis . . . . 31

3.2 Conceptual Problem Description . . . . 34

3.3 Approximation of Alarm Groups . . . . 38

3.4 Testing the Alarm Cluster Hypothesis . . . . 44

3.5 Experience with Episode Rules . . . . 50

4 Alarm Clustering 53 4.1 Introduction to Cluster Analysis . . . . 53

4.2 A Framework for Alarm Clustering . . . . 64

4.3 Algorithm for Alarm Clustering . . . . 72

4.4 Discourse on Background Knowledge . . . . 81

v

(8)

5 Cluster Validation 85

5.1 The Validation Dilemma . . . . 85

5.2 Cluster Validation Background . . . . 86

5.3 Validation of Alarm Clusters . . . . 93

6 Validation of Thesis Statement 99 6.1 An Illustrative Example . . . . 99

6.2 Experience with Alarm Clustering . . . 103

6.3 Alarm Load Reduction . . . 109

6.4 On the Risks of Filtering . . . 114

7 Summary and Outlook 117 7.1 Summary and Conclusions . . . 117

7.2 Future Work . . . 118

Bibliography 119

(9)

2.1 Fault propagation and alarm generation in networks. . . . 16

2.2 A rough classification of data mining techniques. . . . 19

2.3 Data mining process of building misuse detection systems. . . . . 23

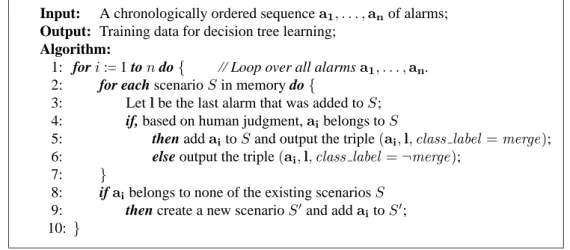
2.4 Algorithm for deriving training data from historical alarms. . . . . 29

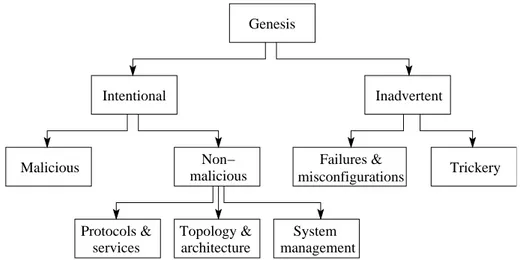
3.1 The genesis of root causes, or how root causes enter a system. . . 34

3.2 Entity relationship diagram of key concepts. . . . 35

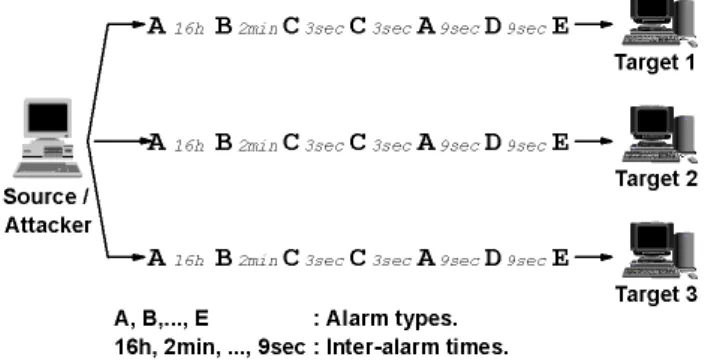
3.3 An attack tool being run against three targets. . . . 52

4.1 The K -means algorithm. . . . 57

4.2 A sample dendrogram and a partition it encodes. . . . 58

4.3 Network, alarm log, and hierarchies of the running example. . . . 67

4.4 Sample generalization hierarchies for time attributes. . . . 71

4.5 Example of reducing CLIQUE to alarm clustering. . . . . 73

4.6 Pseudo-code for the classic AOI algorithm. . . . . 75

4.7 Pseudo-code for the modified AOI algorithm. . . . 78

5.1 Example of valid clusters that have no intuitive interpretation. . . 87

5.2 A sample dataset, two cluster structures, and their sub-clusters. . . 96

6.1 Histogram showing the frequencies of different run-times. . . . . 106

6.2 Average run-times by alarm log size. . . 106

6.3 Average number of generalized alarms per IDS. . . 108

6.4 Histogram showing the frequency of different degrees of coverage. 109 6.5 Alarm load reduction for IDS 3. . . 111

vii

(10)

6.6 Alarm load reduction for IDS 6. . . 111

6.7 Alarm load reduction for IDS 10. . . 112

6.8 Alarm load reduction for IDS 14. . . 112

6.9 Average alarm load reduction per IDS. . . 115

(11)

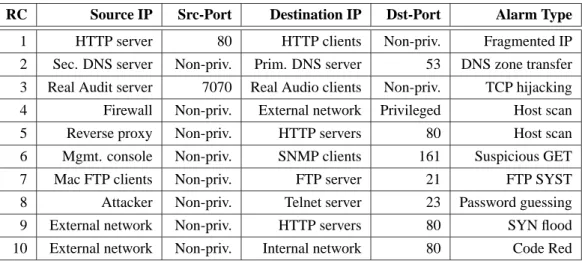
1.1 Illustration of alarms and generalized alarms. . . . 5 1.2 Overview of IDSs used in experiments. . . . . 7 3.1 The alarm patterns induced by ten sample root causes. . . . 41 3.2 Alarm logs that support the alarm cluster hypothesis (p=0.85). . . 48 4.1 Main characteristics of clustering methods. . . . . 62 4.1 Main characteristics of clustering methods (continued). . . . 63 6.1 Generalized alarms of the thirteen largest alarm clusters. . . 101

ix

(12)
(13)

Introduction

1.1 Motivation

Over the past 10 years, the number and severity of network-based computer at- tacks have significantly increased [6]. As a consequence, classic computer se- curity technologies such as authentication and cryptography have gained in im- portance. Simultaneously, intrusion detection has emerged as a new and potent approach to protect computer systems [14, 47]. In this approach, so-called In- trusion Detection Systems (IDSs) are used to monitor computer systems for signs of security violations. Having detected such signs, IDSs trigger alarms to report them. These alarms are presented to a human operator who evaluates them and initiates an adequate response. Examples of possible responses include law suits, firewall reconfigurations, and the fixing of discovered vulnerabilities.

Evaluating intrusion detection alarms and conceiving an appropriate response was found to be a challenging task. In fact, practitioners [29, 141] as well as re- searchers [13, 22, 37, 111] have observed that IDSs can easily trigger thousands of alarms per day, up to 99% of which are false positives (i.e. alarms that were mistakenly triggered by benign events). This flood of mostly false alarms makes it very difficult to identify the hidden true positives (i.e. those alarms that correctly flag attacks). For example, the manual investigation of alarms has been found to be labor-intensive and error-prone [29, 44, 141]. Tools to automate alarm inves- tigation are being developed [44, 48, 199], but there is currently no silver-bullet solution to this problem.

This thesis presents a new semi-automatic approach for handling intrusion de- tection alarms more efficiently. Central to this approach is the notion of alarm root causes. Intuitively, the root cause of an alarm is the reason for which it oc- curred. For example, consider a machine whose broken TCP/IP stack generates

1

(14)

fragmented IP traffic. This traffic will trigger “Fragmented IP” alarms on many IDSs. Here, the broken TCP/IP stack is the root cause of the respective alarms.

This thesis observes that for any given IDS, the majority of alarms can be at- tributed to one out of a small number of root causes. Moreover, many of these root causes are persistent and do not disappear unless someone removes them.

It is therefore argued that intrusion detection alarms should be handled by iden- tifying and removing the most predominant and persistent root causes. In that way, the future alarm load is reduced, and the human operator is freed to focus on the remaining alarms. Applied to the above example, this means to identify and fix the broken TCP/IP stack, which also eliminates the associated “Fragmented IP” alarms. To make this new alarm handling paradigm practical, we introduce a new data mining technique that — when applied to alarm logs — supports the discovery of root causes.

1.2 Thesis Statement and Contributions

This dissertation describes the work done to validate the following three-part the- sis statement:

(1) A small number of root causes is generally responsible for the bulk of alarms triggered by an IDS. (2) Root causes can be discovered efficiently by performing data mining on alarm logs. (3) Knowing the root causes of alarms, one can — in most cases — safely and significantly reduce the future alarm load by removing them or by filtering out the alarms that originate from benign root causes.

Part one of this thesis statement is a general observation about the nature of intrusion detection alarms, namely that only a few root causes account for the bulk of alarms. Part two states that root causes can be discovered efficiently, and part three says that knowledge of root causes is relevant because it enables countermea- sures that are effective in reducing the future alarm load. For example, a possible countermeasure is to fix root causes such as broken protocol stacks, compromised machines, or configuration faults (which some IDSs confuse with attacks). Alter- natively, one can filter out alarms that are known to result from benign (i.e. not security relevant) root causes. Finally, reducing the future alarm load based on one’s understanding of alarm root causes is claimed to be safe, meaning that it incurs a small risk of discarding true positives.

Note that the thesis statement implies a new paradigm for alarm handling. Ac-

cording to this paradigm, data mining should be used to discover root causes that

account for large numbers of alarms. Subsequently, removing these root causes

(15)

or judiciously filtering out their associated alarms will safely and significantly re- duce the number of alarms that are triggered in the future. The thesis statement guarantees that this approach is efficient, effective, and safe.

The proof of the thesis statement is constructive and experimental. A substan- tial fraction of this dissertation is concerned with deriving a data mining technique that supports the discovery of root causes. Subsequently, this data mining tech- nique is used in experiments with real-world intrusion detection alarms to validate the thesis statement. As Section 1.4 will point out, we are not in possession of representative data collections from all kinds of IDSs. Therefore the scope of our experimental validation is restricted by the available data.

The main ideas underlying this dissertation have been published in several ar- ticles [110, 111, 112, 113, 114] and two patents [42, 43]. The novel contributions can be summarized as follows:

The rule that a few root causes generally account for the majority of alarms is established.

We formalize the link between data mining and root cause discovery, in- vestigate the suitability of existing data mining techniques for root cause discovery, and develop a new, particularly suitable data mining technique.

We use the aforementioned data mining technique to show that root causes can be discovered in an efficient manner by analyzing alarm logs.

In extensive experiments with real-world intrusion detection alarms, it is shown that intrusion detection alarms can be handled safely and efficiently by identifying and responding to their root causes.

This dissertation offers the first high-level characterization of intrusion de- tection alarms and shows how it applies to the detection of attacks (cf.

Proposition 3.1 and Section 3.5.2).

To the field of data mining, we contribute a detailed case study for the suc- cessful application of its techniques (including episode rules, tests of cluster tendency, cluster analysis, and cluster validation).

1.3 Overview

Intrusion detection systems trigger alarms to report attacks. This dissertation mod-

els alarms as tuples over the Cartesian product dom(A 1 ) x . . . x dom(A n ), where

{ A 1 , . . . , A n } is the set of alarm attributes and dom(A i ) is the domain (i.e. the

range of possible values) of attribute A i . The alarm attributes (attributes for short)

capture intrinsic alarm properties, such as the source IP address of an alarm, its

(16)

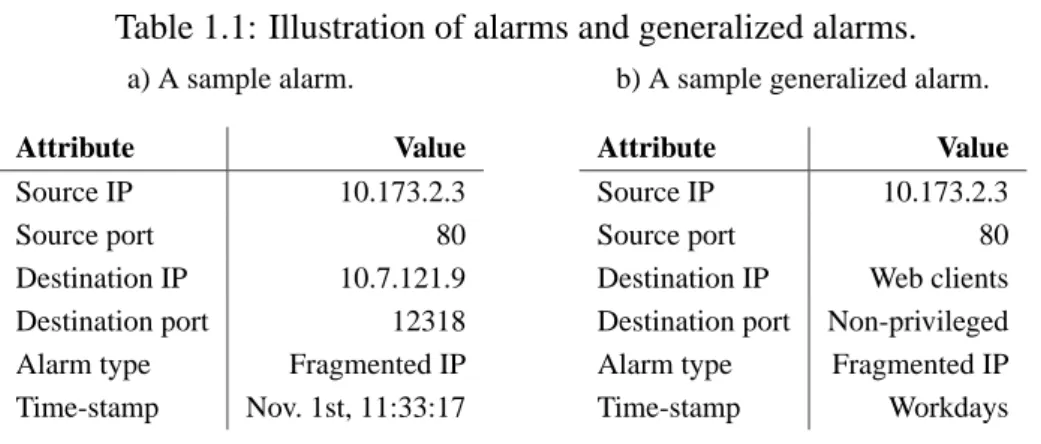
destination IP address, its alarm type (which encodes the observed attack), and its time-stamp. Finally, a[A i ] denotes the value that attribute A i assumes in alarm a. For example, Table 1.1(a) shows a sample alarm that reports a “Fragmented IP” attack being launched on Nov. 1st at 11:33:17 from the source 10.173.2.3 : 80 against the target 10.7.121.9 : 12318. Moreover, if a denotes the alarm of Table 1.1(a), then a[Time-stamp] = Nov. 1st, 11:33:17 holds.

At the core of this dissertation is a data mining technique called alarm clus- tering. The motivation for alarm clustering stems from the observation that the alarms of a given root cause are generally “similar” in a sense defined below.

Alarm clustering reverses this implication and groups similar alarms together, as- suming that these alarms also share the same root cause. For each alarm cluster (i.e. for each group of similar alarms), a single generalized alarm is derived. In- tuitively, a generalized alarm is a succinct and human-understandable pattern that an alarm must match in order to belong to the respective cluster. In practice, knowledge of generalized alarms vastly simplifies the discovery of root causes.

We therefore use alarm clustering to identify the root causes in real-world alarm logs. In doing so, we empirically validate the thesis statement. The following example is instrumental for a better understanding of alarm clustering.

Example 1 Let us reconsider the root cause of the broken TCP/IP stack, which was first introduced in Section 1.1. This time, we assume that the broken stack belongs to a popular Web server that is primarily used on workdays. Obviously, the resulting “Fragmented IP” alarms have the same source IP address (namely the IP address of the Web server, which we assume to be 10.173.2.3) and the same source port (namely 80). The target of the alarms are non-privileged ports of various Web clients. Furthermore, given that the Web server is mostly used on workdays, one will observe that the bulk of alarms occurs on workdays. Finally, note that “Fragmented IP” alarms are triggered each time that the Web server responds to a client request. Given our assumption that the Web server is popular and therefore heavily used, it follows that we are flooded by a large number of

“Fragmented IP” alarms.

The alarm clustering method developed in this dissertation groups the “Frag- mented IP” alarms together and reports them by saying that there are many alarms that are subsumed by the generalized alarm of “source 10.173.2.3 : 80 launching ’Fragmented IP’ attacks on workdays against non-privileged ports of Web clients”. Clearly, a generalized alarm like this facilitates the identification of root causes, even though complete automation is not achieved.

More formally, generalized alarms — just like ordinary ones — are tuples that

indicate for each attribute the corresponding attribute value. Thus, the generalized

alarm of the above example actually looks as shown in Table 1.1(b). Note that

(17)

Table 1.1: Illustration of alarms and generalized alarms.

a) A sample alarm. b) A sample generalized alarm.

Attribute Value Attribute Value

Source IP 10.173.2.3 Source IP 10.173.2.3

Source port 80 Source port 80

Destination IP 10.7.121.9 Destination IP Web clients

Destination port 12318 Destination port Non-privileged

Alarm type Fragmented IP Alarm type Fragmented IP

Time-stamp Nov. 1st, 11:33:17 Time-stamp Workdays

different from ordinary alarms, generalized alarms can have generalized attribute values. A generalized attribute value is an identifier that represents a set of ele- mentary values. For example, the generalized attribute value “Workdays” of Table 1.1(b) represents the set of elementary time-stamps that fall on workdays. Sim- ilarly, the generalized attribute value “Non-privileged” represents the set { 1025, . . . , 65535 } of non-privileged ports. Generalized attribute values like these are not allowed in ordinary alarms.

There are two important observations to be made about the above example:

First, the broken TCP/IP stack causes alarms that are similar in the sense that they are subsumed by the same generalized alarm. Second, the broken TCP/IP stack causes many alarms to be triggered. In other words, the broken TCP/IP stack is a root cause that manifests itself in a large group of similar alarms. This observation is central to the Chapters 3 and 4. More precisely, the remainder of this dissertation (excluding the related work in Chapter 2, and the conclusion in Chapter 7) is organized as follows:

Chapter 3 explains that data mining should ideally form alarm clusters whose constituent alarms are guaranteed to have the same root cause. Unfortu- nately, this goal is unattainable. Towards a weaker but feasible goal, we generalize the example of the broken TCP/IP stack and show that there is an important family of root causes that manifest themselves in large groups of similar alarms. Hence, we postulate that a data mining technique that identifies such large groups of similar alarms is likely to actually group alarms that have the same root cause. Therefore, cluster analysis, which per definition groups similar object, emerges as a promising data mining technique for root cause analysis.

Chapter 4 surveys the field of cluster analysis and shows that none of the popular

clustering methods is really suitable for root cause analysis. This raises the

need for a new clustering method, which is subsequently derived by modify-

(18)

ing the method of attribute-oriented induction. In a nutshell, the new clus- tering method seeks to identify alarm clusters that maximize intra-cluster similarity, while having a user-defined minimum size. Similarity is mea- sured via generalization hierarchies, which, for example, might state that the IP address 10.173.2.3 is a “Web server”, is a “Server”, is a “Machine”, etc. . Then, the alarms of an alarm cluster are all the more similar the closer their attributes are related by way of these generalization hierarchies.

Chapter 5 attempts to objectively measure the quality of alarm clusters. Objec- tive measures of cluster quality are desirable because they reduce the risk of a human user misinterpreting and consenting to meaningless alarm clus- ters. Cluster quality is studied in the field of cluster validation. Chapter 5 reviews this field, discusses its rather substantial limitations, and shows how the methods of cluster validation can nonetheless be used to increase our confidence in the results of the alarm clustering method.

Chapter 6 uses the alarm clustering method of Chapter 4 in experiments with real-world intrusion detection alarms. In doing so, we empirically validate the thesis statement given in the previous section.

1.4 Datasets Used in the Expriments

A preliminary remark on intrusion detection terminology is in order: IDSs are commonly classified into misuse detection systems and anomaly detection sys- tems [14]. Misuse detection systems (a.k.a. signature-based systems) such as STAT [102] use knowledge accumulated about attacks to detect instances of these attacks. Anomaly detection systems (e.g. IDES [109]) use a reference model of normal behavior and flag deviations from this model as anomalous and poten- tially intrusive. Another dichotomy splits IDSs according to their audit sources.

Specifically, host-based IDSs analyze host-bound audit sources such as operating system audit trails, system logs, or application logs, whereas network-based IDSs analyze network packets that are captured from a network.

The experiments in this dissertation use alarms from network-based, commer- cial misuse detection systems that were deployed in operational (i.e. “real-world”) environments. We consider it a strength of our validation that it uses alarms from real-world environments rather than from simulated or laboratory environments, which can have significant limitations [144]. We are not in possession of data col- lections from host-based or anomaly detection systems and therefore cannot offer experiments with these IDS types.

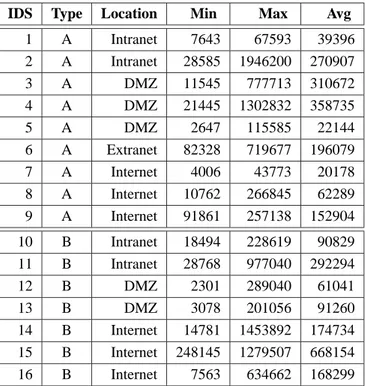
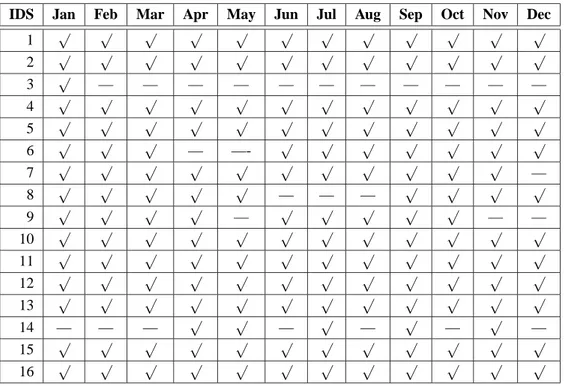
Table 1.2 introduces the sixteen IDSs that we use in the experiments of this

dissertation. Our selection criteria was to offer a representative mix of IDSs from

(19)

Table 1.2: Overview of IDSs used in experiments.

IDS Type Location Min Max Avg

1 A Intranet 7643 67593 39396

2 A Intranet 28585 1946200 270907

3 A DMZ 11545 777713 310672

4 A DMZ 21445 1302832 358735

5 A DMZ 2647 115585 22144

6 A Extranet 82328 719677 196079

7 A Internet 4006 43773 20178

8 A Internet 10762 266845 62289

9 A Internet 91861 257138 152904

10 B Intranet 18494 228619 90829

11 B Intranet 28768 977040 292294

12 B DMZ 2301 289040 61041

13 B DMZ 3078 201056 91260

14 B Internet 14781 1453892 174734

15 B Internet 248145 1279507 668154

16 B Internet 7563 634662 168299

different vendors in different operational environments. The sixteen IDSs are de- ployed at eleven different Fortune 500 companies, and no two IDSs are deployed at the same geographic site. All IDSs are configured and operated by profes- sional IDS analysts. The “IDS” column contains a numerical identifier that we use throughout this thesis to reference the IDSs. The “Type” column indicates the IDS type, namely “A” or “B”, both of which are leading commercial IDSs. To avoid unintended commercial implications, we do not reveal the product names or vendors of “A” and “B”. For each IDS, we employ all alarms that were triggered during the year 2001. The minimum, maximum, and average number of alarms per month are listed for each IDS in the “Min”, “Max”, and “Avg” columns, re- spectively. Finally, the “Location” column indicates where the IDSs are deployed:

Intranet: Denotes an IDS on an internal corporate network without Internet ac- cess.

DMZ: Denotes an IDS on a perimeter network that is protected by a firewall, but offers services to the Internet.

Extranet: Denotes an IDS on a network that is shared between multiple cooper- ating companies, but is not accessible from the Internet.

Internet: Denotes an IDS that is deployed before the external firewall on a direct

link to the Internet.

(20)

Despite continuing standardization efforts [60], there is no widely used format for intrusion detection alarms. In particular, the alarms of different IDSs do not necessarily have the same alarm attributes. However, the alarms of virtually all network-based IDSs contain the following key attributes, which are the only ones that will be used in the experiments:

1. The source IP address (source IP for short) which identifies the machine that launced the attack.

2. The source port from which the attack originated.

3. The destination IP address (destination IP for short) of the target machine.

4. The destination port at which the attack was targeted.

5. The time-stamp indicating the date and time of the attack.

6. The alarm type, which describes the nature of the attack. The alarm type can be a mnemonic name such as “Fragmented IP” or a number that maps to a name like this, or to a more verbose description of the attack.

7. The diagnostic context (context for short), which stores the supposedly ma- licious network packet. For example, the context frequently contains sup- posedly malicious URLs, or command sequences that seem to constitute FTP or Telnet exploits.

Attributes are commonly classified according to their type. The type of an at- tribute characterizes the structure of its domain. For example, numerical attributes have the real numbers R as their domain. Attribute types play an important role in data mining because they influence the applicability of data mining techniques.

Intrusion detection alarms contain attributes of many different types:

Categorical attributes: The domain of categorical attributes is discrete and un- ordered. Examples of categorical attributes include IP addresses and port numbers.

Numerical attributes: Examples of numerical attributes include counters (e.g.

for the number of SYN packets in a SYN flooding alarm), and size attributes (e.g. for the packet size in “Large ICMP Traffic” alarms [30]).

Time attributes: All alarms are time-stamped. Note that time should not be treated as a numerical attribute because this would mean to ignore its unique semantics (including notions such as periodicity, workdays versus week- ends, etc.).

Free-text attributes: Free-text attributes assume arbitrary and unforeseeable text

values. The context, for example, is a free-text attribute.

(21)

Alarms are stored in alarm logs. The experiments in this dissertation are such that they take an alarm log as input and return an analysis of this alarm log as output. In other words, the alarm log is our basic unit of analysis. It is therefore necessary to split the alarms of Table 1.2 into alarm logs. This can be done in many different ways. We have chosen to split the alarms along IDS and month boundaries, so that we obtain a total of (16 IDSs) × (12 months) = 192 different alarm logs. A corollary from this splitting is that alarms from different IDSs or from different months are never analyzed together because they do not fall into the same alarm log. Two factors were decisive for this splitting: First, analyzing alarm logs that span a prolonged time period such as a month allows us to discover long-term alarm patterns, such as weekly alarm patterns. Second, analyzing alarm logs that mix alarms from different IDSs seems pointless because the IDSs of Table 1.2 are deployed in completely independent environments. Therefore, any correlations between the alarms of these IDSs are mostly coincidental.

The notation and conventions used in this dissertation can be summarized as follows:

We model alarms as tuples over the n-dimensional attribute space dom(A 1 ) x . . . x dom(A n ), where dom(A i ) is the domain of attribute A i . The value that attribute A i assumes in alarm a is denoted by a[A i ].

The alarms in our experiments have the following attributes: The source IP address, the source port, the destination IP address, the destination port, the time-stamp, the alarm type, and the diagnostic context.

Our experiments are such that they take the alarms triggered by one IDS during one month as input and return an analysis of these alarms as output.

This text uses the following typeface conventions: Italic small letters (e.g.

x 1 , y 2 , z 3 , . . .) denote atomic values such as numbers or IP addresses. Bold small letters (e.g. a, ˆ a, b, . . .) denote tuples. Italic capital letters (e.g.

A 1 , Src − IP , L, C, . . .) stand for attribute names, sets, and partitions (i.e.

sets of sets).

In anticipation of Chapter 3, we remark that alarm logs will be modeled as multi-sets (a.k.a. bags or collections). We use pointed brackets for multi- sets (e.g. L 1 = <a, a, b>, L 2 = <b, c >) and re-define the set operators so that they take multiple occurrences of the same element into account.

Hence, for example, | L 1 | = 3, | L 2 | = 2, L 1 ∪ L 2 = <a, a, b, b, c>, L 1 *

L 2 , <a, a> ⊆ L 1 , etc. .

(22)
(23)

Related Work

This dissertation was motivated by the fact that today’s IDSs tend to trigger an abundance of mostly false alarms. It is therefore natural to ask for the reasons of this alarm flood. Section 2.1 addresses this question, and surveys research towards

“better” IDSs, which trigger less false positives. Section 2.2 introduces root cause analysis and shows how it has been used in network management. Section 2.3 sur- veys applications of data mining to intrusion detection. In particular, it describes earlier work that used data mining to render alarm investigation more efficient.

Section 2.4 concludes this chapter with a discussion of alarm correlation.

2.1 On the Difficulty of Intrusion Detection

This section puts the thesis work into context. Specifically, Section 2.1.1 explains why IDSs trigger so many mostly false alarms, and Section 2.1.2 summarizes work into “better” IDSs, which trigger less false positives.

2.1.1 Origins of the Alarm Flood

This section only considers the false alarm problem for misuse detection systems.

For these systems, the abundance of alarms in general, and of false positives in particular, can be attributed to three main factors:

Underspecified signatures: Underspecified signatures check conditions that are necessary, but not sufficient for attacks. As a consequence, they also trig- ger on benign events, which causes false positives. For example, instead of complex regular expressions that can reliably detect many attacks, it is not

11

(24)

uncommon to use simple string-matching signatures. There are four reasons for this practice: First, harsh real-time requirements generally preclude the use of precise signatures, which are more time-consuming to match against the audit data [103, 176]. Second, because of their higher generality, it is attractive to use underspecified signatures that also cover variations of attacks [37, 48]. Third, audit sources frequently lack information useful for misuse detection [175, 176]. That can make underspecified signatures inevitable. Fourth, writing intrusion detection signatures is inherently diffi- cult [122, 129, 157, 163], which favors the creation of buggy and possibly underspecified signatures.

Intent-guessing signatures: Intent-guessing signatures trigger on events that might or might not be attacks. For example, signatures that trigger on failed user logins, DNS zone transfers, overlapping IP fragments, or set URGENT bits are intent-guessing because they assume that these activities are mali- cious. It has been shown that this assumption is frequently false [19, 168].

Note that intent-guessing signatures are not underspecified as they reliably detect the events they claim to detect. However, these events are not neces- sarily attacks.

Lack of abstraction: Today’s IDSs tend to trigger multiple low-level alarms to report a single conceptual-level phenomenon. For example, a single run of the nmap scanning tool [72] triggers hundreds of alarms, namely one alarm for each probe. Similarly, a network with a small maximum transfer unit (MTU) [196] systematically fragments IP packets. Nevertheless, most IDSs trigger a separate alarm for each fragmented packet. Clearly, this lack of abstraction aggravates the alarm flood.

Axelsson has observed that the use of underspecified or intent-guessing sig- natures easily leads to an over-proportionally high number of false positives [13].

Just observe that these signatures are prone to trigger on non-intrusive events. Un- fortunately, non-intrusive events are so much more frequent than intrusive events that even their occasional misclassification can easily lead to an unacceptably high false alarm rate. This can be shown by using Bayes’ Theorem to rewrite the con- ditional probability P ( ¬ I | A) that an alarm A reports a non-intrusive event ¬ I (i.e.

that A is a false positive):

P ( ¬ I | A) = P ( ¬ I) · P (A |¬ I)

P ( ¬ I) · P (A |¬ I ) + P (I) · P (A | I) (2.1)

Assuming that the prior probability P ( ¬ I) of non-intrusive events is much

higher than the prior probability P (I) of intrusive events (say, P ( ¬ I) = 100 ·

(25)

P (I)), we obtain P ( ¬ I | A) ≥ P (A |¬ I)/(P (A |¬ I) + 0.01). Thus, a signature that is inclined to trigger on non-intrusive events (say, P (A |¬ I) = 0.1) will result in an unacceptably high rate of false positives (namely P ( ¬ I | A) ≥ 0.1/0.11 > 0.9, for the above numerical values). Axelsson argues that a 90% probability of an alarm being a false one is completely unacceptable as it schools the human operator to ignore the alarms altogether [13].

2.1.2 Towards Better IDSs

The intuitively most appealing way of dealing with false positives probably is to build “better” IDSs. This is no easy endeavor because many of the issues men- tioned in the previous section are intrinsically difficult to address. Nevertheless, there is a small number of research projects that have pursued this avenue. Inter- estingly, most of the resulting IDSs share two properties: First, they have public signatures that can be tuned to a given environment, and second they are special- purpose. Special-purpose IDSs are tailored towards detecting one class of attacks (e.g. Web server attacks) and they monitor audit sources that are particularly suit- able for this task. By way of illustration, here are three examples of IDSs that are less prone to false positives:

Embedded detectors: Zamboni [204] defines embedded detectors as host-based IDSs that are integrated into the source code of an application or the operat- ing system. Thus, embedded detectors are a form of source code instrumen- tation. One of their main advantage is their ability to access any information that they need to do their job. Moreover, embedded detectors are executed on demand, which is economical, and frees resources to be used otherwise, e.g. for more accurate signatures. Both advantages are expected to translate into fewer false positives [8, 204], but a rigorous proof is still amiss.

Web IDS: Almgren et al. describe a signature-based IDS for detecting Web server attacks in real-time [7]. The IDS is host-based and uses Web server logs as audit source. The attack signatures are a variant of regular expres- sions, and can easily be tuned to a particular environment. This customiz- ability was found to be helpful for reducing the number of false positives.

Special-purpose NIDS: Sekar et al. present a network-based IDS that exclu-

sively focuses on low-level network attacks, such as reconnaissance scans

and denial-of-service attacks [183]. The presented system differs from most

other network-based IDSs in that it refrains from any attempt to detect

application-level attacks such as attacks against Web servers. Owing to its

clear focus, the IDS is reported to have a very low false alarm rate.

(26)

Note that special-purpose IDSs such as the ones above have to be comple- mented by additional IDSs to achieve comprehensive attack coverage. This cre- ates the need to deploy and manage a heterogeneous collection of complementary IDSs. Even though this is mainly an operational problem, one should not under- estimate its practical difficulty and relevance. Moreover, none of the above IDSs addresses the difficulty of writing correct attack signatures. This is particularly evident for embedded detectors, which are integrated into the source code of the monitored program. Therefore, embedded detectors are more difficult to imple- ment, maintain, and port [204].

2.2 Root Cause Analysis

This section briefly surveys the field of root cause analysis. Specifically, Subsec- tion 2.2.1 introduces root cause analysis basics, and Subsection 2.2.2 shows how root cause analysis has been used in network management to identify faulty net- work equipment. The application of root cause analysis to network management is particularly relevant to this thesis because network management also faces the problem of an overwhelmingly large number of alarms.

2.2.1 Introduction to Root Cause Analysis

Root Cause Analysis (RCA) has historically been used to identify the most basic factors that contributed to an incident [128, 138, 167]. For example, after a reactor accident, the Department of Energy would commonly use root cause analysis to pinpoint why the accident had happened, so that similar accidents could be pre- vented in the future. Because prevention of similar accidents is central to root cause analysis, it has been required that root causes must be factors that one has control over. Hence, the following definition by Paradies and Busch [167]:

Definition 2.1 A root cause is the most basic cause that can reasonably be iden- tified and that management has control to fix. Root cause analysis is the task of

identifying root causes.

The three key words in the definition of root causes are basic, reasonably,

and fix: Root causes must be so basic (or specific) that one can fix them. On the

other hand side, given that fixing them is the whole point, it is not reasonable to

further split root causes into more basic causes. Consequently, these more basic

causes are not root causes, and root causes lie at the “highest” level where fixing

is possible. Finally, note that a single incident can have multiple root causes.

(27)

Several methodologies and supporting tools have been suggested for root cause analysis [128, 138]. Common to these methodologies is the notion that events propagate by causing other events. For example, a “poor-manufacturing- procedure event” causes a “buggy-fuel-gauge event”, which causes precipitous

“fuel-low-warning events”, which cause an “emergency-airplane-landing event”.

The majority of root cause analysis methodologies provide systematic and struc- tured frameworks for “walking back” such causality graphs to their roots. In addition, there are several computer tools to support these methodologies. See [128, 138] for details and examples.

2.2.2 Root Cause Analysis in Network Management

In network management [24, 98, 106, 107, 134, 164, 165, 202], alarms indicate problems in a network’s operation, such as hardware or software failures, per- formance degradations, or misconfigurations. As network components are highly inter-dependent, a problem in one component propagates to all transitively depen- dent components. As a consequence, a problem affecting any single component can impair many other components, most of which report their impairment by means of alarms. The goal of network management is to evaluate these alarms and to pinpoint the original problem. This problem is called the root cause, and fixing it clearly eliminates the associated impairments and alarms. Finally, the task of identifying root causes is called root cause analysis [107, 202]. These definitions are consistent with the ones of the previous section.

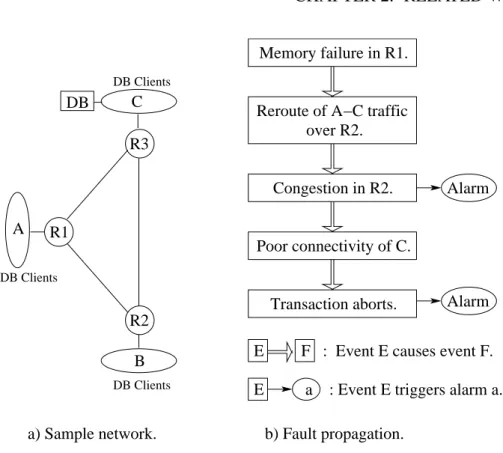
The example of Figure 2.1 illustrates the challenges of root cause analysis.

Figure 2.1(a) shows a network consisting of three routers (namely R1, R2, R3), three LANs (namely A, B, C), and a database server DB. The database clients are assumed to be distributed across all three LANs. Figure 2.1(b) shows how a problem in the memory module of router R1 propagates through the network.

Specifically, suppose that in router R1, the memory cell storing the cost of link

R1 → R3 fails, and erroneously indicates an extremely high value. No alarm is

issued for this event, but the routing protocol reacts by routing all future A −− C

traffic over router R2. As a consequence, router R2 becomes congested, which

results in alarms. Moreover, the connectivity of LAN C degrades and database

transactions by remote database clients last longer. This increases the number

of transaction aborts that are issued to release database locks that were held for

too long. The increased number of transaction aborts is reported by additional

alarms. Note that all alarms in this example report symptoms of the root cause

(the failed memory cell) rather than the root cause itself. Moreover, router R2 and

the database clients are likely to raise multiple alarms to report their impairment,

which can unleash an alarm flood. This tendency to generate too many alarms

(28)

DB

R3 C

DB Clients

R2 B

DB Clients

A R1

DB Clients

Memory failure in R1.

over R2.

Reroute of A−C traffic

Poor connectivity of C.

a) Sample network.

Congestion in R2.

Transaction aborts.

E a : Event E triggers alarm a.

E F : Event E causes event F.

Alarm

Alarm

b) Fault propagation.

Figure 2.1: Fault propagation and alarm generation in networks.

that are only remotely related to the actual root cause makes root cause analysis a challenging task.

In summary, root cause analysis in network management aspires to identify the starting point(s) of the fault propagation chain (cf. Figure 2.1(b)). This is an instance of the general problem of abductive inference [160, 165, 169, 170].

Abductive inference is the process of reasoning from effects to causes. Many net- work management systems do abductive inference in two steps: First, they model the cause-effect propagation in networks, and then, they heuristically search this model for plausible root causes that explain the observed alarms [24, 98]. Other systems require the user to encode his or her knowledge about root cause analysis in expert system rules [106, 107, 164]. Thereby, the problem of abductive infer- ence is off-loaded upon the user. Yet other systems implement root cause analysis by means of case-based reasoning [134] or codebooks [202].

Even though much research has investigated root cause analysis in network

management, this research is not directly applicable to intrusion detection. Specif-

ically, network management systems diagnose root causes by “walking back” the

fault propagation chain. In intrusion detection, this paradigm is difficult to apply

because the notions of causality and propagation are unclear. Moreover, network

(29)

management systems can only diagnose known root causes. However, this dis- sertation has introduced the root cause concept to intrusion detection, and at the outset, there were no known root causes. Therefore, we decided to develop a tool that supported the discovery of new and unexpected root causes, rather than a tool that recognized known root causes.

2.3 Data Mining

Advances in computers and data storage technology have made it possible to col- lect huge datasets, containing gigabytes or even terabytes of data. This wealth of data contains potentially valuable information. The trick is to extract this (hidden) valuable information, so that the data owners can capitalize on it. Data mining is a relatively new discipline that seeks to do just that. More precisely, and accepting that slightly different definitions have been proposed (e.g. [63, 90]), we adopt the following working definition [91]:

Definition 2.2 Data mining is the analysis of (often large) observational datasets to find unsuspected relationships and to summarize the data in novel ways that are

both understandable and useful to the data owner.

The relationships and summaries derived through a data mining exercise are often referred to as models or patterns. Examples include linear equations, clus- ters, tree structures, if-then rules, and periodic patterns.

The above definition refers to “observational data”, as opposed to “experi- mental data”. Data mining typically deals with data that has been collected for some purpose other than data mining. Thus, the objective of the data mining task could not influence the data collection strategy. This contrasts with statistics, where it is quite common to design experiments so that they yield the data needed to answer a specific question. Finally note that data mining aims at discovering

“understandable” relationships and summaries that can be interpreted as “novel”,

“unsuspected”, and “useful” knowledge. In other words, the goal of data mining is to offer new insights that are valuable to the data owner.

The algorithms that take data as input and produce models or patterns as output

are called data mining techniques. To make this thesis self-contained, we summa-

rize several particularly popular data mining techniques in Section 2.3.1. Section

2.3.2 shows how other researchers used data mining to make alarm investigation

more efficient. The Sections 2.3.3 and 2.3.4 summarize other, less closely related

applications of data mining to intrusion detection.

(30)

2.3.1 Classification of Data Mining Techniques

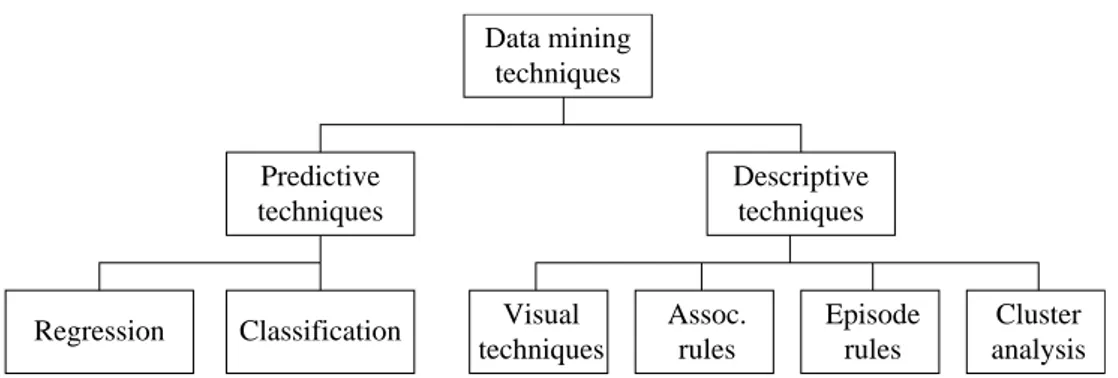
Data mining techniques are algorithms that extract patterns or build models from available datasets. There is no unique and universally accepted classification of data mining techniques. However, the classification shown in Figure 2.2 is con- sistent with most data mining texts (e.g. [90, 91]). Note that the figure is not exhaustive, and that many more leave nodes could have been added [90, 91].

A preliminary remark on input data representations is in order: Without loss of generality, we assume that the input data is stored in a single relational database table [59]. The columns of this table are called attributes and the rows are called tuples. Sets of transactions [3] and multidimensional data cubes [2] are other common input data representations in data mining. However, to simplify the pre- sentation, we do not consider these input data representations, here.

At the highest level, data mining techniques are split into predictive and de- scriptive techniques. Predictive techniques use examples, called training data, to learn a model that predicts the unknown value of one attribute (e.g. a person’s salary) based on the known values of other attributes (e.g. the person’s education, age, and employer). In other words, predictive techniques model the relation- ship between one designated attribute and all the other attributes. Descriptive techniques, by contrast, find patterns and summaries that describe a dataset in a human-understandable manner. No training data is needed, and all attributes are treated symmetrically (as opposed to singling out one particular attribute).

Predictive techniques are further sub-classified into regression and classifica- tion. In regression [53, 118], the attribute being predicted is real-valued, whereas in classification [38, 177] it is categorical, i.e. discrete and unordered. The values predicted by classification are referred to as class labels to emphasize that they have no numerical meaning. For example, a set of intrusion detection alarms that have been classified into true positives and false positives, can serve as training data to learn a classifier that predicts the class labels (“true positive” versus “false positive”) of future, previously unseen alarms. This classifier can be represented by means of if-then rules, decision trees, or some other structure [91, 155].

We next consider the sub-categories of descriptive techniques. Visual tech-

niques use colors, shapes, and animations to visually represent data in an easy-

to-understand manner [36, 171]. Association rules [3, 4, 190] capture implica-

tions between attribute values. More formally, association rules have the form

( ∧ m i=1 [A i = v i ]) = ⇒ ( ∧ n i=m+1 [A i = v i ]) [s, c], where the A i (i = 1, . . . , n) are

pairwise distinct attributes, the v i are attribute values, and the numbers s, c ∈ R +

(called support and confidence) are descriptive statistics. This rule is interpreted

as: “Database tuples that satisfy the rule’s left-hand side have a c% probability to

also satisfy the right-hand side. Moreover, s% of tuples satisfy both sides.”

(31)

Predictive techniques

Classification Regression

Descriptive techniques

rules Assoc.

Visual techniques

Episode rules

Cluster analysis techniques

Data mining

Figure 2.2: A rough classification of data mining techniques.

Note that association rules capture relationships between the attributes of a single database tuple. Episode rules [142, 143], by contrast, capture relation- ships between successive tuples. This clearly presupposes that tuples are ordered, e.g. by virtue of a time attribute. Assuming that an order exists, episode rules have been defined as implication rules that predict the occurrence of certain tu- ples based on the occurrence of other tuples. For example, assuming that tuples represent intrusion detection alarms, an episode rule might state that in 50 percent of all cases, an “Authentication failure” alarm is followed within 30 seconds by a

“Guest login” alarm. We will formally define episode rules in Section 3.5.

Cluster analysis (a.k.a. clustering) [81, 104, 105] seeks to group tuples so that the tuples within a given group/cluster are similar, whereas the tuples of different groups/clusters are dissimilar. Obviously, the notion of similarity is key to this definition. In Euclidean spaces, similarity is relatively easy to define [105]. For example, the inverse of the Euclidean distance is a possible similarity measure.

Moreover, this measure captures our intuition that a cluster is an isolated and compact “cloud” in space. In non-Euclidean spaces, categorical attributes such as IP addresses or port numbers significantly complicate the definition of similarity [74, 84]. Chapter 4 has much more to say about cluster analysis. Finally, there are several good textbooks that can be consulted for a broader and more detailed treatment of data mining concepts and techniques [20, 90, 91].

2.3.2 Using Data Mining for Alarm Handling

This section surveys research projects that used data mining to support the inves- tigation of alarms. First, however, recall the distinction between alarms and alarm types: Alarms are the messages that an IDS triggers to report security violations.

The alarm type, by contrast, is the attribute that specifies the actual security vi-

olation (e.g. SYN flooding, host scanning, buffer overflow, etc.) reported by an

alarm. Also recall that t[A i ] denotes the value that attribute A i assumes in tuple t.

(32)

Manganaris et al. mine association rules to build a “second-level” anomaly de- tection system that discards “normal” alarms and thereby reduces the work-load of the operator [141]. Implicitly, this work assumes that “normal” alarms are always false positives. The reference model of normal alarm behavior is learned in two steps. First, a time-ordered stream of historical alarms is partitioned into bursts, and second, association rules are mined from these bursts (more on this later).

The resulting association rules constitute the reference model of normal alarm be- havior. At runtime, alarms are compared against this reference model, and alarms that are consistent with it are considered normal/benign and get discarded.

More precisely, Manganaris et al. model alarms as tuples (t, A), where t is a time-stamp and A is an alarm type. All other alarm attributes such as source IP address, destination IP address, or port numbers are not considered in their model.

Alarm bursts are sets of alarms that are separated by prolonged alarm-free periods.

Internally, alarm bursts are represented as tuples that have one attribute A i for each possible alarm type A i . Specifically, let B be an alarm burst, and let b be its internal representation. Then, b[A i ] = 1 holds if and only if B contains an alarm of type A i , and b[A i ] = 0, otherwise. Note that this representation suppresses all temporal information about alarms. The tuples representing the alarm bursts are mined for association rules of the form ( ∧ i∈I [A i = 1]) = ⇒ ( ∧ j∈J [A j = 1]), with disjunct index sets I and J (i.e. I ∩ J = ∅ ). Association rules about non-existing alarm types (e.g. [A 1 = 1] = ⇒ [A 2 = 0]) are explicitly not searched for.

The set of discovered association rules is used without any inspection or mod- ification as the reference model of normal alarm behavior. At run-time, deviations from this model are detected as follows: The incoming alarm stream is partitioned into alarm bursts, and each alarm burst is considered by itself. Various tests are used to decide whether an alarm burst B is anomalous. For example, suppose the reference model contains the association rule ( ∧ i ∈ I [A i = 1]) = ⇒ ( ∧ j ∈ J [A j = 1]).

Moreover, let us assume that alarm burst B contains all the alarm types A i (i.e.

∀ i ∈ I : A i ∈ B), but lacks some of the A j (i.e. ∃ j ∈ J : A j 6∈ B ). Then, alarm burst B is deemed anomalous as it does not contain all A j s, which would have been expected based on the rule ( ∧ i∈I [A i = 1]) = ⇒ ( ∧ j∈J [A j = 1]). Only ano- malous alarm bursts are reported to the operator, while normal ones are discarded.

Note that this approach incurs a potentially high risk of discarding true posi- tives. In fact, the set of discovered association rules is blindly used as reference model. As a consequence, association rules that correspond to attacks can creep into the reference model and thereby prevent future detection of these attacks. On the other hand side, given that reference models can contain thousands of associa- tion rules [141], it does not seem practical to manually inspect them before usage.

The alternative approach of using attack free alarm logs to learn the association

rules seems equally difficult to implement [112].

(33)

Clifton and Gengo use data mining to find alarm patterns that a human ex- pert can understand and act upon [37]. More precisely, they mine episode rules from historical alarm logs, and use these episode rules to guide the construction of custom-made filtering rules, which automatically discard well-understood false positives. Clifton and Gengo offer hardly any experiments to validate their ap- proach. We therefore replicate their experiments in Section 3.5 and come to the conclusion that episode rules are not particularly suitable in this context. This motivates our work on clustering, which is the main focus of this thesis. Nev- ertheless, their and our work are obviously related because both mine historical alarm logs in quest for human-understandable patterns.

In the world of telecommunication networks, Klemettinen uses association rules and episode rules to support the development of alarm correlation systems [119]. Hellerstein and Ma pursue the same goal by means of visualization, pe- riodicity analysis, and m-patterns (a variant of association rules requiring mutual implication) [94]. Garofalakis and Rastogi investigate bounded-error lossy com- pression of network management events [75]. These research projects as well as our own experiments [110, 114] have convinced us that visualization, episode rules, and association rules are too demanding (in terms of time and human ex- pertize) to be used on a larger scale. This has further motivated our work on clustering. To the author’s knowledge, the idea of applying clustering to intrusion detection or network management alarms was new at its time of introduction.

2.3.3 The MADAM Approach for Building IDSs

The MADAM ID project at Columbia University [129, 131, 132] is one of the first and best-known data mining projects in intrusion detection. Therefore we briefly survey this project, here. The contents of this section is optional and is not required for an understanding of later chapters.

The MADAM ID project has shown how data mining techniques can be used

to construct IDSs in a more systematic and automated manner than by manual

knowledge engineering. Specifically, the approach pursued by MADAM ID is

to learn classifiers that distinguish between intrusions and normal activities. Un-

fortunately, classifiers can perform really poorly when they have to rely on at-

tributes that are not predictive of the target concept [130]. Therefore, MADAM

ID proposes association rules and episode rules as a means to construct additional,

more predictive attributes. In the terminology of MADAM ID, these additional at-

tributes are called features.

(34)

MADAM ID has been most extensively documented for the case of building network-based misuse detection systems. Therefore, this section also describes MADAM ID in the context of network-based misuse detection. Note, however, that there have been experiments in applying MADAM ID to anomaly detection as well as to host-based misuse detection [129]. Because of space limitations, these experiments are not described here.

Let us now consider how MADAM ID is used to construct network-based misuse detection systems. The base version of MADAM ID that we discuss here does not consider the packet payload of network traffic. Indeed, all network traffic is abstracted to so-called connection records. The attributes of connection records store intrinsic connection characteristics such as the source IP, the destination IP, the source and destination ports, the start time, the duration, the header flags, etc. . In the case of TCP/IP networks, connection records summarize TCP sessions.

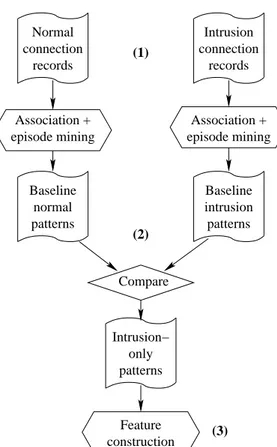
The most notable characteristic of MADAM ID is that it learns a misuse de- tection model from examples, called training connection records. Training con- nection records are connection records that have been classified into normal con- nection records and intrusion connection records. Given a set of training con- nection records, MADAM ID proceeds in two steps: The feature-construction step augments the connection records by additional attributes that are deemed to be relevant for distinguishing intrusions from normal activities. For example, this step might add a new attribute that counts the number of connections that have been initiated during the preceding two seconds to the destination IP address of the current connection record. The feature-construction step is followed by the classifier-learning step, which learns a classifier from the augmented training connection records (i.e. the original training connection records extended by the newly constructed attributes). Figure 2.3 illustrates the process in more detail:

(1) The user of MADAM ID procures training connection records and partitions them into normal connection records and the intrusion connection records.

MADAM ID offers no support for this step.

(2) Association rules and episode rules are mined separately from the normal connection records and from the intrusion connection records. The resulting patterns are compared, and all patterns that are exclusively contained in the intrusion connection records are collected to form the intrusion-only patterns.

(3) The intrusion-only patterns are used in a mostly automatic procedure to

derive additional attributes, which are expected to be indicative of intrusive

behavior. These additional attributes are counts, averages, and percentages

over connection records that share some attribute values with the current

connection record.

(35)

Baseline normal patterns

Baseline intrusion patterns Normal

connection records

Compare

Intrusion−

only patterns

Feature construction

Intrusion connection

records

(4) Augmented

connection normal &

intrusion records

Classifier Learning

Misuse IDS Association +

episode mining

Association + episode mining

b) Classifier−learning step.

a) Feature−construction step.

(1)

(2)

(3)

(5)

Figure 2.3: Data mining process of building misuse detection systems.

(4) The original training connection records are augmented by the newly con- structed attributes.

(5) A classifier is learned that distinguishes normal connection records from intrusion connection records. This classifier — the misuse IDS — is the end product of MADAM ID.

It is worth pointing out that the MADAM ID process of Figure 2.3 heavily

relies on intrusion detection expert knowledge. For example, expert knowledge

is used to prune the number of patterns produced during association and episode

rule mining. Also, feature construction is restricted to adding attributes that an in-

trusion detection expert would consider promising. Moreover, separate classifiers

are constructed for different attack classes, and these classifiers are subsequently

combined. Finally, domain knowledge is used to manually define suitable features

that summarize the packet payload. These more advanced aspects of MADAM ID

are described elsewhere [129, 131, 132].

(36)

2.3.4 Further Reading

In this section, we briefly survey other related work that applied data mining to intrusion detection. A more detailed overview of the field can be found in a recent book edited by Barbar´a and Jajodia [17].

The vast majority of researchers have used data mining to build non- parametric models for anomaly detection. This is very similar to early work in intrusion detection, except that normal behavior is represented by models based on data mining rather than statistics [109, 188]. For example, Wisdom & Sense is an anomaly detection system that mines association rules from historical audit data to represent normal behavior [198]. Similarly, Teng et al. use a form of au- tomatically learned episode rules to represent normal user behavior [197]. The idea of Lankewicz and Benard is to cluster audit log records and to represent each cluster by a single “typical” audit log record. These typical audit log records form the model of normal behavior against which future audit log records are com- pared [126]. A similar idea has been pursued by Lane and Brodley, who cluster attack-free shell command sequences and define the “cluster centers” to represent normal behavior. Subsequently, anomalous command sequences can be detected based on their distance to the cluster centers [125]. Portnoy et al. cluster histori- cal connection records and label large clusters as “normal” and small clusters as

“abnormal” [173]. At run-time, new connection records are classified according to their distance to the closest labeled cluster. Barbar´a et al. use incremental asso- ciation rule mining to detect anomalous network traffic patterns in real-time [18].

Finally, there is a long list of research projects that have tried to model system call sequences by a variety of different models, including neural networks, hid- den Markov models, as well as fixed and variable length patterns. The work by Warrender et al. [201] and Debar et al. [46] is representative of this research.

Mukkamala et al. present work that does not fall in the category “data-mining- based anomaly detection”. Their idea is to use data mining techniques to reduce the amount of audit data that needs to be maintained and analyzed for intrusion detection [158]. Lam et al. report similar work in audit data reduction [123].

2.4 Alarm Correlation

Alarm Correlation Systems (ACSs) [40, 41, 44, 48, 191, 199] post-process intru-

sion detection alarms in real-time and automate part of the alarm investigation

process. More precisely, ACSs attempt to group alarms so that the alarms of the

same group pertain to the same phenomenon (e.g. the same attack). Then, only

the alarm groups are forwarded to the human operator. In that way, ACSs offer

Abbildung

Table 1.1: Illustration of alarms and generalized alarms.
Table 1.2: Overview of IDSs used in experiments.
Figure 2.1: Fault propagation and alarm generation in networks.
Figure 2.2: A rough classification of data mining techniques.
+7

Referenzen

ÄHNLICHE DOKUMENTE

In this paper, I examine the root cause of sovereign default on the basis of a model of inflation that is built on a micro- foundation of government behavior and conclude that the

Turning to the temperature relaxation experiments shown in Figure 5 the relaxation time-scale of 10 h is comparable to τ θ so that it would be expected that the tropical

Safety related specification errors come into existence through accidents or incidents with undesired outcome: A root cause analysis may lead to corrections of the specifica- tion

a certain graph, is shown, and he wants to understand what it means — this corre- sponds to reception, though it involves the understanding of a non-linguistic sign;

The second part of the report turns to some less-examined aspects of R2P ‘root cause’ prevention: the intrusive nature of such prevention, the central role of states in the

To maintain the general nature of supported analysis tasks by the server and the models, there is no combination on the server side of the Fourier transform and the wavelet transform

Second, because paid apps are important to smartphone users, using paid apps for free is a main reason for jailbreaking, a reason more decisive among Android users than Apple

Fremdfirmenmanagement in Europa und wie man aus Fehlern klug wird Katrin Weißenborn, E.ON Kraftwerke GmbH. Im Rahmen des Einsatzes von internationalen Unternehmen bei