1
SERVICEGAP Discussion Paper No. XX
Professional Business Services and their Role in the EU Economy
Measuring ‘Knock-on’ Effects
November 2012
Iain Paterson* and Richard Sellner*
* Institute for Advanced Studies, Vienna, Austria
Corresponding Author: Iain Paterson (paterson@ihs.ac.at)
This paper was developed as part of Deliverable 2.3 of SERVICEGAP “Papers on linkages between manufacturing and services, regulation in professional services and banks”
SERVICEGAP project is funded by the European Commission, Research Directorate General as part
of the 7th Framework Programme, Theme 8: Socio-Economic Sciences and Humanities. Grant
Agreement no: 244 552
2
Professional Business Services and their Role in the EU Economy: Measuring ‘Knock-on’ Effects
Iain Paterson and Richard Sellner November 2012
Abstract
This paper investigates the wider economic role of professional services within the EU. Besides their importance measured by shares in value added, gross output or employment, professional services contribute significantly to the economic performance in other sectors via forward linkages.
Traditionally these linkages are defined by the Inverse-Leontief Matrix of an Input-Output system.
However, we introduce a measure based on the methodology of Fujita (2008) that is more closely related to the concept of forward linkages that is intended to be captured by most empirical studies.
Our proposed linkages describe the embodied content of professional services per unit of gross output in the other industries, and first we derive some useful properties. These linkages are, secondly, used to outline the importance of other business services (that consists of around two thirds of professional services) visually by network graphs, showing the most important forward links in an economy. Input-Output data from 2005 show that the sector ‘other business services’ holds a central position in the inter-industry network in most countries of the EU-27. Thirdly, we introduce some new summary measures of economic knock-on effects out of these linkages. We find that other business services account for the highest forwarded knock-on effects. In 2005 the total embodied value of other business activities amounted to nearly 10% of gross output in our sample of 20 countries of the EU in 2005 – the highest of all the industries covered. The value added share of other business activities attributable throughout the economy is 14% compared to its own value added share of 8% in the economy of the EU-20 sample. These findings highlight the economic importance of other business services in general and professional services in particular.
Keywords: professional services, knock-on effects, regulation, sectoral interlinkages JEL Classification: L84, C67, O52.
* Institute for Advanced Studies, Vienna, Austria
3
1. Introduction
In the last decade services in general and professional services in particular have been seen as potential for growth in line with the Lisbon Targets 2010 (see EC 2000) and 2020 (see COM 2010).
Their ability to spur growth was said to lay in the removal of barriers to entrepreneurs (see COM 2004, COM 2005a, COM 2005b) a topic the authors address within another SERVICEGAP paper by Paterson, Brandl and Sellner (2012). In this paper, however, we focus on the economic importance of professional services in the EU economies.
We are especially interested in retrieving measures that outline the full extent of the economic impact of these services. As another paper of the SERVICEGAP project – Falk and Jarocinska (2010) – has shown, the linkages between manufacturing and services are increasingly important. To quantify such linkages, empirical literature usually applies the coefficients of the Inverse-Leontief matrix. In this paper we argue that a different methodological approach leads to more consistent measures, in the sense that they are conceptually more suitable to capture the nature of forward linkages.
The paper is organised as follows. Section 2 defines professional services and outlines their direct
economic relevance in the EU 27 in terms of value added, employment, gross output, foreign direct
investments and trade. Section 3 then introduces the method of measuring forward inter-industry
linkages based on an Input-Output framework and the methodology of Fujita (2008), and we derive
further interesting properties of the linkage measure. The section ends with an overview of the data
used for the calculations of the following sections. Section 4 presents the visualisations of the
forward linkages for selected countries of the EU-27 in 2005 by means of social network graphs. The
methods and algorithms used for producing these graphs are also given in this section. In section 5
we introduce measures of economic (forward) knock-on effects based on the interlinkage measure
introduced in section 3. Results of these measures are given in graphs for an aggregate sample of 20
EU countries and the year 2005. A final section concludes.
4
2. The Role of Professional Services: Comparative Analysis of Member States
Following the Lisbon European Council in March 2000, the European Council highlighted the role of services for economic growth and employment. Especially business services were recognised as knowledge-intensive industries with high potential for the strategy of making the EU the most competitive and dynamic knowledge-based economy in the world (by 2010). To look deeper into the potential of these industries the European Commission DG Competition authorised a study on the economic impact of regulation in liberal professions which was released in 2003. This study by Paterson et al. (2003) defined lawyers, notaries, accountants, architects, engineers and pharmacists as liberal professions or professional services
1. Within this study, indicators to quantify the extent of anti-competitive regulations within these industries were developed, with the result that those industries appear to be very strongly regulated and that this regulation is capable of deterring growth and efficiency.
Following the approach of Paterson et al. (2003), the OECD (see Conway and Nicoletti, 2006) took up a slightly different definition of professional services, leaving out the pharmacists. In this paper we stick to the OECD definition of professional services and drop the (retail) pharmacists as they are very hard to identify within the official industry classification systems. Since 2008, these are in general the NACE Rev. 2 (NACE Rev. 1.1.) of the European Union or the corresponding ISIC Rev. 4 (ISIC Rev. 3.1.) of the United Nations Organization.
Table 1 shows the professional services and their corresponding NACE and ISIC codes. Accountants are included in the NACE Rev. 2 Header “M Professional, Scientific and Technical Activities” under
“69.2 Accounting, bookkeeping and auditing activities; tax consultancy”. Within the preceding NACE Rev. 1.1. Accountants were listed in “K Real estate, renting and business activities” under the code 74.12. For architects and engineers the new revision to the classification system divided the former NACE Rev. 1.1. “K 74.2 Architectural and engineering activities and related technical consultancy”
into the two NACE Rev. 2. “M 71.11 Architectural activities” and “M 71.12 Engineering and related technical consultancy”. Lawyers and notaries can be found in NACE Rev. 2 “M 69.1 Legal activities” or within Rev. 1.1. “K 74.11 Legal activities”.
Table 1: Industry classification of professional services
NACE Rev. 1.1 (ISIC Rev. 3.1.) NACE Rev. 2 (ISIC Rev. 4)
Accounting K 74.12 M 69.2
Architects K 74.2 M 71.11
Engineering K 74.2 M 71.12
Legal (Lawyers, Notaries) K 74.11 M 69.1
Source: Eurostat, Ramon Database (2012).
1
Following the study, the European Commission (2004, page 3) defined those professions as follows:
“Liberal professions are occupations requiring special training in the liberal arts or sciences”.
5 2.1. Relevance of professional services in the EU
Having defined professional services by legal, accounting, architectural and engineering activities, the economic relevance of those professions can be outlined with some basic figures. There are several official data sources from the OECD and Eurostat available reflecting, more or less detailed, the sectoral structure of the European economies.
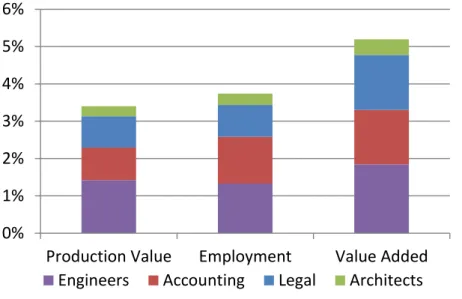
A first overview is given in Figure 1, depicting the shares of production value
2, employment
3and value added
4of the 4 professional services in the total economy. The data stem from the Eurostat Structural Business Statistics (SBS) that does not cover agriculture, forestry and fishing, nor public administration and (largely) non-market services such as education and health. Hence, the numbers reflect the importance of professional services in the secondary and tertiary market economy. In general, engineering activities account for the largest and Architect services for the smallest contributions. The four professional services account for a share in production value and employment of around 3.5% on EU-21 average. The value added of those services is slightly above 5%.
Figure 1: Share of professional services in the market economy (EU-21), 2009
Source: Structural Business Statistics (SBS), Eurostat (2012).
Remarks: SBS does not cover agriculture, forestry and fishing, nor public administration and (largely) non-market services such as education and health. Countries included: Austria, Belgium, Cyprus, Finland, France, Germany, Hungary, Ireland, Italy, Latvia, Lithuania, Luxembourg, Netherlands, Poland, Portugal, Romania, Slovakia, Slovenia, Spain, Sweden and United Kingdom.
2 Production value is the amount produced by an industry, based on sales, including changes in stocks and the resale of goods and services. It is calculated as turnover plus or minus the changes in stocks of finished products, work in progress and goods and services purchased for resale, minus the purchases of goods and services for resale, plus capitalized production, plus other operating income (excluding subsidies).
3 Employment is measured in terms of the total number of employees. An employee is a person who works for an employer on the basis of a contract of employment and receives compensation in the form of wages, salaries, fees, gratuities, piecework pay or remuneration in kind (see Glossary of SBS).
4 Value added is measured at factor costs (after adjusting for operating subsidies and indirect taxes).
0%
1%
2%
3%
4%
5%
6%
Production Value Employment Value Added
Engineers Accounting Legal Architects
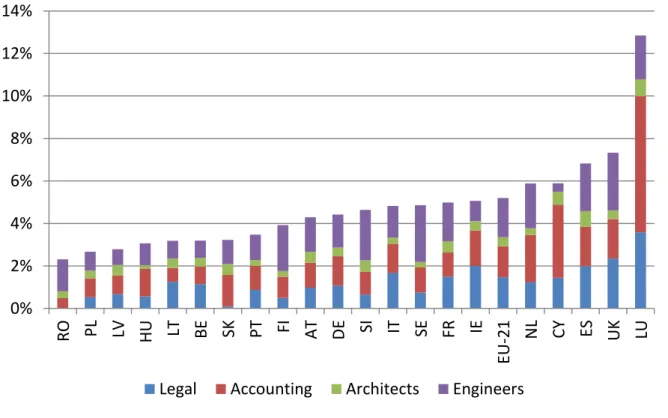
6 As the average of the 21 countries, for which data was available, ignores the variation across countries, Figure 2 shows the shares in value added by country. In 2009, the latest available year, Luxembourg accounts for 13% of the market economies value added. This exceptionally high share is mostly due to accounting activities, as might have been expected given the specialization of Luxembourg in services in general and in the finance sector in particular. On the other hand, the share of value added in Romania is just above 2%, showing nearly no activities of legal services. Apart from a few exceptions, CEE countries account for lower shares on average, thus reflecting the tendency of increasing demand of high income countries in services and the important role of services as a deliverer of intermediate inputs for advanced economies (see Wölfl, 2005).
Figure 2: Value added share of professional services in the market economy, 2009
Source: Structural Business Statistics (SBS), Eurostat (2012).
Remarks: SBS does not cover agriculture, forestry and fishing, nor public administration and (largely) non-market services such as education and health. EU-21 average includes: Austria, Belgium, Cyprus, Finland, France, Germany, Hungary, Ireland, Italy, Latvia, Lithuania, Luxembourg, Netherlands, Poland, Portugal, Romania, Slovakia, Slovenia, Spain, Sweden and United Kingdom.
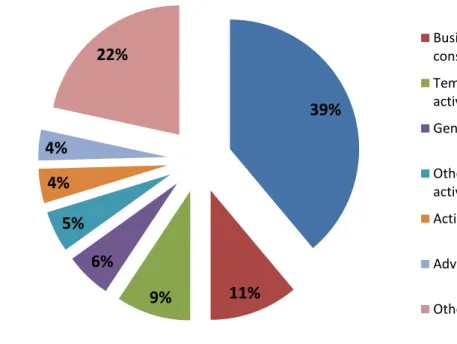
Since the Structural Business Statistics only offers comparable data on professional services for 2008 and 2009, we employ the EU-KLEMS database to graph the development over time. However, there are some restrictions implied by the data. First, the last available year included in the EU-KLEMS database when writing this paper was 2007. This is due to the fact that updating the data for each country and industry covered is particularly time and resource consuming. Second, as the EU-KLEMS database aimed at constructing a consistent dataset over countries, industries and variables, the level of sectoral detail varies between industries (see O’Mahony and Timmer, 2009). As a result, professional services cannot be identified directly from the data, but are included in the NACE Rev.
1.1. code “K 74 other business activities”. Figure 3 shows that the percentage of professional services in value added of ‘other business services’ is 39% on EU average.
0%
2%
4%
6%
8%
10%
12%
14%
RO PL LV HU LT BE SK PT FI AT DE SI IT SE FR IE EU- 2 1 NL CY ES UK LU
Legal Accounting Architects Engineers
7
Figure 3: Value added share of professional services in other business services, EU-27, 2009Source: Structural Business Statistics (SBS), Eurostat (2012).
Remark: Other business services are NACE Rev. 1.1. K 74 and contains all professional services.
The development of value added volume (real) index (100=1995) of the EU-25 is shown in Figure 4 for the total economy, the primary, secondary and tertiary sector as well as for ‘other business services’. Other business services showed a very strong development, particularly after 2004.
Figure 4: Development of real value added in other business services, EU-25
Source: EU-KLEMS Database (2012).
Remark: Other business services are NACE Rev. 1.1. K 74 and contains all professional services.
90 100 110 120 130 140 150 160
1995 1996 1997 1998 1999 2000 2001 2002 2003 2004 2005 2006 2007
Total Economy Primary
Secondary Tertiary
Other business activities
39%
9% 11%
6%
5%
4%
4%
22%
Professional services
Business and other management consultancy activities
Temporary employment agency activities
General cleaning of buildings
Other business support service activities n.e.c.
Activities of head offices
Advertising agencies
Other
8 2.2. Trade and FDI integration of professional services in the EU
In the last 15 years we have seen an enormous boost in trade and FDI integration. There are basically two ways for entrepreneurs to profit from the foreign market. The first form of international economic integration is the trade in goods and services. Besides exporting and importing for final demand, goods and services from abroad are used as intermediary inputs in production. Falk and Jarocinska (2010) recently found that while purchasing services inputs from abroad is still of limited relevance, it is increasing substantially over time. The second form of international market penetration is foreign direct investment (FDI). Within this channel the foreign market is directly accessed through investment in existing on newly founded companies. Whether trade or FDI are preferred channels for multinational companies depends on the characteristics of the industry, the product or service, potential trade barriers, transport costs, FDI and product market regulations and several other location factors such as human capital endowment, taxes or unit labour costs.
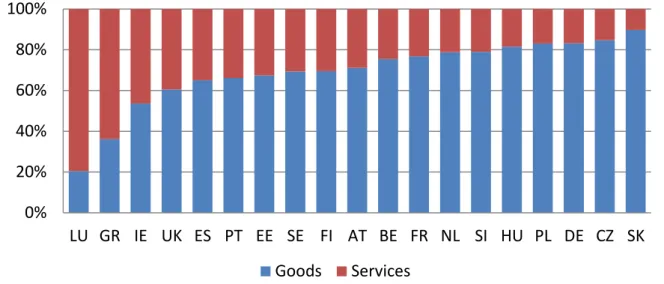
Figure 5 shows the shares of goods and services in total exports of 19 EU countries for the year 2009.
For most countries trade in goods dominates the exports statistics. Notable exceptions are Luxembourg, Greece and Ireland with services shares of more than 50%.
Figure 5: Share of Services in Total Exports, 2009
Source: OECD, EBOPS (2002) - Trade in services by service category, OECD – National Accounts Database.
Remark: Exports are measured in current USD.
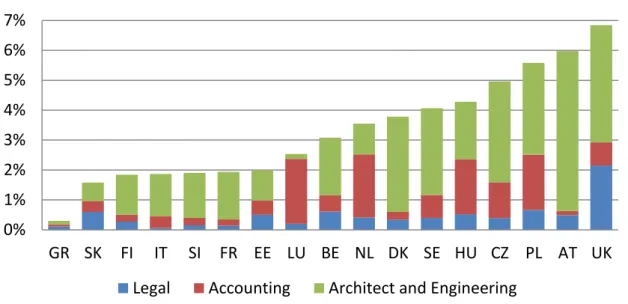
Figure 6 shows the percentage of professional services exports in total services exports for selected EU countries. With respect to the economic relevance (5% of value added on average) exports of professional services are rather distinct in the UK, Austria and Poland. Greece with a share of services in total exports of nearly 60% (see Figure 5) has a particularly low share of professional services in services exports. Except for Luxembourg and the Netherlands, with high shares of exports in Accounting, most exports relate to Architectural and Engineering activities. Due to the data used, the latter both could not be separated in the graph.
0%
20%
40%
60%
80%
100%
LU GR IE UK ES PT EE SE FI AT BE FR NL SI HU PL DE CZ SK
Goods Services
9
Figure 6: Share of professional services exports in total services exports, 2009Source: OECD, EBOPS (2002) - Trade in services by service category, OECD – National Accounts Database.
Remark: XXX.
Another interesting aspect is the contribution of professional services to the balance of payments of the countries. Figure 7 shows the exports, imports and trade balance (exports – imports) normalized by the GDP of the country. Most of the countries, except for Luxembourg, Greece, Italy, France and the Slovak Republic, showed a trade surplus in professional services in 2009. Still, the economic significance of the contribution is however rather limited with surpluses and deficits ranging between -0.5 and 0.5 percent of GDP.
Figure 7: Trade in Professional Services in percent of GDP, 2009
Source: OECD, EBOPS (2002) - Trade in services by service category, OECD – National Accounts Database.
Remark: GDP and Trade are in nominal USD 2009 at 2009 exchange rates.
-1.0%
-0.5%
0.0%
0.5%
1.0%
1.5%
2.0%
2.5%
3.0%
3.5%
GR IT FR SK FI SI PL EE NL CZ BE SE HU DK UK AT LU
Net Imports Exports 0%
1%
2%
3%
4%
5%
6%
7%
GR SK FI IT SI FR EE LU BE NL DK SE HU CZ PL AT UK
Legal Accounting Architect and Engineering
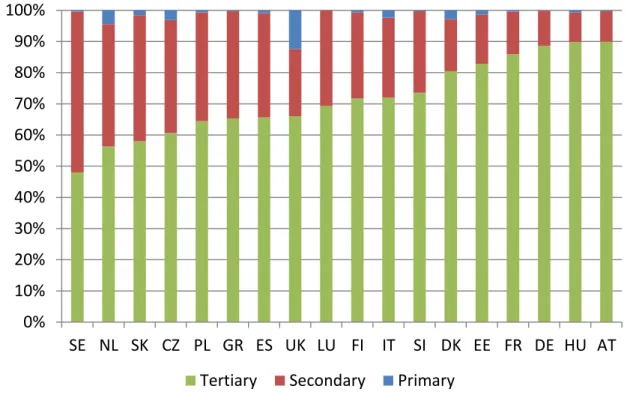
10 The composition of inward FDI positions in EU countries from abroad in 2009 is shown in Figure 8.
The FDI inward position is a stock measure that is calculated by summing up and depreciating inward flows of past years can be interpreted as the stock of foreign capital in an economy. In contrast with the trade composition, FDI inward positions are predominantly found in the service sector of the economy. Except for Sweden, more than 50% of foreign direct capital stock is employed in the service sector.
Figure 8: Sector shares in FDI inward positions, 2009
Source: OECD International Direct Investment Database.
Remark: FDI are measured in nominal USD 2009 at 2009 exchange rates.
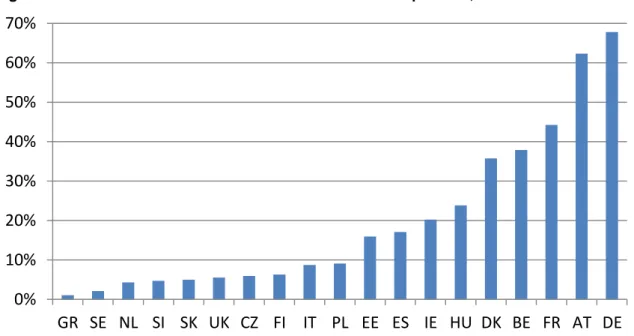
Figure 9 shows the share of ‘other business services’ in total FDI inward position in services for the year 2009. Unfortunately, the sectoral FDI statistics from the OECD do not permit a more detailed view on professional services, so the resulting figures are upward biased. Nevertheless, the countries for which data were available show very large variation in the shares. FDI in business services is especially important for Germany, Austria, France, Belgium and Denmark, with shares between 35 and nearly 70%.
The economic relevance of the foreign capital stocks in other business services also varies substantially across economies and is given in Figure 10. This figure shows the FDI inward position in other business services as a percentage of GDP. Compared to the previous figure, it can be seen that the foreign capital stock in other business services in Hungary and Belgium amounts to 75 and 50%
respectively.
0%
10%
20%
30%
40%
50%
60%
70%
80%
90%
100%
SE NL SK CZ PL GR ES UK LU FI IT SI DK EE FR DE HU AT
Tertiary Secondary Primary
11
Figure 9: Share of ‘other business activities’ in FDI inward position, 2009Source: OECD International Direct Investment Database.
Remark: FDI are measured in nominal USD 2009 at 2009 exchange rates.
Figure 10: FDI inward position in ‘other business services’ as a percentage of GDP, 2009
Source: OECD International Direct Investment Database.
Remark: FDI and GDP are measured in nominal USD 2009 at 2009 exchange rates.
0%
10%
20%
30%
40%
50%
60%
70%
GR SE NL SI SK UK CZ FI IT PL EE ES IE HU DK BE FR AT DE
0%
10%
20%
30%
40%
50%
60%
70%
80%
GR SI IT SE FI UK SK NL CZ PL ES EE FR DK DE IE AT HU BE
12
3. Professional and Business Services in Relation to other Sectors
3.1. Input-output analysis and its shortcomings for evaluating intersectoral effects
An economy-wide input-output table is made up of rows and columns, rows representing sectoral output (sales) and the columns representing sectoral inputs (purchases). In the IO-Tables of the NACE classification which forms the basis for this study, there are 48 recorded industries (sectors) in each Member States’ economy. An input-output table also consists of final demand and value added sections. Final demand covers total consumption (private or public), capital formation, and exports.
The row sum of intermediate demand and final demand equals the gross value of production.
Similarly, the column sums of intermediate demand plus value added (total inputs) also equal the gross values of production of an industry (total outputs). The following table illustrates the input- output table structure.
Table 2: Symmetric Input-Output Table Structure
Intermediate Demands Final
Demands Total output Sectors
1, 2,……, n
Intermediate
Inputs Sectors
1 … i … n
x
i1. . . . . x
ij. . . . . . . x
ind
ix
iPrimary Inputs Value
Added v
i. . . . . v
j. . . . . . . v
nTotal Inputs x
1. . . . . x
j. . . . . . . x
nwhere:
… direct input from sector ( in sector ( ;
is the Input Output matrix
… final demand of sector ( … value added in sector
Thus
∑
∑
and … total output of sector = … total input of sector for . The (direct) Input Coefficient matrix has elements defined as
, .
… input coefficient: amount of production input of sector in one unit of production of sector
13 Writing for the vector of industry gross outputs, for the vector of demand for final goods, then the basic relation between output and final demand can be expressed as:
or, equivalently,
In this equation
is the Leontief Inverse Matrix of total input coefficients and describes how many units of an industry’s output have to be produced at any stage of the value chain in order to produce one unit for final demand.
Note: The existence of the Leontief inverse composed of non-negative elements is guaranteed on account of the economic activity of sectors documented in in the Input Output Tables.
5The size of each sector of the economy may be expressed in terms of value added. The sum of value added ∑ ∑
(in this characterisation) is equal to the Gross Domestic Product GDP; The sum of gross outputs ∑
∑
is much greater than the entire GDP since intermediate direct inputs are ‘double counted’, but is useful as a comparative measure of use of output
The wider importance of any sector in the economy can be estimated by examining the inter-industry linkage effects. A sector usually uses inputs from other industries in its production process. This reflects the sector’s backward linkage. On the other hand, when a sector supplies inputs to other industries (sectors), the dependence of these sectors on inputs supplied from that particular originating sector indicates the knock-on effect of production. This is indicated by the forward linkage of the sector into other industries to which it supplies inputs.
In general, backward linkages are indicated by matrix columns (from different sector 's to a particular sector ) and forward linkages (knock-ons) are indicated by rows (from a particular sector to all other sector ’s). We are more interested in this paper in forward linkages, since these indicate the extent to which the output of a sector “knocks-on” (in the first instance as direct as input into) all other sectors. The derivation of the matrix to be used for calculating linkages is, however, a vexed question. For example, the strength of forward linkages has been measured using the rows of the matrix (e.g. Faini et al. 2006), similar to the use of row and column sums to calculate the strength of linkages by Chenery and Watanabe (1958), but clearly only direct linkages are taken into account by such methods. The use of the rows and columns of the inverse Leontief matrix for, respectively, measuring forward and backward linkages (Rasmussen 1958, Hirschman 1958) gained a certain popularity, its appropriateness has also been widely disputed. The main problem with using the Leontief inverse arises from the fact that the elements of matrix relate the gross output in individual sectors to the final demand in other sectors.
5 The existence of the inverse with is guaranteed if and only if the Hawkins-Simon (HS) Condition holds, namely that all the principal minors (determinants formed by deleting corresponding rows and columns) of the matrix are positive (Hawkins and Simon 1949). An Input-output table as described above satisfies the HS Condition because i) each of the elements of the input coefficient matrix A ,
, is non-negative, and, ii) the column and row sums of A are each less than one, given that the value added and/or the final demand in each sector of the economy exists as a positive quantity (c.f. Grötschel 2003, pp.
97-99). See also Fujimoto and Ranade (2004).
14 An alternative approach for obtaining forward linkages put forward by, among others, Augusztinovics (1970), Jones (1976) based on the Output Coefficient model” proposed by Ghosh (1958): output coefficients
are obtained from the Input Output table analogously to the Input Coefficient matrix by dividing table entries across rows by the sectoral gross output (row total), as opposed to dividing column entries by the corresponding column sum. Forward linkages are them given by the rows of the inverse matrix
. This method of calculating forward linkages seems to have been used extensively, for example within regional science, but has in turn recently been severely criticised. De Mesnard (2009a) is of the opinion that the Ghosh model is contributes nothing more than the Leontief model, and another major criticisms of is that the backward linkages (obtained by using the Leontief inverse) correspond to a production function with complementary inputs while the forward linkages (the Ghosh model) correspond to a production function with perfectly substitutable inputs, studying both effects means that two incompatible production (De Mesnard 2009b).
Summing up, the literature on forward linkages offers no accepted consensus of a model to be used for empirical studies. However, a recent paper of Fujita (2009) appears to offer a new approach to forward linkages sand ‘knock-on’ effects, although the author does not himself use these terms, referring rather to the “embodied value” of one sector’s output in another sector. However, we agree with Fujita that this approach will “play an important role in the total flow analysis of the Leontief models as an alternative to the traditional final demand analysis . . . for example Szyrmer (1992), Gallego and Lenzen (2005).”
3.2. Explication and further extensions of the method for calculating forward linkages
In this study we develop further the approach shown by Fujita (2009) which enables us to obtain the total (direct and indirect) input amounts of the standard good (sector ) embodied in one unit of gross output in each of the other sectors of the economy, represented by
(c.f. Fujita 2009)
6. This measure of the knock-on effect includes not only the value of direct inputs that from sector to sector (which are the
), but it also includes the value of other indirect inputs that originate from sector and whose effect ends at sector via other intersectoral transfers through the network of inputs and outputs. Fujita’s definition of the ‘lambdas’ is given by a series of simultaneous equations
6 We note that previously Gim and Kim (1998) deduced the relations of equation (3) for and induced the general form for any , but, in common with Fujita (2009), without immediate discussion of its pertinence to linkage measurement.
This can be explained with a simple example. Consider two industries: j builds airplanes while i produces jet engines; a 10% reduction in the deliveries of industry i compels industry j to reduce its use of i’s intermediate product; hence, j must reduce its own output because the Leontief production function is of complementary inputs; airplanes production will be cut by 10% because of the shortage of jet engines ; and the value added of the airplane maker j will also be reduced. There is no Ghoshian effect here, only the hard law of the production function with complementary inputs. If the production function with complementary inputs is abandoned . . . this effect disappears: the production of the forward industry is only marginally affected by the fall in deliveries, which is completely unrealistic in most industries, and particularly for airplanes, at least in the short and medium term because it is impossible to sell airplanes without all their engines.
(De Mesnard 2009b, pp. 4-5.)
15
∑
In order to gain a better understanding of the above definition we first illustrate direct and indirect flows of inputs in order to produce an output in the network diagram of Figure 11.
Figure 11: Input Output table as a Network, showing some indirect connections.
Source: Own illustration.
In the (part of the) network shown the nodes represent the output of sectors for indeterminate . The direct input from node to node is given by
. Indirect input from node to node can take many paths via other sector outputs ’s; some of these are illustrated by the coloured arrows. We now offer the following interpretation of equation (2) in the ‘Fujita lambdas’ network diagram (Figure 12) below, where the nodes represent gross sector output.
Figure 12: Network interpretation of ‘Fujita Lambdas’.
Source: Own illustration.
16 The direction of each arrow shows the direct input coefficient ( ’s) and the direct plus indirect coefficients (lambdas). There are connections between all nodes in both directions, but in the diagram only the relevant connections for determining
, i.e. from sector to sector , are highlighted.
The (direct and indirect) input from sector per unit of output of sector is given by
is given (and takes all the various paths that are taken to get indirectly from node to node implicitly into account), Further, the direct input amount from sector per unit of output of sector is given by
. So the indirect input from sector per unit of output of sector is given by
. Thus a lambda may be interpreted as a multiplier that converts the per unit amount of direct input/output into the per unit amount of direct and indirect input/output. Consider now that each indirect path to node enters finally through a direct input
from a “node (shown as green arrows), and a proportion
of each of these is “notionally” delivered indirectly (shown as blue arrows), Note the connection from sector to itself. Since the various “last path segments” are mutually exclusive, the total indirect amount of input from sector per unit of output of sector is ∑
the direct input from sector per unit of output of sector is
. Taken together, the total amount of direct and indirect input from sector per unit of output of sector is thus represented as
∑
as on the right-hand-side of equation(s) (2).
Fujita’s Theorem
From the starting point of the relations (2), Fujita (2009) invokes properties of the fundamental economic Hawkins-Simon condition to derive the following formulae for lambdas:
The values of
are derived from the elements inverse Leontief matrix
as follows:
where
“stands for the direct and indirect (total) input contents of good necessary to produce one unit of gross output of good ”. Let us call this the Fujita Theorem.
We go on to develop two corollaries that enable us to calculate lambdas efficiently and show that the empirical use of the lambdas leads to a comprehensible estimate of linkage effect.
Corollary 1
Let be an x Input Coefficient matrix, so that the Hawkins-Simon condition holds and the Leontief matrix
exists and has non-negative elements. (Cf. Footnote 10.)
We construct the matrix composed of elements (
) formed from (3), with rows and columns replacing and , respectively, in the equations (Fujita), so that the notation is consistent with the previous input output analysis.
7Then, two equivalent expressions for deriving the matrix are
87 We note that this use of as a matrix differs from its use as a row vector, and also from the matrices in Fujita’s paper, which are not needed here.
8 The formula (5) can be implemented, for example in MATLAB, for an x matrix , with the syntax:
17
where the matrix operator replaces all non-diagonal elements of an x with zeros.
Proof:
Since the Leontief inverse exists we can write
, and this series converges to
Further, since the elements of are non-negative, so are each of the elements of . Thus the diagonal elements of are each 1 plus a converging sum of non-negative terms, that is
and, trivially,
,
The inverse
therefore exists since none of the diagonal elements are zero, and is composed of diagonal elements
and zero non-diagonal elements.
9Further,
Write
[
]
and
[
] (i.e. subtraction of 1 from each diagonal element of .
So [
] [
] [
] ,
i.e.
{
(
)
which is the ‘Fujita formula’ taken row-wise, with the conventional representing rows and columns (in place of the letters denoting rows, and denoting columns), respectively. Hence (5)
and (4) hold.
.
9 See proof of this theorem at http://www.proofwiki.org/wiki/Inverse_of_Diagonal_Matrix.
18 We note also, using (6), that
Hence, it also holds that
And, writing for row and column vectors of , respectively, we get
Corollary 2
‘Fujita’s lambdas’ are well-defined and represent a measure of intersectoral linkage that is generally conservative as compared with the putative use of Leontief Inverse coefficients for this purpose.
Specifically,
(9) Proof:
By “well-defined” we mean that coefficients representing direct and indirect transfers from one, emitting, sector per unit of output of the second, receiving, sector will be at least as large as coefficients representing only the direct transfer from the first sector to the receiving sector.
Since the elements of the Leontief inverse matrix
are non-negative (Cf. footnote 10), and
from (7), it follows that has non-diagonal elements
; the diagonal elements
are given by
, and from (8),
, so that
(10)
Therefore all elements of are non-negative. It follows from (1) (with appropriate notation) that
. That is, is well-defined.
From (7)
, it follows also that the non-diagonal elements of ,
; it also implies, taken together with (10),
, that the diagonal elements
. In other words,
.
Summing up,
. Therefore, consistently measures linkage effects that are less than the (often criticised, see above) use of the Leontief inverse model. This can be understood intuitively, since the denominator of the Lambda coefficients, “per unit of gross output”, is greater than that of the Leontief inverse coefficients, “per unit of final demand”.
An initial inspection of the Input Output Table for Germany reveals that the lambdas have an average
that corresponds to a value at 75% of the “gap” between input coefficients and Leontief inverse
coefficients.
19 Corollary 3
The partial contribution
of each indirect ‘route’ of linkage between sectors and can not exceed the final direct input
on the path taken, cf. (2), as
i.e.
(11) Proof:
It only remains to show the right inequality. Morishima and Nosse (1972, pp. 97-98) refer to and prove ‘Metzler’s theorem’ (Metzler 1951), namely that “since the column sums of the . . . coefficient matrix [here represented by ] are less than unity, . . . the diagonal elements of the Leontief inverse are greater than the off-diagonal elements of the corresponding rows”.
10So we get
; taken together with (10) this implies
We note that elements (not only diagonal) of the Leontief inverse – that have elsewhere been used as linkage multipliers – may be , even if this is unlikely for larger input output tables.
3.3. Data description
For the following analysis we used the harmonized Input-Output tables of the OECD (see Yamano and Ahmad, 2006). Symmetric industry-by-industry Input-Output Tables are available for 22 of the EU-27 countries
11, with the latest release covering the year 2005. The tables include the intermediate input flows between 48 sectors (ISIC Rev. 3 industry classification) in millions of national currency in basic prices. Data of countries outside the Eurozone have been converted to Euros using the average annual exchange rate published by Eurostat.
The sectoral information used to construct the IO-Tables varies in detail over the countries covered.
Therefore we needed to aggregate some sectors to ensure comparability over countries
12. Furthermore, we excluded the countries Luxembourg, Ireland, Poland and Sweden due to missing data in some sectors. Excluding the sector ‘Private households with employed persons & extra- territorial organisations & bodies’, we end up with 39 sectors that are comparable over the 20 countries in our sample
13. A full list of industries including abbreviations is given in Table 3 in the Annex.
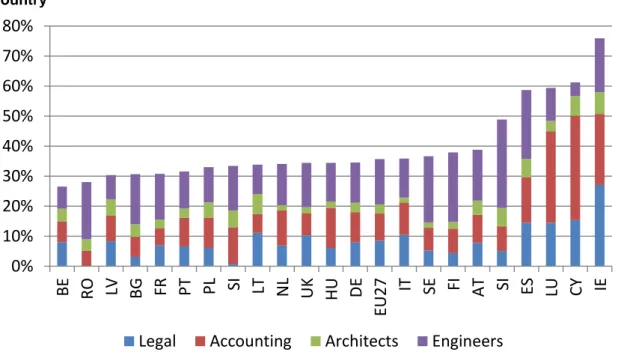
Within the resulting industry structure, the professional services accounting, architects, engineers and legal services are (among others) included in the sector ‘other business activities’. To get an idea of the relevance of professional services within other business activities, Figure 13 shows the share of
10 In economic terms, “the output of any industry is … more affected by the exogenous demand for itself than the exogenous demand for the output of any other industry” (Morishima and Nosse, 1972).
11 Austria, Belgium, Czech Republic, Germany, Denmark, Spain, Estonia, Finland, France, United Kingdom, Greece, Hungary, Ireland, Italy, Luxembourg, The Netherlands, Poland, Portugal, Romania, Slovakia, Slovenia and Sweden.
12 Specifically we merged the industries ‘Coke, refined petroleum products and nuclear fuel’ and ‘Chemicals excluding pharmaceuticals’, ‘Iron & steel’ and ‘Non-ferrous metals’, ‘Building & repairing of ships & boats’,
‘Aircraft & spacecraft’ and ‘Railroad equipment and transport equipment n.e.c.’ and the sectors ‘Production, collection and distribution of electricity’, ‘Manufacture of gas; distribution of gaseous fuels through mains’,
‘Steam and hot water supply’ and ‘Collection, purification and distribution of water’.
13 We excluded Sweden and Romania due to missing data for key sectors of our analysis.
20 the production value
14of the four professional services in other business activities. On EU-27 average the share amounts to 35% in 2009. Particularly high shares are observed in Ireland, Cyprus, Luxembourg, Spain and Slovenia (50% or above). On average, engineering services account for the highest share (15%), while architectural activities only display a share of 3% on average.
Figure 13: Production share of professional services in other business services, 2009 by country
Source: Structural Business Statistics (SBS), Eurostat (2012).
Remark: Other business services are NACE Rev. 1.1. K 74 and contains all professional services.
For the following analysis, the relevance of professional services within other business activities should always be borne in mind. The upward bias of results for professional services using data on other business activities will on average be of factor 3. However, when it comes to relative industry interlinkages, such as the amount of a standard good (sector) i embodied in one unit of gross output in sector j of the economy, the interpretation will rely on assumptions that the intermediate Input linkages of other business activities and professional services are similar.
4. Visualisation of Interlinkages of professional services
De Benedictis and Tajoli (2011) recently applied methods of network analysis and graph theory to world trade, analysing and visualizing the complexity of trade relationships between countries worldwide. They interpreted countries as the nodes and trade flows between them as the edges of a network. The visualization of the trade networks in their study provided some interesting insights about the role of the countries in the worldwide network. As the inter-industry deliveries can be seen as within-country trade flows, it is straight forward to apply network methodologies within our framework. The forward and backward linkages of the industries of an economy can be viewed as a network, in the sense that industries trade intermediate inputs with each other, with the nodes
14 We chose the production value rather than the value added to show the importance of professional services in other business activities, as this measure is more closely related to the inter- and intra-industry flows contained in the Input Output tables used in the preceding analysis of this paper.
0%
10%
20%
30%
40%
50%
60%
70%
80%
BE RO LV BG FR PT PL SI LT NL UK HU DE EU27 IT SE FI AT SI ES LU CY IE
Legal Accounting Architects Engineers
21 being the industries and the edges connecting the nodes being the interlinkages between the industries. Thus, the input-output linkages introduced above may be interpreted and visualized as a network using network and graph theory methodologies.
Figure 14 shows a simple application of such techniques to the sum of the symmetric Input Output Tables of the 20 countries from our sample. The size of nodes indicates the relative amount of an industries gross value added in the total economy, whereas the edges show the inter-industry flows of outputs (intra-industry flows not displayed).
Figure 14: Input-Output Table Network Graph for EU20, 2005
Source: Input-Output tables of the OECD (see Yamano and Ahmad, 2006).
Remark: Constructed using the Fruchterman-Reingold algorithm of Fruchterman and Reingold (1991).
However, the focus of the preceding analysis is on the role of professional services within the economy of selected European countries. Due to data restrictions, professional services are approximated by the industry ‘Other Business Activities’. In terms of production value, professional services account for one third of other business activities. The importance of professional services for the economy will depend on the size of the industry itself as well as the number and strength of interlinkages to other industries in the economy. The basic idea is to apply a graph algorithm to the industry linkage network to show the degree of interlinkage (i.e. the importance of the sector within the economy) visually.
Graph algorithms are routines aiming at producing a readable spatialization of complex network
data, turning the structural proximities of the network into visual proximities. At the core, such an
algorithm consists of equations modelling attraction and repulsion forces between the nodes of the
network. Most algorithms base these forces on an energy model that interprets the nodes and edges
of the network as electrically charged particles. In such a setting, nodes repulse each other (like
similarly charged magnets) and edges attract the nodes they connect (like springs). Starting from a
randomly allocated graph of nodes and edges, the graph algorithm iteratively repositions the nodes
22 in a way that is determined by the specification of the algorithm, finally converging to an equilibrium state (see Jacomy et al., 2011).
We chose the “Force Atlas 2” algorithm described in Jacomy et al. (2011) and implemented in the open-source graph manipulation and visualization software Gephi
15. The attraction ( ) and repulsion force ( ) between two nodes and of this algorithm are as follows:
(1)
(2)
with being the distance between the two nodes, being the degree of a node
16and being a repulsion constant, specified by the user. The attraction force depends linearly on the distance between the nodes and a weight assigned to them. The repulsion force is designed such that poorly connected nodes (with low degree) and highly connected nodes (with high degree) repulse less, avoiding so called ‘leaves’ (nodes that have only one connected node) to be placed too far outside the graph.
Applied to the inter-industry linkages of the IO-Tables, we interpret the 39 industries as nodes with edges between them in case of an intermediate input linkage. To outline the importance of the sectors and interlinkages, we assign weights to the nodes and edges.
Nodes are given weights according to their share of value added in the total economy, to illustrate the economic importance of the sector. Weights assigned to edges should, ideally, reflect the intensity of the connection between two nodes. For this purpose, we use the forward linkages (“Lambdas”), introduced before, defined as the amount of a standard good (sector) i embodied in one unit of gross output in sector j of the economy. Note that in case of our application the resulting network will have directed edges, as the embodied amount of sector i in sector j may differ from the embodied amount of sector j in sector i.
Stemming from the nature of our application, some special issues arise when constructing the network of industries as nodes and intermediate input interlinkages as edges. As the industry level of the IO-data (39 sectors) is rather aggregate, almost all industries are connected to all other industries by means of intermediate input deliveries (complete network). According to the specification, the graph algorithm will order the nodes in equal distance to each other and, thus, no structural information of the network is transferred to the visualization. To overcome this issue, we exclude edges that are below a cut-off value of the edge weight. Particularly, we drop all edges in which less than 1/20 (0.05)
17of a product of sector i is embodied in one unit of gross output in sector j. As we depict a directed graph, the arrow of an edge points towards sector j. The size of the node labels is scaled by the degree of the node considering the threshold value of 1/20.
Figure 15 shows this type of representation for the aggregate of the EU-20 countries. Other business activities and trade are in the centre of the graph, showing the most links forwarding at least 5%
embodied content.
15 http://gephi.org
16 The degree of a node is the number of connections of that node to other nodes in the network.
17 We chose a cut-off value of 1/20 for the Lambdas as this value corresponds to a representation of around 10% of the most important interlinkages out of the 39²-39 = 1428 edges.
23
Figure 15: Network Graph of EU-20 2005Source: Input-Output tables of the OECD (see Yamano and Ahmad, 2006), own calculations.
Remark: Constructed using the Force Atlas 2 algorithm of Jacomy et al. (2011).
Figure 16 shows the industry interlinkages of Germany in 2005 using the “Force Atlas 2” algorithm. In the resulting steady-state of algorithm, industries with more interlinkages appear more central. In German economy of 2005, the industry “other business activities”, which includes the professional services, shows the most interlinkages given the threshold value of 1/20. But still no especially strong connections (signalled by edge size) to other industries can be found. The strongest forward linkage directs from the mining to coke industry.
Figure 16: Network Graph of Germany 2005
Source: Input-Output tables of the OECD (see Yamano and Ahmad, 2006), own calculations.
Remark: Constructed using the Force Atlas 2 algorithm of Jacomy et al. (2011).
24 The same procedure with exactly the same network algorithm specification is carried out for France, the Netherlands, the UK and Spain (see Figure 17 to Figure 20). Similar to Germany, “other business activities” take a central, highly connected position in the network and account for a notable share of total value added. Besides business services and trade, finance appears to be very prominent in the UK and the Netherlands.
Figure 17: Network Graph of France 2005
Source: Input-Output tables of the OECD (see Yamano and Ahmad, 2006), own calculations.
Remark: Constructed using the Force Atlas 2 algorithm of Jacomy et al. (2011).
Figure 18: Network Graph of the Netherlands 2005
Source: Input-Output tables of the OECD (see Yamano and Ahmad, 2006), own calculations.
Remark: Constructed using the Force Atlas 2 algorithm of Jacomy et al. (2011).
25
Figure 19: Network Graph of the UK 2005Source: Input-Output tables of the OECD (see Yamano and Ahmad, 2006), own calculations.
Remark: Constructed using the Force Atlas 2 algorithm of Jacomy et al. (2011).
Figure 20: Network Graph of Spain 2005
Source: Input-Output tables of the OECD (see Yamano and Ahmad, 2006), own calculations.
Remark: Constructed using the Force Atlas 2 algorithm of Jacomy et al. (2011).
26 The network graph of the Greek economy is given in Figure 21. Compared to the above mentioned countries, the industry “other business activities” is significantly smaller compared to the total economy value added. Also, much fewer interlinkages above the cut-off value can be found for this industry. The industry with the most relevant forward linkages in Greece is trade.
Figure 21: Network Graph of Greece 2005
Source: Input-Output tables of the OECD (see Yamano and Ahmad, 2006), own calculations.
Remark: Constructed using the Force Atlas 2 algorithm of Jacomy et al. (2011).
Figure 22: Network Graph of Romania 2005
Source: Input-Output tables of the OECD (see Yamano and Ahmad, 2006), own calculations.
Remark: Constructed using the Force Atlas 2 algorithm of Jacomy et al. (2011).
27 Additional evidence can be obtained when moving further down the development stage to Romania (see Figure 22). Only the Romanian telecommunications industry accounts for an embodied product content of above 5% of business services. These examples clearly show that the importance of business services in general and professional services in particular, depend on the development level of an economy. Romania shows high value added shares in agriculture and food. The energy sector takes a central role as a forwarding industry.
Figure 23 shows the network graph of the United States of America. The largest industries, measured by value added, are “real estate”, “trade” and the “public services” that include the military industry.
As for the developed economies of the EU-27, the sector “other business activities” can also be found to be very central. Interestingly, the industry “R&D” can also be found to be very central, i.e. strongly interlinked with other industries, which may point towards a better transmission of innovation throughout the industries and increased commercial exploitation of research and development in the US economy.
Figure 23: Network Graph of the United States 2005
Source: Input-Output tables of the OECD (see Yamano and Ahmad, 2006), own calculations.
Remark: Constructed using the Force Atlas 2 algorithm of Jacomy et al. (2011).
28
5. Direct and Indirect Knock-on effects from (professional) business services
In this section we investigate the implications for the whole economy (for member States and at an aggregated EU level) of activity in one particular sector. We focus on the sector “other business services” which, as we have shown earlier in this paper, contains as a large element of significant size in professional services such as legal, accounting, engineering and architectural services. The measurement of “economic linkages” is rooted in the literature of Input Output analysis, and we develop in this section novel measures that derive from the concepts of “knocked-on” or “embodied value” of direct and indirect inputs that have been introduced in Section 3, viz. “lambdas” (Fujita 2009).
The importance of any sector in the economy can be estimated by examining the inter-industry linkage effects. The sector uses inputs from other industries in its production process. This reflects the sector’s backward linkage. Again, a sector may supply inputs to other industries. This indicates the forward linkage of the sector with other industries to which it supplies inputs. Thus, industries with large backward and/or forward linkages are termed “key” sectors, and play an important role in the development strategy of a country (Cf. Aydin 2007).
The terminology of “knock-on effects” often appears as a modern-day synonym for “forward linkages”: “Through output multipliers, an analysis can be made of the extent to which a particular sector will generate an increased output by all remaining sectors of the economy if it increases its own output; that is, the ripple or knock-on effect it causes” (Polo and Valle 2010). Knock-on effects are interesting in their own right, since it may show that the economic importance of a sector goes far outwith production in its own sector: this is indeed the case for business services, as will become apparent later in this section.
Knock-on effects may also be assumed to transmit positive or negative characteristics of the originating sector, forwarded throughout the whole economy. An instance of this usage was introduced by Conway and Nicoletti (2006), who examined the so-called “knock-on” effects of regulation of one sector on to another with the aim of quantifying the whole impact of regulation, not only on the particular regulated sector itself. Knock-on effects of regulation in the professional services are dealt with separately in the companion paper (Paterson, Brandl and Sellner 2012).
However, in this paper we focus on the first type of knock-on measure – the economic knock-on
effects – as has been recently introduced by the authors of this paper in CSES (2012). The idea behind
this type of knock-on effect is to fully illustrate the importance of particular sectors. Besides a
sectors’ own production value or value added, sectors might take important key positions in an
economy in terms of intermediate deliveries. By providing inputs, these sectors also provide
organisational and product-embodied specialised know-how. The more sophisticated the
intermediate services and goods become, the more the procurement of those intermediates may be
outsourced.
29 5.1. Introducing economic knock-on measures
Our starting point for evaluating economic effects are the “lambda” intersectoral linkages (especially forward linkages) that are obtained via the Leontief inverse matrix or indeed directly from the input coefficient matrix .
18For a given Input Output table, the matrix {
} is composed of the amount of production output
of sector that provides direct and indirect inputs for one unit of gross output in sector
We introduce the following measures based on and derived from the matrix that we constructed from lambdas (Fujita 2009):
(1) Overall marginal knock-on effect into/from other sectors
(a) ∑
This measure indicates the relative strength of forward linkage (knock-ons) emanating from sector (row sums of matrix) dispersing as direct inputs or indirectly as the result of multi- round intermediate effects throughout other sectors of the economy, (i.e. indirect knock-ons are outputs from sector that take a multitude of possible paths from sector to sector before
“arriving” at the destination sector .
Caveat: The sum over all sectors apart from the originating sector indicates the first-order cumulative effect of knock-ons: If the sum is 4, for example, it indicates that the combined total direct and indirect knock-on effects throughout the economy are up to the order of 4 times production in its own sector. We note, however, that this indicator assumes equally
“sized” sectors. Further, the “indirect” part of the knock-on represents a claim on the output of the receiving sector from the emanating sector; these claims exist in parallel from other receiving sectors, they are not mutually exclusive like direct inputs represented by the input coefficients of matrix . Nevertheless their size indicates the relative strength of knock-ons from each sector, and offers a first-order basis for comparison.
(b)
This measure shows the amount of output emanating from sector that appears as direct and indirect input in each other sector. Here the marginal knock-on effects per unit of gross output of the receiving sector can be compared.
(c) ∑
This measure shows the sum of direct and indirect inputs emanating from each sector per unit of gross output of the receiving sector (column sums of matrix). This measure is analogous to the column sums of the matrix of input coefficients. Caveat: Whereas the latter sum must be less than one, the sum of column lambdas may exceed 1. This is because indirect inputs are those proportions of total input that are ascribable to an emanating sector indirectly, and these “channels of indirect input” may overlap. Thus the sum rather
represents an upper bound in the sense described above for indicator (1a). Nevertheless it is clear that the relative size of this measure is revealing whether more or less direct and
18 Corollary 1, Section 3.2.
30 indirect input is directed to the receiving sector. This situation concerning “embodiment” is not unknown elsewhere: for example, we may describe sectors in terms of their gross output – it is a meaningful measure. However if gross outputs of sectors are summed then the total far exceeds GDP since there are overlapping channels of intermediate outputs. These give rise to:
(d1) Comparison of forward linkage shares
∑ ∑∑
with own sector weight
∑ ∑ (d2) Comparison of backward linkage shares
∑ ∑∑
with own sector weight
∑ ∑ (d3) Comparison of total “send”
∑ ∑∑
shares with total “receiving”
∑ ∑∑
shares.
(2) Total embodied monetary value in other sectors
(a) ∑
where is the total input of sector (cf. Table 2).
This measure counts the entire value of knock-ons, i.e. the total direct and indirect output emanating from sector in monetary units (row entries of matrix multiplied by column sum of input output table, cf. Table 2).
(b)
(c) Comparison of sectoral embodied value ∑
with own sector output . (3) Notional sectoral share of GDP (attributable value added) through all direct and indirect
effects
∑
(i.e. normalised by column sums of matrix)
∑
where is the total input of sector (cf. Table 2).
This measure attributes the contribution to GDP (taken here as sum of value added over all sectors of the economy) to the role played by direct and indirect inputs to each sector, by assuming that knock-ons (normalised lambdas) contribute linearly to the size of value added in each sector.
(a) Comparison of attributable value added with own sector value added .
(4) Shifts in sectoral shares of value added attributable to direct and indirect knock-on effects ⁄
⁄