DISCUSSION PAPER SERIES
Forschungsinstitut zur Zukunft der Arbeit Institute for the Study of Labor
Protestantism and Education:
Reading (the Bible) and Other Skills
IZA DP No. 5402
December 2010 Timo Boppart Josef Falkinger Volker Grossmann
Protestantism and Education:
Reading (the Bible) and Other Skills
Timo Boppart
University of Zurich
Josef Falkinger
University of Zurich, CESifo and IZA
Volker Grossmann
University of Fribourg, CESifo and IZA
Discussion Paper No. 5402 December 2010
IZA
P.O. Box 7240 53072 Bonn
Germany
Phone: +49-228-3894-0 Fax: +49-228-3894-180
E-mail: iza@iza.org
Any opinions expressed here are those of the author(s) and not those of IZA. Research published in this series may include views on policy, but the institute itself takes no institutional policy positions.
The Institute for the Study of Labor (IZA) in Bonn is a local and virtual international research center and a place of communication between science, politics and business. IZA is an independent nonprofit organization supported by Deutsche Post Foundation. The center is associated with the University of Bonn and offers a stimulating research environment through its international network, workshops and conferences, data service, project support, research visits and doctoral program. IZA engages in (i) original and internationally competitive research in all fields of labor economics, (ii) development of policy concepts, and (iii) dissemination of research results and concepts to the interested public.
IZA Discussion Papers often represent preliminary work and are circulated to encourage discussion.
IZA Discussion Paper No. 5402 December 2010
ABSTRACT
Protestantism and Education:
Reading (the Bible) and Other Skills
*During industrialization, Protestants were more literate than Catholics. This paper investigates whether this fact may be led back to the intrinsic motivation of Protestants to read the bible and whether other education motives were involved as well. We employ a historical data set from Switzerland which allows us to differentiate between different cognitive skills: reading, numeracy, essay writing and Swiss history. We develop an estimation strategy to examine whether the impact of religious denomination was particularly large with respect to reading capabilities. We find support for this hypothesis. However, Protestants’ education motives went beyond reading the bible.
JEL Classification: I20
Keywords: cognitive skills, education, reading capability, religious denomination, Protestant reformation
Corresponding author:
Volker Grossmann Department of Economics University of Fribourg Bd. de Pérolles 90, G 424 CH-1700 Fribourg
Switzerland
E-mail: volker.grossmann@unifr.ch
* We are grateful to Christian Dustmann, Guy Kirsch and Aderonke Osikominu for valuable discussions. We are particularly indebted to Ulrich Woitek for providing us with the data.
1 Introduction
Recent research motivated by Max Weber (1905), who hypothesized that Protestants’
work ethic is conducive to faster economic development, has delivered interesting novel insights. For instance, Becker and Woessmann (2009) argue that Protestant regions in late 19th century Prussia grew faster than Catholic areas due to higher literacy rates among Protestants. They provide evidence for pre-industrialization Prussia (the year 1816) that both the density of primary schools and primary school enrollment were higher in Protestant regions.1 In a similar vein, Boppart et al. (2010) investigated for Switzerland the role of religion - in interaction with other sociocultural factors - on per pupil school expenditure and educational performance and show that - on average - Protestant regions were associated with higher school expenditure as well as higher educational performance.
This paper attempts to identify the educational motives of Protestants. Was there a particular emphasis of Protestants for reading capabilities, possibly to read the bible?
Or were Protestants also better skilled in other fields like mathematics? Had they been motivated to develop cognitive skills in general, for instance, in order to achieve material well-being? Distinguishing several dimensions of cognitive skills is critical to answer these questions. The answers are potentially important to understand the fundamental sources of differential regional economic development. For instance, if Protestants reveal higher educational efforts not just in reading, but also in other fields, then in line with Weberian thoughts, we have indications that Protestants saw education also as being instrumental to economic success.
We employ a unique dataset from the second half of 19th century Switzerland (Woitek and Wüthrich, 2010), which allows to measure cognitive skills by conscripts’ marks in the pedagogical examinations on reading, essay writing, numeracy and Swiss history. The pedagogical examinations were based on standardized tests and covered the whole male population. The data set enables us to examine in which education fields there are
1This rules out that the emphasis on schools of Protestant regions were not merely a response to higher demand for human capital during industrialization. Rather, it may have been a result of the reformation process itself, which in Germany has been led by Martin Luther. According to Painter (1886, p. 147):
"Though no complete system of popular instruction was established, the foundation for it was laid. To this great result Luther contributed more than any other man of his time; and this fact makes him the leading educational reformer of the sixteenth century."
differences in test scores between Protestant and Catholic districts and whether possible differences are more pronounced with respect to reading capabilities than for the other three fields covered by the tests. If the hypothesis is correct that bible reading was an important motivation for Protestants to acquire education, the comparatively high emphasis of Protestants on reading capabilities should materialize in high test scores for reading, relative to, say, mathematics. To our best knowledge, this is the first study of skill-specific effects of religion.
For identifying such a "Protestant reading bias" we propose a simple model of individ- ual (effort) investment for developing different kinds of cognitive skills. The theoretical considerations provide us with a structural approach where we estimate the impact of Protestantism on reading skills while controlling for other cognitive skills, like math capa- bility. We employ analogously to Becker and Woessmann (2009, 2010) an instrumentation strategy which relates religious denomination in a district to its distance to the centers of Protestantism in Switzerland (Zurich and Geneva) while at the same time ruling out that distance to bigger cities in general has an important direct effect on cognitive skills. Our evidence suggests that Protestants were indeed particularly motivated to develop read- ing skills relative to other cognitive skills. However, beyond that there is also a general Protestant bias toward education.
Studying within-country variation of cognitive skills in Switzerland at the time of industrialization is particularly appropriate for our purpose. First, Switzerland had little regional differences in institutions, typically hard to control for in cross-country studies.
Second, the Reformation process in the first half of 16th century spread directly from Prussia to Switzerland. The first main reformer in the Old Confederation was Ulrich Zwingli. Zwingli began to preach ideas of reforming the Catholic church after becoming in 1519 pastor at one of the major churches in Zurich (the Grossmünster), shortly after Martin Luther published his 95 theses (October 1517). The city of Zurich converted to Protestantism in 1523, followed by the rural areas in Zurich and then by the cities of St.
Gall, Schaffhausen, Basel, Bienne, Mulhouse, Berne, and Geneva (in 1536). Since 1541 the French theologist John Calvin (Jean Cauvin) gradually implemented a close connection between state and church in Geneva until his death in 1564. His predestination doctrine
2
was the main basis for the Weberian idea of a Protestant work ethic. It holds that Protestants are particularly motivated by material well-being in order to receive a signal of God to be chosen for salvation.
The Calvinist doctrine raises the question whether higher literacy of Protestants was merely a by-product of their motive to read the bible or if education was also perceived as instrumental for economic success. We not only find that there was a Protestant reading bias but also were Protestants better skilled in all other educational fields in our data set.
These results cast severe doubt on a pure bible-reading motive of Protestants’ education.
Our analysis rather suggests that Protestants were also motivated, and more so than Catholics, to invest in other types of education, for instance, for economic reasons. In fact, at the end of the paper we discuss that the main reformers Luther, Zwingli and Calvin themselves had much broader educational goals than enabling the masses to read the bible.
The paper is structured as follows. Section 2 outlines a simple theoretical model from which we develop the estimation strategy. Section 3 describes the data. Empirical results are presented in section 4. Section 5 concludes and shows that the intentions of the main reformers in Switzerland and Prussia with respect to education in the 16th century went beyond reading the bible.
2 A Simple Model
Consider a representative individual in a district. Denote cognitive skill in reading and math by R andM, respectively. Suppose R and M are functions fR andfM of "effort", eR and eM, invested in the respective type of education. Other variables which affect educational outcomes are summarized in vectorx. LetfRandfM be given by the following linear functions:
R = fR(eR,x) = a0+a1eR+x′ax, a1 >0, (1) M = fM(eM,x) =b0+b1eM +x′bx, b1 >0. (2)
Suppose the individual has preferences for both consumption (c) and cognitive skills (R, M), i.e., values education per se. Moreover, suppose that religious denomination af- fects preferences (e.g., the marginal rate of substitution between consumption and cogni- tive skills and/or between different cognitive skills). LetP indicate whether the individual is a Protestant (P = 1) or not (P = 0). Preferences are represented by the utility function u(c, R, M;P).
Disposable income and thus consumption level cis given by a function F which may positively depend on cognitive skills (R, M) and is decreasing in total effort invested in education, e=eR+eM:
c=F(R, M, e). (3)
For instance, more effort allocated to education reduces the time spent to work.
Optimal effort provision towards skills (R, M) is given by
(e∗R(x;P), e∗M(x;P))≡
arg max
(eR,eM)u(F(fR(eR,x), fM(eM,x), eR+eM), fR(eR,x), fM(eM,x);P). (4) Inserting a co-linear approximation of functione∗R for reading efforteR in (1) we obtain
R =α0+α1P +x′αx. (5)
Similarly for math. This suggests to regress measures for different cognitive skills sepa- rately on a measure for Protestantism and other controls.
The approach in (5) does not allow us, however, to compare the effects of religious denomination on different cognitive skills, like reading vs. math skills. This is because both kinds of skills are likely to be highly related to each other and differently distributed.
In order to be able to identify whether Protestants were particularly motivated to develop reading skills vis-à-vis math skills (or others), we divide optimization problem (4) in two parts, finding first the optimal allocation between eR and eM for given total effort e and then, secondly, choosing the optimal level e. We will focus on the optimal choice in the first part to examine whether there is a "Protestant reading bias". Optimal effort choice
4
for given e reads
(˜eR(e,x;P),˜eM(e,x;P))≡
arg max
(eR,eM)u(F(fR(eR,x), fM(eM,x), e), fR(eR,x), fM(eM,x);P) s.t. eR+eM =e. (6) Suppose function ˜eM can be inverted such that we can write e = E(eM,x;P). We then obtain
eR=e−eM =E(eM,x;P)−eM. (7) Let us also invert the functionM =fM(eM,x)in (2) to obtain
eM = M−b0−x′bx
b1 ≡g(M,x). (8)
When we plugeM =g(M,x) into the right-hand side of (7) and the resulting expression for eR into R=fR(eR,x)we get
R=fR(E(g(M,x),x;P)−g(M,x),x)≡R(M, P,˜ x). (9) For instance, consider a linear approximation ofe˜M:
˜
eM(e,x;P)≃γ0+γ1e+x′γx−θP, i.e.,e=E(eM,x;P) = eM −γ0−x′γx+θP
γ1 . (10)
Note that, plausibly, γ1 ∈ (0,1), which means that a marginal increase in total effort e raises both˜eRande˜M. Moreover, and importantly, if Protestantism affects the educational effort structure (eR, eM) towards reading, then θ >0.
Using (8) and (10) in (7) and (1) we find that
R = ˜R(M, P,x) =β0+β1P +β2M +x′βx, with β1 ≡ a1θ
γ1 , β2 ≡ a1(1−γ1)
b1γ1 . (11) We run this type of regression to examine a possible Protestant reading bias.2 Recall that
2As the linear approximation of functione˜M in (10) may be too crude, we also allow, in robustness checks, for an additional term β3P ×M on the right-hand side of (11) when examining the effects of Protestantism and math performance on reading performance. Results can be found in a web-appendix.
They suggest that the effect of Protestantism remains stable, althoughβ3sometimes enters significantly.
In principle, there may also be a non-linear effect of Protestantism on reading performance. However,
effort raises cognitive skills, a1, b1 >0, and that γ1 ∈(0,1). Thus, if β1 >0, we conclude that there is an effort bias of Protestants towards reading (θ > 0). Moreover, we expect β2 >0.3
3 Data and Identification
This section describes the data employed in our empirical analysis and discusses identifi- cation issues. Data sources are provided in a web-appendix.
3.1 Cognitive Skills and Some Statistics
The fraction of Protestants in a district is our main independent variable of interest (P rotestants). Cognitive skills are measured by the results of pedagogical examinations of conscripts in the military service. The tests were compulsory for every male citizen. They were explicitly introduced by the federal state to survey the efficiency of school systems, with high priority given to comparability of results. We use three five-year averages of test scores for the periods 1875-79, 1885-89 and 1899-1903 in panel regressions with time fixed effects. There were standardized test in four subjects: reading, essay-writing, mathematics (written and oral) as well as knowledge of Swiss history and constitution.
In the first five years (1875 to 1879), the grades ranged from 1 (very good) to 4 (poor), and thereafter from 1 to 5. We use the fraction of conscripts with the best grades (1-2) in the four subjects and the fraction of pupils with insufficient grades (4-5) as measures for four kinds of cognitive skills in a district.4
Reading capability,R, is measured in two ways: by the fraction of the best conscripts (Best Reading) and by the fraction who failed (F ailed Reading). Similar measures apply since our measure forP, the share of Protestants in a district, is concentrated on zero and one, we cannot allow for such a non-linear effect due to multicollinearity. For instance, the correlation coefficient between the fraction of Protestants and its squared value is 0.982.
3The coefficients β0 and βx are unimportant and we have no prediction. They are given by β0 ≡ a0−a1b0b(1−γ1γ 1)
1 −aγ1γ0
1 ,βx≡
ax−a1(1−γb1γ1)bx
1 −γγx
1
.
4Conscripts had incentive to do well. Those with grade 4-5 in more than one subject had to take repetition courses during military service. It was also common that names and grades were published in local newspapers.
6
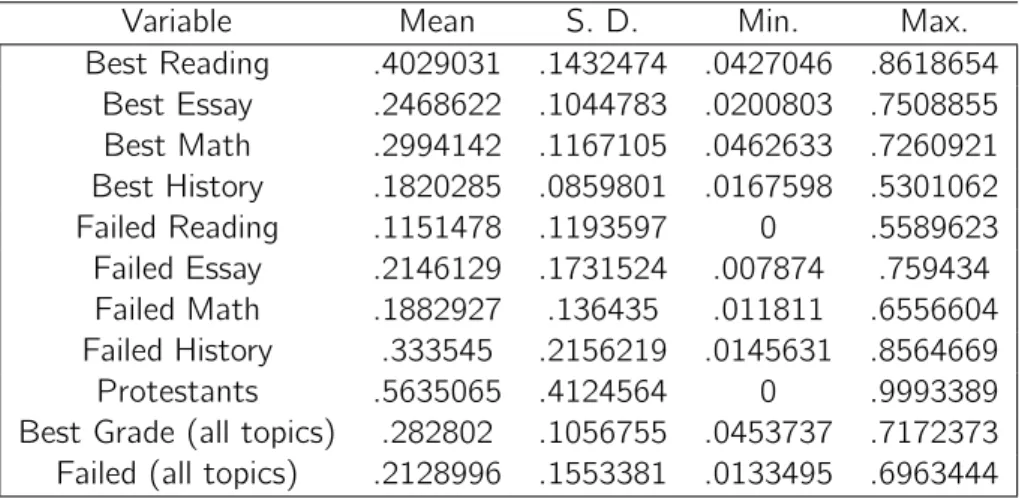
to math,M,and the other two fields, essay writing and history. Tab. 1 provides summary statistics for the pooled sample (all three time periods) of the educational performance measures and the share of Protestants. The variation in the data is remarkable. The fractions of both high-performers and low-performers in an education field range from below 5 percent to above 50 percent, even up to 86 percent. Among the best grades, the highest average and the widest variability is with respect to reading capability (Best Reading), with a mean fraction of high-performers equal to 40.3 percent and a standard deviation of 14.3 percent. On average, 11.5 percent of conscripts failed the reading test (F ailed Reading). The districts where the failure rate in reading was particularly high were all Catholic.5 When all educational fields are combined, the mean fraction of high- performers is 28.3 percent and that of low-performers is 21.3 percent, with standard deviation of 10.6 and 15.5 percent, respectively.
The mean fraction of Protestants averaged over all districts was 56.4 percent. However, the distribution of the share of Protestants in the data is bipolar, with peaks close to zero and one. This is reflected in the very high standard deviation of 0.41.
Tab. 2 provides correlation coefficients between the fractions of high- and low-performers in reading and math on the one hand and between cognitive skills in a district and the share of Protestants on the other hand. One sees that Protestants do better in all fields.
They have more high-performers and less low-performers, with correlation coefficients between religion and skills of magnitudes between 0.22 and 0.30. The share of low- performers in reading is very strongly (albeit far from perfectly) correlated with the share of low-performers in math; an analogous pattern holds for high-performers. Moreover, also not surprisingly, the share of high-performers is negatively correlated with the share of low-performers in and across fields.
5For instance, in the year 1870, the failure rates in reading tests ranged between 50 and 76 percent in the districts Gersau and March (canton of Schwyz), Riviera (Ticino), and Goms, Raron and Visp (Valais), in all of which the fraction of Catholics was above 97 percent.
Table 1: Summary statistics
Variable Mean S. D. Min. Max.
Best Reading .4029031 .1432474 .0427046 .8618654 Best Essay .2468622 .1044783 .0200803 .7508855 Best Math .2994142 .1167105 .0462633 .7260921 Best History .1820285 .0859801 .0167598 .5301062 Failed Reading .1151478 .1193597 0 .5589623 Failed Essay .2146129 .1731524 .007874 .759434 Failed Math .1882927 .136435 .011811 .6556604 Failed History .333545 .2156219 .0145631 .8564669 Protestants .5635065 .4124564 0 .9993389 Best Grade (all topics) .282802 .1056755 .0453737 .7172373 Failed (all topics) .2128996 .1553381 .0133495 .6963444 Notes: Summary statistics of the pooled sample.
Table 2: Correlation
Variable Protestants Best Reading Best Math Failed Reading Failed Math Protestants 1.0000
Best Reading 0.2797* 1.0000
Best Math 0.2964* 0.8419* 1.0000
Failed Reading -0.2297* -0.5811* -0.4702* 1.0000
Failed Math -0.2243* -0.5557* -0.5998* 0.8961* 1.0000 Notes: * significant at the one percentage level.
3.2 Other Controls
We control for the economic, geographical and sociocultural environment of a district by a large set of controls suggested in the literature.6 The stage of economic development is captured by the proportion of population employed in the primary sector (P rimary) and by population density in logs (Density). Thereby, we address the potential concern that our results are driven by a different demand for education in Protestant and Catholic districts. We also control for the altitude above sea level in logs of the main town of a district (Altitude) as a measure of a district’s remoteness. Moreover, we include dummy variables for the majority language in a district (F rench,Italian,Romanic, i.e., German language is the omitted category), since language may be related to religion and may affect attitudes towards schooling. Finally, we account for the ratio of children (below 16 years old) to total population (Children). We want to rule out that our results are driven by a correlation between religious denomination and fertility, with the number of children being negatively related to their skills (labelled "quality-quantity trade-off" in fertility choice models). For instance, it could be the case that Catholics have more children and therefore put less emphasis on education.
In some regressions we also employ various measures of primary school inputs at the district level, which have been suggested by the literature on educational production. This helps us to examine whether possible effects of religious denomination work through re- gional differences in school organization and public school finance. The data were collected for a prize-winning contribution to the World Exhibition in Vienna in 1873 and follow-ups in National Exhibitions. School inputs are aggregated by districts. They cover the years 1871/72 (156 observations), 1881/82 (168 observations) and 1894/95 (169 observations).
We allow school inputs in 1871/72 to affect results of the pedagogical examinations in the period 1875-79, and inputs in 1881/82 and 1894/95 to affect outcomes in 1885-89 and 1899-1903, respectively. We use total annual real public school expenditure per pupil in logs (Expenditure), the real capital stock per pupil in logs (Capital), the pupil-teacher ratio (Class Size), and the number of school weeks (W eeks). Moreover, we control for the number of school days per year a pupil is absent from school in logs (Absenteeism).
6For a more detailed description of the control variables, see Boppart et al. (2010).
This measure can be interpreted as a measure for the degree of utilization of the sup- ply of school services. We also account for characteristics of teachers: the fraction of clerical teachers which either belongs to a religious order or works in a parish (Clerics), the fraction of teachers who do not possess vocational education from university, teacher training seminars or grammar schools (P oor T raining), the fraction of teachers older than 40 years (Age), the fraction of teachers with more than 20 years of service (Length of Service), and the fraction of female teachers (F emale).
3.3 Identification Strategy
We address the concern that OLS estimates (with time fixed effects) of the impact of Protestantism on cognitive skills may not represent causal effects. For instance, when we run regression (5) it could be possible that (average) unobserved ability to acquire education in a district determined, at the time of Reformation, whether a district became Protestant or remained Roman Catholic and then ability was transmitted from generation to generation. In this case, the coefficient on religion would be biased in an OLS estima- tion. As argued in Boppart et al. (2010), the Reformation process in Switzerland could be viewed as a truly exogenous event. Furthermore, with regard to regression (11) endogene- ity seems to be less of a concern. β1 would be biased if Protestantism is correlated with an unobserved variable which affects the reading bias. We control in our estimations for many socio-cultural characteristics as well as for school inputs and absenteeism. Hence, such an unobserved variable is not easy to think of.
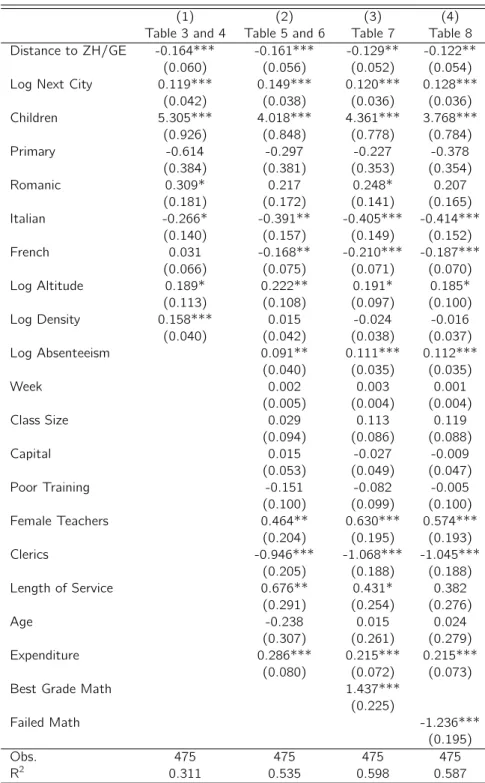
Nevertheless, we follow an instrumental variable strategy which is similar in spirit to Becker and Woessmann (2009) for Prussia (who used the distance to Wittenberg as instrument for Protestantism). In Switzerland the Reformation began in the city of Zurich under church leader Zwingli and then spread to the canton of Zurich before reaching other cities. In the Francophone part, after Geneva adopted Protestantism, the influential figure was Calvin who made Protestantism popular in the West of Switzerland. We therefore take the shorter (log) distance of the main town of a district to one of the two cities Zurich and Geneva as instrument for the share of Protestants in a district. The distances are calculated using historical sources to be able to measure the actual length of routes
9
between the main town of a district and Zurich/Geneva.
With regard to regression (5), one potential problem with instrumenting Protestantism in that way could be that ability was generally more concentrated closer to cities. In this case the identifying assumption, that the distance to Zurich/Geneva is uncorrelated with unobserved variables which affect human capital formation, would be violated. To address the concern that there is such a "city-bias" we additionally control for the (shortest) log distance to one of the six big cities (Zurich, Geneva, St. Gallen, Basel, Berne, Lucerne) in the IV regressions. Then, the identifying assumption is fullfiled as long as unobserved characteristics (as ability) are uncorrelated to the distance to Zurich and Geneva for given proximity to the next big city, population density and altitude. We provide first stage results for our IV estimates in appendix.
4 Empirical Results
We first present the estimation results for all four fields separated (regression (5)), before coming to the question if there was a Protestant reading bias (regression (11)).
4.1 Protestantism and Different Skills
In this subsection we show the results from regressing our measures for cognitive skills in reading, numeracy, essay writing and history separately on the share of Protestants and other controls. We allow for time fixed effects to take into account the panel data structure.
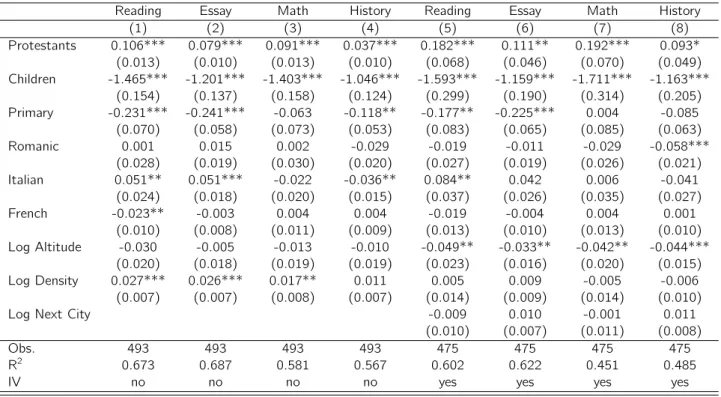
Tab. 3 presents the regression results when the share of high-performers in one of the four subjects is the dependent variable. We control for the stage of development (P rimary, Density), geography (Log Altitude), family structure (Children) and majority language.
In all non-IV estimations (columns (1)-(4)), the effect of Protestantism is significant at the one percent level. Column (1) shows that, on average, a fully Protestant district has a 10.6 percentage points higher fraction of high-performers in reading than a fully Catholic district (coefficient α1 in equation (5)). The effects on math and essay writing skills are somewhat lower, the one on history much lower. The ranking of the sizes of effects corresponds to the average share of high-performers (highest in reading and lowest
Table 3: Effect of Protestantism on the share with best grade
Reading Essay Math History Reading Essay Math History
(1) (2) (3) (4) (5) (6) (7) (8)
Protestants 0.106*** 0.079*** 0.091*** 0.037*** 0.182*** 0.111** 0.192*** 0.093*
(0.013) (0.010) (0.013) (0.010) (0.068) (0.046) (0.070) (0.049) Children -1.465*** -1.201*** -1.403*** -1.046*** -1.593*** -1.159*** -1.711*** -1.163***
(0.154) (0.137) (0.158) (0.124) (0.299) (0.190) (0.314) (0.205) Primary -0.231*** -0.241*** -0.063 -0.118** -0.177** -0.225*** 0.004 -0.085
(0.070) (0.058) (0.073) (0.053) (0.083) (0.065) (0.085) (0.063)
Romanic 0.001 0.015 0.002 -0.029 -0.019 -0.011 -0.029 -0.058***
(0.028) (0.019) (0.030) (0.020) (0.027) (0.019) (0.026) (0.021)
Italian 0.051** 0.051*** -0.022 -0.036** 0.084** 0.042 0.006 -0.041
(0.024) (0.018) (0.020) (0.015) (0.037) (0.026) (0.035) (0.027)
French -0.023** -0.003 0.004 0.004 -0.019 -0.004 0.004 0.001
(0.010) (0.008) (0.011) (0.009) (0.013) (0.010) (0.013) (0.010) Log Altitude -0.030 -0.005 -0.013 -0.010 -0.049** -0.033** -0.042** -0.044***
(0.020) (0.018) (0.019) (0.019) (0.023) (0.016) (0.020) (0.015)
Log Density 0.027*** 0.026*** 0.017** 0.011 0.005 0.009 -0.005 -0.006
(0.007) (0.007) (0.008) (0.007) (0.014) (0.009) (0.014) (0.010)
Log Next City -0.009 0.010 -0.001 0.011
(0.010) (0.007) (0.011) (0.008)
Obs. 493 493 493 493 475 475 475 475
R2 0.673 0.687 0.581 0.567 0.602 0.622 0.451 0.485
IV no no no no yes yes yes yes
Notes: Clustered standard errors in parenthesis. *** significant at, or below, 1 percent, ** significant at, or below, 5 percent, * significant at, or below, 10 percent.
in history; see Tab. 1) and it is not possible to identify a motivational bias towards certain skills from these results. Columns (5)-(8) show IV-results for the same regression equations. As typically the case with instrumentation, standard errors increase such that the coefficient on Protestantism sometimes becomes less significant. However, the magnitudes of the Protestant impact even increase substantially.
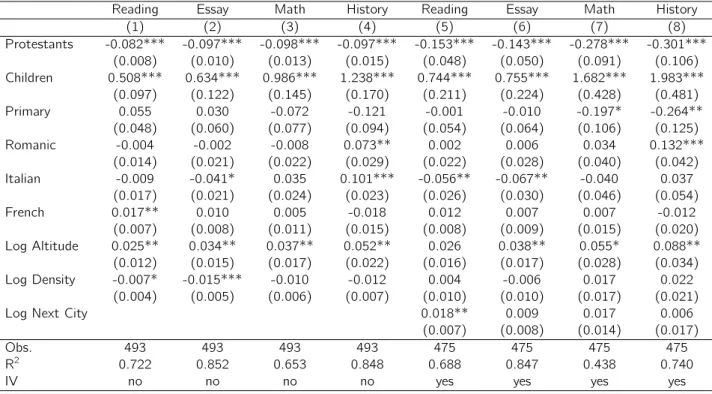
Examining how Protestantism affects the fraction of low-performers gives rise to sim- ilar conclusions. According to Tab. 4, Protestantism is clearly associated with lower failure rates in all four fields, reducing them by almost 10 percentage points in the non- IV estimates. In the IV regressions, again, not only standard errors but also estimated coefficients on Protestantism increase substantially, such that significance levels remain at the one percent level.
Regarding other control variables, all regressions show that the fraction of children in a district has a highly significant and negative effect on cognitive skills, consistent with the well-known notion of a quality-quantity trade-off. A more advanced stage of development (lower agricultural labor share and higher population density) tends to positively affect the share of high-performers but has little effect on low-performers. Altitude tends to be adversely related to skills. The majority language often has no clear effect. However, reading and writing performance tends to be better when Italian is majority language.
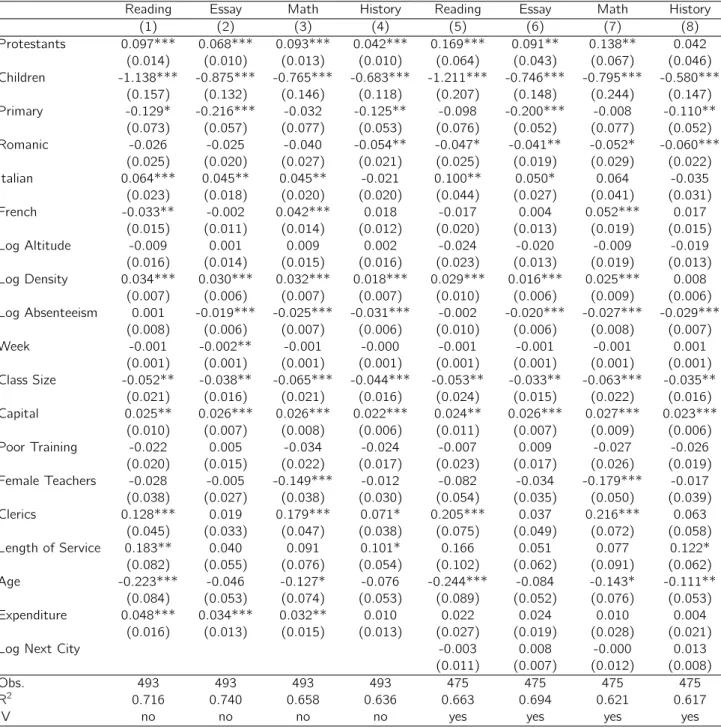
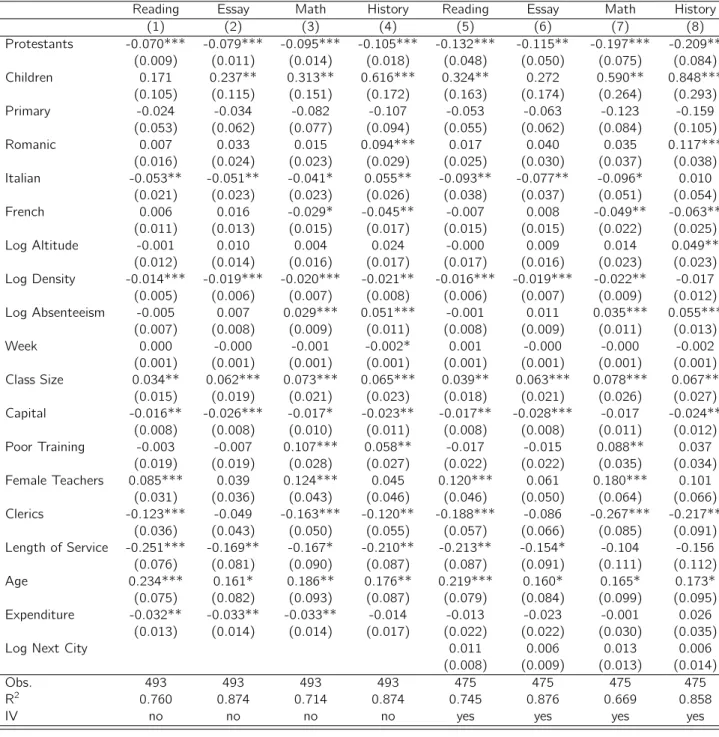
In Tab. 3 and 4 we did not control for school inputs. Tab. 5 and 6 suggest that the main results remain fairly robust to the inclusion of inputs in public schools. Hence, a substantial part of the effect of Protestantism on educational performance seems to work through "effort", rather than school inputs and absenteeism. The sizes of effects of Protestantism drop somewhat in the IV estimations compared to Tab. 3 and 4, now being closer to the non-IV estimates. Higher school expenditure is significantly related to cognitive skills in non-IV estimates (except in history), but not in the IV regressions.7 In contrast, higher class size significantly reduces cognitive skills in all four education fields, including in the IV regressions. Higher absenteeism from school enters in the expected fashion in all fields except in reading, where it has no effect. This indicates that learning
7Given that we control for school capital, class size and teacher characteristics, the effect of school expenditure may best be interpreted as the effect of higher (unobserved) salary of teachers (see Boppart et al., 2010).
Table 4: Effect of Protestantism on the share failed
Reading Essay Math History Reading Essay Math History
(1) (2) (3) (4) (5) (6) (7) (8)
Protestants -0.082*** -0.097*** -0.098*** -0.097*** -0.153*** -0.143*** -0.278*** -0.301***
(0.008) (0.010) (0.013) (0.015) (0.048) (0.050) (0.091) (0.106) Children 0.508*** 0.634*** 0.986*** 1.238*** 0.744*** 0.755*** 1.682*** 1.983***
(0.097) (0.122) (0.145) (0.170) (0.211) (0.224) (0.428) (0.481)
Primary 0.055 0.030 -0.072 -0.121 -0.001 -0.010 -0.197* -0.264**
(0.048) (0.060) (0.077) (0.094) (0.054) (0.064) (0.106) (0.125)
Romanic -0.004 -0.002 -0.008 0.073** 0.002 0.006 0.034 0.132***
(0.014) (0.021) (0.022) (0.029) (0.022) (0.028) (0.040) (0.042)
Italian -0.009 -0.041* 0.035 0.101*** -0.056** -0.067** -0.040 0.037
(0.017) (0.021) (0.024) (0.023) (0.026) (0.030) (0.046) (0.054)
French 0.017** 0.010 0.005 -0.018 0.012 0.007 0.007 -0.012
(0.007) (0.008) (0.011) (0.015) (0.008) (0.009) (0.015) (0.020) Log Altitude 0.025** 0.034** 0.037** 0.052** 0.026 0.038** 0.055* 0.088**
(0.012) (0.015) (0.017) (0.022) (0.016) (0.017) (0.028) (0.034)
Log Density -0.007* -0.015*** -0.010 -0.012 0.004 -0.006 0.017 0.022
(0.004) (0.005) (0.006) (0.007) (0.010) (0.010) (0.017) (0.021)
Log Next City 0.018** 0.009 0.017 0.006
(0.007) (0.008) (0.014) (0.017)
Obs. 493 493 493 493 475 475 475 475
R2 0.722 0.852 0.653 0.848 0.688 0.847 0.438 0.740
IV no no no no yes yes yes yes
Notes: Clustered standard errors in parenthesis. *** significant at, or below, 1 percent, ** significant at, or below, 5 percent, * significant at, or below, 10 percent.
Table 5: Effect of Protestantism on the share with best grade
Reading Essay Math History Reading Essay Math History
(1) (2) (3) (4) (5) (6) (7) (8)
Protestants 0.097*** 0.068*** 0.093*** 0.042*** 0.169*** 0.091** 0.138** 0.042 (0.014) (0.010) (0.013) (0.010) (0.064) (0.043) (0.067) (0.046) Children -1.138*** -0.875*** -0.765*** -0.683*** -1.211*** -0.746*** -0.795*** -0.580***
(0.157) (0.132) (0.146) (0.118) (0.207) (0.148) (0.244) (0.147) Primary -0.129* -0.216*** -0.032 -0.125** -0.098 -0.200*** -0.008 -0.110**
(0.073) (0.057) (0.077) (0.053) (0.076) (0.052) (0.077) (0.052)
Romanic -0.026 -0.025 -0.040 -0.054** -0.047* -0.041** -0.052* -0.060***
(0.025) (0.020) (0.027) (0.021) (0.025) (0.019) (0.029) (0.022)
Italian 0.064*** 0.045** 0.045** -0.021 0.100** 0.050* 0.064 -0.035
(0.023) (0.018) (0.020) (0.020) (0.044) (0.027) (0.041) (0.031)
French -0.033** -0.002 0.042*** 0.018 -0.017 0.004 0.052*** 0.017
(0.015) (0.011) (0.014) (0.012) (0.020) (0.013) (0.019) (0.015)
Log Altitude -0.009 0.001 0.009 0.002 -0.024 -0.020 -0.009 -0.019
(0.016) (0.014) (0.015) (0.016) (0.023) (0.013) (0.019) (0.013) Log Density 0.034*** 0.030*** 0.032*** 0.018*** 0.029*** 0.016*** 0.025*** 0.008
(0.007) (0.006) (0.007) (0.007) (0.010) (0.006) (0.009) (0.006) Log Absenteeism 0.001 -0.019*** -0.025*** -0.031*** -0.002 -0.020*** -0.027*** -0.029***
(0.008) (0.006) (0.007) (0.006) (0.010) (0.006) (0.008) (0.007)
Week -0.001 -0.002** -0.001 -0.000 -0.001 -0.001 -0.001 0.001
(0.001) (0.001) (0.001) (0.001) (0.001) (0.001) (0.001) (0.001) Class Size -0.052** -0.038** -0.065*** -0.044*** -0.053** -0.033** -0.063*** -0.035**
(0.021) (0.016) (0.021) (0.016) (0.024) (0.015) (0.022) (0.016) Capital 0.025** 0.026*** 0.026*** 0.022*** 0.024** 0.026*** 0.027*** 0.023***
(0.010) (0.007) (0.008) (0.006) (0.011) (0.007) (0.009) (0.006)
Poor Training -0.022 0.005 -0.034 -0.024 -0.007 0.009 -0.027 -0.026
(0.020) (0.015) (0.022) (0.017) (0.023) (0.017) (0.026) (0.019) Female Teachers -0.028 -0.005 -0.149*** -0.012 -0.082 -0.034 -0.179*** -0.017
(0.038) (0.027) (0.038) (0.030) (0.054) (0.035) (0.050) (0.039)
Clerics 0.128*** 0.019 0.179*** 0.071* 0.205*** 0.037 0.216*** 0.063
(0.045) (0.033) (0.047) (0.038) (0.075) (0.049) (0.072) (0.058)
Length of Service 0.183** 0.040 0.091 0.101* 0.166 0.051 0.077 0.122*
(0.082) (0.055) (0.076) (0.054) (0.102) (0.062) (0.091) (0.062)
Age -0.223*** -0.046 -0.127* -0.076 -0.244*** -0.084 -0.143* -0.111**
(0.084) (0.053) (0.074) (0.053) (0.089) (0.052) (0.076) (0.053)
Expenditure 0.048*** 0.034*** 0.032** 0.010 0.022 0.024 0.010 0.004
(0.016) (0.013) (0.015) (0.013) (0.027) (0.019) (0.028) (0.021)
Log Next City -0.003 0.008 -0.000 0.013
(0.011) (0.007) (0.012) (0.008)
Obs. 493 493 493 493 475 475 475 475
R2 0.716 0.740 0.658 0.636 0.663 0.694 0.621 0.617
IV no no no no yes yes yes yes
Notes: Clustered standard errors in parenthesis. *** significant at, or below, 1 percent, ** significant at, or below, 5 percent, * significant at, or below, 10 percent.
Table 6: Effect of Protestantism on the share who failed
Reading Essay Math History Reading Essay Math History
(1) (2) (3) (4) (5) (6) (7) (8)
Protestants -0.070*** -0.079*** -0.095*** -0.105*** -0.132*** -0.115** -0.197*** -0.209**
(0.009) (0.011) (0.014) (0.018) (0.048) (0.050) (0.075) (0.084)
Children 0.171 0.237** 0.313** 0.616*** 0.324** 0.272 0.590** 0.848***
(0.105) (0.115) (0.151) (0.172) (0.163) (0.174) (0.264) (0.293)
Primary -0.024 -0.034 -0.082 -0.107 -0.053 -0.063 -0.123 -0.159
(0.053) (0.062) (0.077) (0.094) (0.055) (0.062) (0.084) (0.105)
Romanic 0.007 0.033 0.015 0.094*** 0.017 0.040 0.035 0.117***
(0.016) (0.024) (0.023) (0.029) (0.025) (0.030) (0.037) (0.038) Italian -0.053** -0.051** -0.041* 0.055** -0.093** -0.077** -0.096* 0.010
(0.021) (0.023) (0.023) (0.026) (0.038) (0.037) (0.051) (0.054)
French 0.006 0.016 -0.029* -0.045** -0.007 0.008 -0.049** -0.063**
(0.011) (0.013) (0.015) (0.017) (0.015) (0.015) (0.022) (0.025)
Log Altitude -0.001 0.010 0.004 0.024 -0.000 0.009 0.014 0.049**
(0.012) (0.014) (0.016) (0.017) (0.017) (0.016) (0.023) (0.023) Log Density -0.014*** -0.019*** -0.020*** -0.021** -0.016*** -0.019*** -0.022** -0.017
(0.005) (0.006) (0.007) (0.008) (0.006) (0.007) (0.009) (0.012) Log Absenteeism -0.005 0.007 0.029*** 0.051*** -0.001 0.011 0.035*** 0.055***
(0.007) (0.008) (0.009) (0.011) (0.008) (0.009) (0.011) (0.013)
Week 0.000 -0.000 -0.001 -0.002* 0.001 -0.000 -0.000 -0.002
(0.001) (0.001) (0.001) (0.001) (0.001) (0.001) (0.001) (0.001) Class Size 0.034** 0.062*** 0.073*** 0.065*** 0.039** 0.063*** 0.078*** 0.067**
(0.015) (0.019) (0.021) (0.023) (0.018) (0.021) (0.026) (0.027) Capital -0.016** -0.026*** -0.017* -0.023** -0.017** -0.028*** -0.017 -0.024**
(0.008) (0.008) (0.010) (0.011) (0.008) (0.008) (0.011) (0.012)
Poor Training -0.003 -0.007 0.107*** 0.058** -0.017 -0.015 0.088** 0.037
(0.019) (0.019) (0.028) (0.027) (0.022) (0.022) (0.035) (0.034) Female Teachers 0.085*** 0.039 0.124*** 0.045 0.120*** 0.061 0.180*** 0.101
(0.031) (0.036) (0.043) (0.046) (0.046) (0.050) (0.064) (0.066) Clerics -0.123*** -0.049 -0.163*** -0.120** -0.188*** -0.086 -0.267*** -0.217**
(0.036) (0.043) (0.050) (0.055) (0.057) (0.066) (0.085) (0.091) Length of Service -0.251*** -0.169** -0.167* -0.210** -0.213** -0.154* -0.104 -0.156
(0.076) (0.081) (0.090) (0.087) (0.087) (0.091) (0.111) (0.112)
Age 0.234*** 0.161* 0.186** 0.176** 0.219*** 0.160* 0.165* 0.173*
(0.075) (0.082) (0.093) (0.087) (0.079) (0.084) (0.099) (0.095)
Expenditure -0.032** -0.033** -0.033** -0.014 -0.013 -0.023 -0.001 0.026
(0.013) (0.014) (0.014) (0.017) (0.022) (0.022) (0.030) (0.035)
Log Next City 0.011 0.006 0.013 0.006
(0.008) (0.009) (0.013) (0.014)
Obs. 493 493 493 493 475 475 475 475
R2 0.760 0.874 0.714 0.874 0.745 0.876 0.669 0.858
IV no no no no yes yes yes yes
Notes: Clustered standard errors in parenthesis. *** significant at, or below, 1 percent, ** significant at, or below, 5 percent, * significant at, or below, 10 percent.
effort at home, including that of parents, is particularly important to develop reading skills.
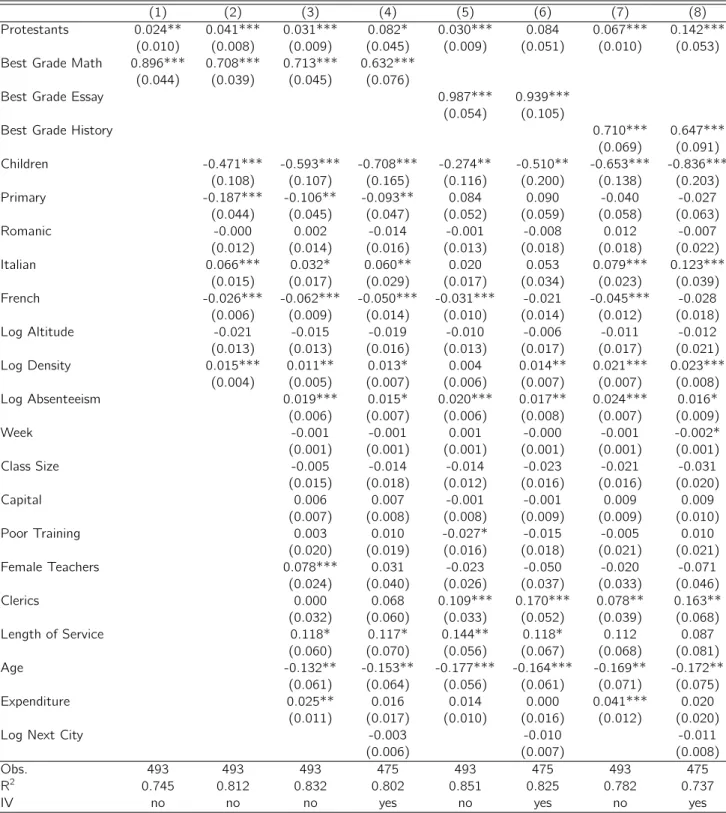
4.2 Protestant Reading Bias
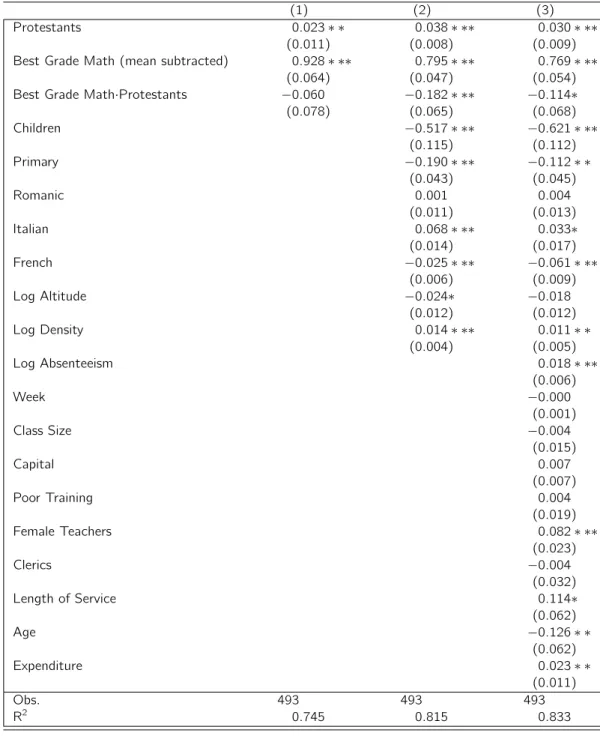
Tab. 7 shows the results when regressing (11), i.e. the share of high-performers in read- ing on Protestantism and on the fraction of high-performers in math, essay writing and history, respectively, in order to identify whether there is a reading bias of Protestants vis-à-vis other skills. The results show that indeed, β1 > 0 (the coefficient on Protes- tantism) and as expected alsoβ2 >0(the coefficient on skill different to reading) hold in an estimation of equation (11). Columns (1)-(3) are non-IV estimations where we hold the fraction of high-performers in math constant. The coefficients of interest (β1, β2) seem to be quite robust to the inclusion of more control variables.
Column (3) suggests that a (purely) Protestant district has 3.1 percentage points more high-performers than a (purely) Catholic district (β1 = 0.031), given that both kinds of districts have the same fraction of high-performers in math. Column (4) provides IV estimates when all controls are included with again math skill held constant. Coefficient β1 more than doubles to0.082, suggesting an even higher Protestant reading bias. Again, significance declines in the IV estimation, as standard errors are substantially enlarged by instrumentation. Moreover, as expected, math performance and reading performance are highly related (β2 >0).
Columns (5)-(6) and (7)-(8) present analogous results when holding fixed the share of high-performers in essay writing and history, respectively, rather than in math. The Protestant reading bias is similar with a given fraction of high-performers in essay writing compared to columns (3) and (4). It is about twice as high when instead controlling for the fraction of high-performers in history. In this case, the Protestant reading bias not only increases in the IV regression but also stays significant at the one percent level. Column (8) suggests that a Protestant district has 14.2 percentage points more high-performers in reading than a Catholic district when holding constant the fraction of high-performers in history. The size of the effect is as high as about one standard deviation in the dependent variable (see Tab. 1).
Table 7: Dependent variable: share with best grade in reading
(1) (2) (3) (4) (5) (6) (7) (8)
Protestants 0.024** 0.041*** 0.031*** 0.082* 0.030*** 0.084 0.067*** 0.142***
(0.010) (0.008) (0.009) (0.045) (0.009) (0.051) (0.010) (0.053) Best Grade Math 0.896*** 0.708*** 0.713*** 0.632***
(0.044) (0.039) (0.045) (0.076)
Best Grade Essay 0.987*** 0.939***
(0.054) (0.105)
Best Grade History 0.710*** 0.647***
(0.069) (0.091) Children -0.471*** -0.593*** -0.708*** -0.274** -0.510** -0.653*** -0.836***
(0.108) (0.107) (0.165) (0.116) (0.200) (0.138) (0.203)
Primary -0.187*** -0.106** -0.093** 0.084 0.090 -0.040 -0.027
(0.044) (0.045) (0.047) (0.052) (0.059) (0.058) (0.063)
Romanic -0.000 0.002 -0.014 -0.001 -0.008 0.012 -0.007
(0.012) (0.014) (0.016) (0.013) (0.018) (0.018) (0.022)
Italian 0.066*** 0.032* 0.060** 0.020 0.053 0.079*** 0.123***
(0.015) (0.017) (0.029) (0.017) (0.034) (0.023) (0.039)
French -0.026*** -0.062*** -0.050*** -0.031*** -0.021 -0.045*** -0.028
(0.006) (0.009) (0.014) (0.010) (0.014) (0.012) (0.018)
Log Altitude -0.021 -0.015 -0.019 -0.010 -0.006 -0.011 -0.012
(0.013) (0.013) (0.016) (0.013) (0.017) (0.017) (0.021)
Log Density 0.015*** 0.011** 0.013* 0.004 0.014** 0.021*** 0.023***
(0.004) (0.005) (0.007) (0.006) (0.007) (0.007) (0.008)
Log Absenteeism 0.019*** 0.015* 0.020*** 0.017** 0.024*** 0.016*
(0.006) (0.007) (0.006) (0.008) (0.007) (0.009)
Week -0.001 -0.001 0.001 -0.000 -0.001 -0.002*
(0.001) (0.001) (0.001) (0.001) (0.001) (0.001)
Class Size -0.005 -0.014 -0.014 -0.023 -0.021 -0.031
(0.015) (0.018) (0.012) (0.016) (0.016) (0.020)
Capital 0.006 0.007 -0.001 -0.001 0.009 0.009
(0.007) (0.008) (0.008) (0.009) (0.009) (0.010)
Poor Training 0.003 0.010 -0.027* -0.015 -0.005 0.010
(0.020) (0.019) (0.016) (0.018) (0.021) (0.021)
Female Teachers 0.078*** 0.031 -0.023 -0.050 -0.020 -0.071
(0.024) (0.040) (0.026) (0.037) (0.033) (0.046)
Clerics 0.000 0.068 0.109*** 0.170*** 0.078** 0.163**
(0.032) (0.060) (0.033) (0.052) (0.039) (0.068)
Length of Service 0.118* 0.117* 0.144** 0.118* 0.112 0.087
(0.060) (0.070) (0.056) (0.067) (0.068) (0.081)
Age -0.132** -0.153** -0.177*** -0.164*** -0.169** -0.172**
(0.061) (0.064) (0.056) (0.061) (0.071) (0.075)
Expenditure 0.025** 0.016 0.014 0.000 0.041*** 0.020
(0.011) (0.017) (0.010) (0.016) (0.012) (0.020)
Log Next City -0.003 -0.010 -0.011
(0.006) (0.007) (0.008)
Obs. 493 493 493 475 493 475 493 475
R2 0.745 0.812 0.832 0.802 0.851 0.825 0.782 0.737
IV no no no yes no yes no yes
Notes: Clustered standard errors in parenthesis. *** significant at, or below, 1 percent, ** significant at, or below, 5 percent, * significant at, or below, 10 percent.
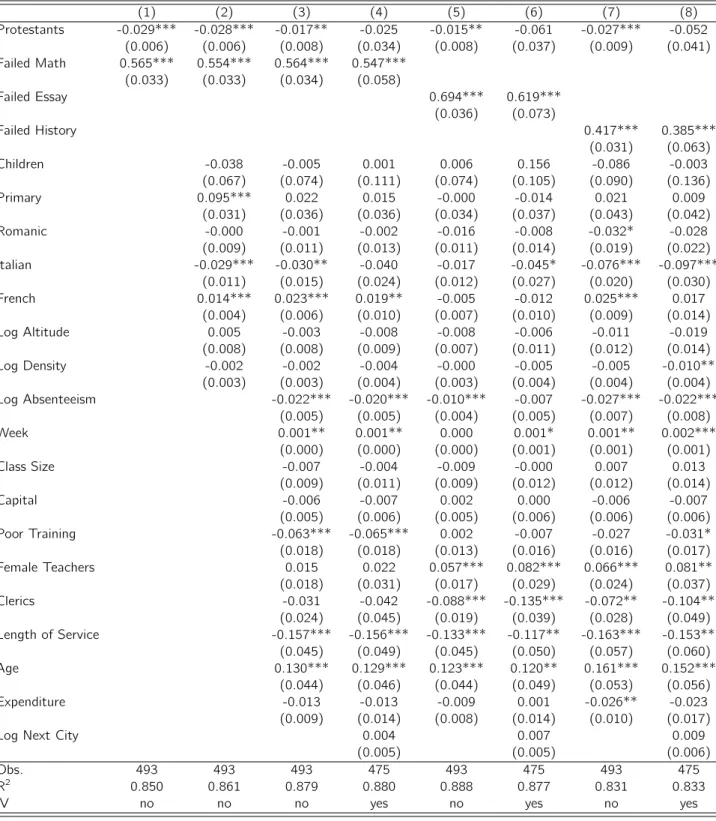
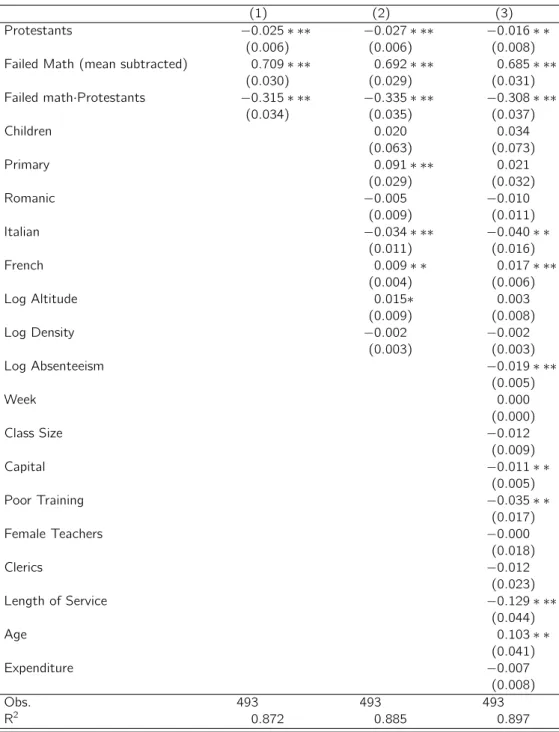
Tab. 8 presents the results for low-performers. It confirms the Protestant reading bias.
Switching from a Catholic to a Protestant district reduces the fraction of low-performers by about 2 percentage points for a given fraction of low-performers in math (columns (3) and (4)). The coefficients of Protestantism are not significant in the IV estimates (columns (4), (6), (8)). However, again, their increased magnitudes suggest a higher Protestant reading bias than the non-IV estimates. The magnitude of β1 is generally smaller than for the high-performers in Tab. 8. This is understandable in the light of the low failure rates in reading tests. As seen in Tab. 1, on average, only 11.5 percent failed the test compared to a fraction of high-performers in reading of 40.2 percent.
Again, we also find that β2 > 0. Moreover, both Tab. 7 and 8 show that there is also evidence for a positive "language reading bias" in Italian-speaking districts and often a negative one in Francophone districts (relative to German-speaking ones). But clearly, this could also reflect language specific difficulties of reading. Tab. 7 also suggests an adverse reading bias from more children. The fraction of children has no clear effect, however, on the share of low-performers in reading, holding other skills constant (Tab. 8).
If anything, a higher stage of development produces a positive reading bias. Particularly, higher population density seems to improve reading skills when holding fixed other skills.
Altitude does not matter. But teacher characteristics sometimes do. A higher fraction of teachers with more than 20 years of service generally improves reading skills for given other skills. The fraction of older teachers (above age 40), however, when holding fixed teachers’ experience, seem to produce an opposite bias away from reading skills. Higher absenteeism, by contrast, gives rise to a positive reading bias. Again, consistent with Tab. 5 and 6, this suggests that participation in school is more important for other fields than reading. School capital does not seem to matter. Finally, if anything, public expenditure per pupil give rise to a rather weak reading bias. As average spending is higher in Protestant districts (see Boppart et al., 2010), this suggests that the Protestant reading bias mainly comes from effort choices of parents or children outside school, rather than reflecting the use of public expenditure for primary schools.