NBER WORKING PAPER SERIES
ACCOUNTABILITY AND FLEXIBILITY IN PUBLIC SCHOOLS:
EVIDENCE FROM BOSTON'S CHARTERS AND PILOTS Atila Abdulkadiroglu
Joshua Angrist Susan Dynarski Thomas J. Kane Parag Pathak Working Paper 15549
http://www.nber.org/papers/w15549
NATIONAL BUREAU OF ECONOMIC RESEARCH 1050 Massachusetts Avenue
Cambridge, MA 02138 November 2009
The authors are grateful to the Boston Foundation for financial support and to Boston's charter schools, the Boston Public Schools, and Carrie Conaway, Mary Street, and the staff of the Massachusetts Department of Elementary and Secondary Education for data and assistance. Sarah Cohodes, Jon Fullerton and the staff of the Center for Education Policy Research at Harvard University played a critical role in this project. We also thank Bruno Ferman, Yuqiao Huang, Simone Schaner, Chris Walters, and Victor Vazquez for expert research assistance. We benefited from comments by Derek Neal and seminar participants at the Bank of Italy, the LSE, McGill, the New York Fed, UBC, UC Dublin, UCLA, UC Riverside, UIUC, ZEW, and the November 2009 New Directions in the Economic Analysis of Education Conference at the University of Chicago. Abdulkadiroglu acknowledges an NSF-CAREER award.
Pathak thanks the Rappaport Institute for Greater Boston for research support. The views expressed herein are those of the author(s) and do not necessarily reflect the views of the National Bureau of Economic Research.
NBER working papers are circulated for discussion and comment purposes. They have not been peer- reviewed or been subject to the review by the NBER Board of Directors that accompanies official NBER publications.
© 2009 by Atila Abdulkadiroglu, Joshua Angrist, Susan Dynarski, Thomas J. Kane, and Parag Pathak.
All rights reserved. Short sections of text, not to exceed two paragraphs, may be quoted without explicit
Accountability and Flexibility in Public Schools: Evidence from Boston's Charters and Pilots Atila Abdulkadiroglu, Joshua Angrist, Susan Dynarski, Thomas J. Kane, and Parag Pathak NBER Working Paper No. 15549
November 2009, Revised December 2009 JEL No. H52,I21,I28,J24
ABSTRACT
Charter schools are publicly funded but operate outside the regulatory framework and collective bargaining agreements characteristic of traditional public schools. In return for this freedom, charter schools are subject to heightened accountability. This paper estimates the impact of charter school attendance on student achievement using data from Boston, where charter schools enroll a growing share of students.
We also evaluate an alternative to the charter model, Boston's pilot schools. These schools have some of the independence of charter schools, but operate within the school district, face little risk of closure, and are covered by many of same collective bargaining provisions as traditional public schools. Estimates using student assignment lotteries show large and significant test score gains for charter lottery winners in middle and high school. In contrast, lottery-based estimates for pilot schools are small and mostly insignificant. The large positive lottery-based estimates for charter schools are similar to estimates constructed using statistical controls in the same sample, but larger than those using statistical controls in a wider sample of schools. The latter are still substantial, however. The estimates for pilot schools are smaller and more variable than those for charters, with some significant negative effects.
Atila Abdulkadiroglu Duke University
Department of Economics Durham, NC 27708
atila.abdulkadiroglu@duke.edu Joshua Angrist
Department of Economics MIT, E52-353
50 Memorial Drive
Cambridge, MA 02142-1347 and NBER
angrist@mit.edu Susan Dynarski
University of Michigan Weill Hall
735 South State Street Ann Arbor, MI 48109-3091 and NBER
dynarski@umich.edu
Thomas J. Kane
Harvard Graduate School of Education Gutman Library, Room 455
Appian Way
Cambridge, MA 02138 and NBER
kaneto@gse.harvard.edu Parag Pathak
Assistant Professor of Economics E52-391C
MIT Department of Economics Cambridge, MA 02142
and NBER
ppathak@mit.edu
I Introduction
Charter schools operate with considerably more independence than traditional public schools. They are free to structure their curriculum and school environment; for instance, many charter schools fit more instructional hours into a year by running longer school days and providing instruction on weekends and during the summer (Matthews 2009, Wilson 2008, Hoxby et al, 2009). Because few charter schools are unionized, they can hire and fire teachers and administrative staff without regard to the collectively bargained seniority and tenure provisions that constrain such decisions in most public schools. Although charter students made up only 2.9 percent of U.S. public school enrollment in 2008-2009, charter enrollment has grown rapidly and seems likely to accelerate in the near future (NAPCS 2009). The growth of charter schools is an important component of the contemporary education reform movement’s pursuit of accountability and flexibility in public education.
Proponents see charter schools’ freedom from regulation as a source of educational innovation, with the added benefit of providing a source of competition that may prompt innovation and improvement in the rest of the public system. At the same time, charter schools are controversial because, after a transition period in which the state provides subsidies, they receive a tuition payment for each enrolled student paid by students’ home (or “sending”) districts. In Massachusetts, the site of our study, tuition payments are determined largely by the average per-pupil expenditure in sending districts.
Not surprisingly, therefore, public school districts are concerned about the revenue lost when their students enroll in charter schools.
The purpose of this paper is to assess the causal effects of charter school attendance and a closely related alternative, called pilot schools, on student achievement. Pilot schools arose in Boston as a union-supported alternative to charter schools.1 Boston’s charter schools are legally constituted by the state as individual school districts and therefore operate independently of the Boston Public Schools (BPS). In contrast, Boston’s pilot schools are legally part of the BPS district, and the extent to which they operate outside collective bargaining provisions is spelled out in school-specific election-to-work agreements signed by pilot faculty. In addition to these negotiated exemptions, pilot schools have generally greater flexibility and decision-making powers over school budgets, academic programs, and educational policies than do traditional BPS schools. This includes freedom with regard to policies related to student promotion, graduation, discipline, and attendance.2
1See Center for Collaborative Education (2006).
2See the Boston Teachers Union website (http://www.btu.org/leftnavbar/HP PilotSchools.htm), which also notes:
“Pilot schools do not have to purchase a variety of services provided by the central office, such as substitute teachers, textbook, SPED contracted services, and academic coaches. By not purchasing these services pilot schools ‘save’ , typically, $300 to $400 per year per student. They are allowed to retain these funds and purchase these services privately if they wish.”
In practice, pilot schools occupy a middle ground between charter schools and traditional public schools. Their teachers are part of the Boston Teachers Union (BTU), with their pay, benefits and working hours determined by the district-wide BTU contract. On the other hand, pilot schools can set their own policies with regard to curriculum, student promotion, and graduation. They also fit more instructional hours into a school year than traditional schools, but not as many as the charter schools.
Accountability standards appear to bind less strictly for pilot schools than for charter schools: while nine Massachusetts charters have been lost, no pilot school has been closed.
The charter and pilot school models fit into a broader movement towards choice and decentral- ization in public education. Related policy experiments that have also been the subject of impact evaluations include vouchers (Rouse 1998; Angrist, Bettinger, Bloom, King and Kremer 2002), mag- net schools (Cullen, Jacob, and Levitt 2006), and intra-district choice plans (Abdulkadiro˘glu and S¨onmez 2003; Hastings, Kane and Staiger 2008; Abdulkadiro˘glu, Pathak and Roth 2009). Charter schools appear to be one of the most widely replicated members of this reform family.
The schools in our study are attended by students who would otherwise attend traditional Boston public schools. The Boston Public Schools (BPS) system serves a disproportionately Black and His- panic student population. Like students in many urban schools, BPS students have lower test scores and lower rates of high school graduation and college attendance than students from nearby suburban districts. Boston’s charter schools also serve a high proportion of Black students, even relative to the majority non-white BPS district. The effects of charter schools in urban populations are of special interest since any gains in this context might help reduce the black-white achievement gap.
The major empirical challenge in any study of alternative school models is selection bias. Students who attend charter and pilot schools differ in a number of ways from the general pool of public school students, a fact that biases naive comparisons. We can hope to eliminate some of this bias by controlling for student characteristics such as free lunch status, but the possibility of bias from unobserved variables such as motivation or family background remains. An important aspect of our study, therefore, is the use of student admissions lotteries to estimate causal effects. These lotteries, which admit applicants randomly at over-subscribed schools, are used to construct a quasi- experimental research design that should generate unbiased estimates of the causal effects of charter and pilot attendance.
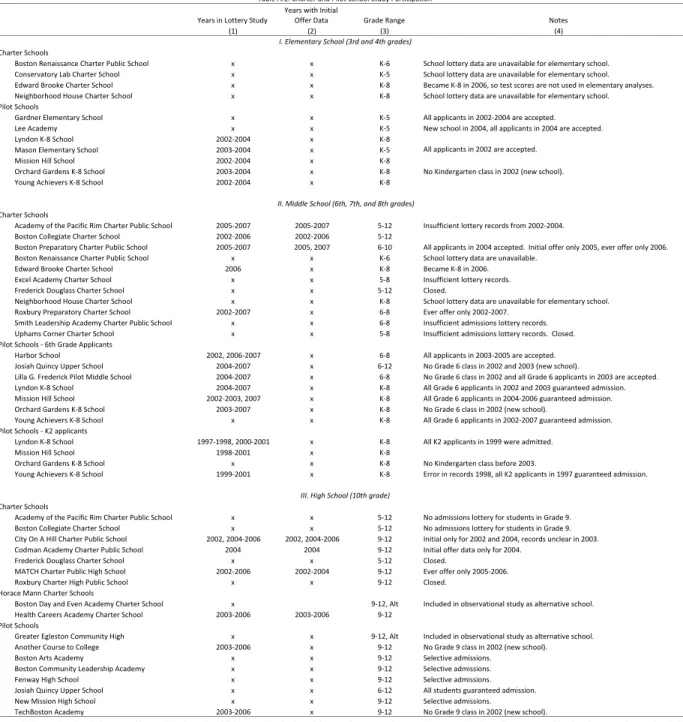
A charter or pilot school contributes application cohorts to our lottery estimates when the school is over-subscribed and therefore runs a lottery, has complete lottery records, and, in the case of pilots, uses a lottery to select students.3 In addition, the charter schools in our lottery sample were all operating at the time we were collecting lottery data (closed charter schools have often been under-
3More precisely, a given school-year-grade cell contributes to the lottery analysis if entry at that point is over- subscribed and the resultant lottery records are available.
subscribed). These selection criteria may have consequences for the external validity of our results.
The over-subscription condition tilts our sample towards charter and pilot schools that parents find appealing, as does the requirement that schools still be open. From a policy perspective, however, this is an interesting set of schools. As it stands, Massachusetts currently limits both the number of charter schools and the proportion of a district’s budget that can be lost due to charter enrollment.
Were the supply of alternative school models allowed to freely vary, it seems reasonable to expect currently operating over-subscribed schools to expand and imitators to open similar schools.
The requirement that participating schools have complete lottery records also affects our selection of charter schools for the lottery sample. Specifically, the records requirement tilts the charter lottery sample towards schools that have archived lottery records. Massachusetts law does not require charter schools to retain their lottery data. The net impact of the record-keeping constraint is unclear. On one hand, poor record-keeping may be a sign of disorganization that spills over into teaching. On the other hand, lottery record-keeping may be a distraction that takes time and energy away from instructional activity. In some cases, lost records are also a result of bad luck and the fact that the preservation of lottery data is not a priority once the school admissions process is complete.
Finally, on the pilot side, not all schools use the centralized lottery system that is embedded in the BPS school assignment mechanism. Some pilot schools opt out of the BPS assignment mechanism and chose students by a combination of admissions testing or audition. Non-lottery pilots share this feature with Boston’s elite exam schools (the most famous of which is the Boston Latin School). In contrast, over-subscribed charters must use lotteries to select students.
In an effort to gauge the generality of our lottery-based findings, we complement the quasi- experimental lottery analysis with an observational analysis of the full set of charter and pilot schools.
The observational analysis controls for demographic and background characteristics as well as stu- dents’ lagged test scores (for example, the elementary school scores of middle school students). This investigation produces estimates remarkably similar to the lottery-based estimates when carried out in the sample of charter schools that have lotteries, lending some credence to the observational analysis.
At the same time, the observational analysis suggests that the charter schools in our sample are better than others in the sense of generating larger treatment effects. We therefore think of our (mostly positive) charter estimates as indicative of what a certain charter model can accomplish, rather than an overall charter-school treatment effect.
For pilot middle schools, the observational analysis also generates results that are broadly consistent with the lottery-based analysis, but the observational results for pilot high schools are more positive than the corresponding lottery-based estimates. This leaves a somewhat muddled picture. Across all designs and samples, however, the estimate effects of attending a pilot school are smaller than the
corresponding charter estimates. In the subsample of pilot middle schools that serve only grades 6-8, lottery-based estimates of effects on middle school math scores are negative and significantly different from zero.
The next section describes Boston’s charter and pilot schools in more detail and briefly discusses a few related studies and questions. Following that, Section III lays out our lottery-based estimation framework while Section IV discusses data and descriptive statistics. Section V presents the main lottery analysis. Section VI discusses the characteristics of the charter and pilot lottery compliers and reports results from models with ability interactions and possible peer effects. Section VII reports observational results from a broader sample, and compares these to the lottery estimates. The paper concludes in Section VIII.
II Background
The 1993 Massachusetts Education Reform Act opened the door to charter schools in Massachusetts.
Non-profit organizations, universities, teachers and parents can apply to the state’s Board of Elemen- tary and Secondary Education for a charter (there are no for-profit charter schools in Massachusetts).
Massachusetts charter schools are generally managed by a board of trustees and are independent of local school committees. Like other public schools, charter schools charge no tuition and are funded mostly by sending districts according to formulas set by the state.
Massachusetts charter schools have a number of organizational features in common with charter schools in other states. First, they are typically outside local collective bargaining agreements. As a result, they have greater flexibility than traditional public schools when it comes to staffing, com- pensation, and scheduling. For example, the five Massachusetts charter schools studied by Merseth (2009), four of which appear in our lottery sample, have a longer school day and year than public schools. Many charter schools offer extensive tutoring during and after school. Moreover, teachers in charter schools need not hold an active state license to begin teaching, though they must pass the Massachusetts Test for Educator Licensure within the first year of employment.
Wilson (2008) describes seven Boston charters, six of which are in our lottery sample, as well as a charter school in Lynn, near Boston. Wilson identifies school practices prevalent at the schools in his sample. This collection of practices is sometimes said to characterize the “No Excuses” model, a term that probably originates with Thernstrom and Thernstom (2003). No Excuses schools are character- ized by small size, frequent testing, a long school day and year, selective teacher hiring, and a strong student work ethic. Other features include an emphasis on discipline and comportment, teacher-led whole-class instruction, and the absence of computer-aided instruction. Merseth’s (2009) detailed ac-
count of the workings of five Boston-area charters, which she calls “high-performing schools,” suggests they share these features.
The first two columns of Table 1 compare some of the statistically measurable differences between Boston charter schools and traditional (BPS) public schools. This table shows student-weighted averages of teacher characteristics and student-teacher ratios by school type. The student-teacher ratio is substantially lower in charter schools, and charter teachers are less likely to be licensed or to be “highly qualified” as defined by NCLB. The latter is likely a consequence of the relative inexperience of many charter school teachers, a fact documented in the age distribution data show in the table.4 As shown in column 7 of Table 1, the features that distinguish the full roster of Boston charter schools are shared by the schools in our lottery sample.
Massachusetts charter schools appear to face more stringent accountability requirements than non-charter public schools. The state Charter School Office reviews and makes recommendations on charter applications, reviews the performance of existing charter schools, and decides whether charters should be renewed. Charter schools are held accountable via annual reports, financial audits, and site visits, and are required to file for renewal every five years. Renewal applications must show that a school’s academic program is successful, that the school is a viable organization, and that it has been faithful to its charter. Since 1994, the state has received a total of 350 charter applications and has granted 76. Eight of the 76 Massachusetts charters ever granted were surrendered or revoked as of Fall 2009 (Massachusetts Department of Elementary and Secondary Education, 2009b). A ninth (Uphams Corner Charter School) was revoked later in 2009.5
In the 2009-2010 school year, 26,384 Massachusetts students attended 62 operating charter schools, including 16 in Boston (Massachusetts Department of Elementary and Secondary Education 2009a).
State law caps the number of charter schools at 72, and total enrollment at 30,034, so the statewide charter cap is not a constraint. However, a provision limiting local charter spending to nine percent of the district total generates binding or near-binding caps in specific districts, including Boston, where charter enrollment is already relatively high. The question of whether this local cap should be lifted is currently the subject of intense debate, fueled in part by the availability of federal stimulus money for states that facilitate new charters (Vaznis 2009).
Pilot schools were developed jointly by BPS and the Boston Teachers Union (BTU) as an alter- native to both charter schools and traditional public schools. Pilot schools are created as the result
4The definition of highly qualified has varied over time, but typically this designation is awarded to teachers who have a bachelor’s degree, full state certification or licensure, and have shown that they know the subject they teach (usually this requires some additional certification). Note that in Table 1, the denominators for the proportion licensed and the proportion highly qualified differ.
5Four of the eight charter losses through Fall 2009 occurred before school operations began. Two of the remaining four were revocations and two were non-renewals.
of a planning process currently funded by the Boston Foundation, a private charity, with technical assistance from the Center for Collaborative Education, a local nonprofit organization that runs the Boston Pilot Schools Network. New schools may be granted pilot status but most are conversions from traditional BPS schools. Pilot school conversions must be authorized by a two-thirds vote of the BTU membership employed at the school and authorized by the BTU Pilot School Steering Committee.6
Like charter schools, pilot schools are answerable to independent governing boards. Also like charters, pilot schools determine their own budgets, staffing, curricula, and scheduling. Unlike charter schools, however, they remain part of the Boston school district and their teachers are BTU members covered by most contract provisions related to pay and seniority. Pilot school teachers have no job protection within schools but remain in the BPS system if they choose to move or are removed by the pilot school principal.
Pilot teachers sign an election-to-work agreement which spells out the extent to which union contract provisions apply. These agreements vary by school.7 Pilot schools are subject to external review, but the review process to date appears to be less extensive and structured than the external state charter reviews. No pilot school has been closed or converted back to a traditional public school.8 Pilot schools are open to all students in the BPS district and operate as part of the district. In the 2007-8 school year, 6,337 BPS students were enrolled in 20 pilot schools. Assignment to all elementary and middle pilot schools, and to two of the seven regular pilot high schools, is through the centralized BPS choice plan, which includes a lottery when schools are over-subscribed.
Pilot teachers have characteristics between those of traditional BPS schools and charter schools, as can be seen in columns 3 and 8 of Table 1. For example, pilot teachers are younger than traditional BPS teachers but not as young as charter teachers. Many pilot schools share with charter schools longer school days and years. But the BTU agreement covering pilot schools limits uncompensated overtime, as do school-specific election-to-work agreements. This is reflected in statistics on hours of instruction that we collected from the schools in our lottery sample. The official BPS school year is 180 days, with a little over six hours of instruction per day, for a total of 1,110 annual school hours.
Annual school hours at pilot middle and high school hours run a little longer, but still under 1,200 hours/year. In contrast, the average charter middle school in our sample provides 1,500 hours of
6The pilot school model originated in Boston but other Massachusetts districts have begun to experiment with it. The Massachusetts Board of Elementary and Secondary Education recently adopted a Commonwealth Pilot School option for schools that otherwise would have been designated as underperforming under NCLB. Five Commonwealth Pilot Schools are now operating in Boston, Fitchburg, and Springfield. Versions of the pilot school model are also being tried in Los Angeles (Manzo, 2007).
7See http://www.ccebos.org/pilotschools/resources/index.html for sample agreements.
8For more on pilot structure, see http://www.ccebos.org/pilotschools/pilot qa.doc and http://www.ccebos.org/pilotguides/. The current BTU contract allows for the creation of up to seven additional pilot schools. In 2007, two pilot conversions were voted down.
instruction, while charter high schools provide about 1,400 hours.9 Related Studies and Questions
A few recent studies use admissions lotteries to measure charter school achievement effects. These include Hoxby and Murarka (2009), which estimates charter effects in New York City (grades 3-8), Hoxby and Rockoff (2005), which estimates the effects of three Chicago charter schools, and Dobbie and Fryer (2009), which evaluates the effects of a charter middle and a charter elementary school located in the Harlem Children’s Zone. All three studies report positive effects, though they vary by grade and subject. The achievement gains reported in Hoxby and Murarka (2009) and Hoxby and Rockoff (2005) are fairly modest, though Hoxby and Rockoff note problems with the Chicago charter lotteries that may invalidate some of their findings. The Dobbie and Fryer (2009) estimates for middle school math scores are the largest of the three, with impacts reaching almost half of a standard deviation per year in charter. Dobbie and Fryer also report IV estimates for an elementary school in the Harlem Children’s Zone based on proximity to the Zone; these are imprecise. Farther afield, Clark (2009) uses a regression-discontinuity design to study the impact of attendance at Britain’s grant-maintained schools, a charter-like model. Grant-maintained schools appear to have produced large achievement gains.10
A related study by Cullen, Jacob, and Levitt (2006) uses admissions lotteries to estimate the effect of attending Chicago magnet schools. Like Boston pilot schools, Chicago magnet schools are part of the local (Chicago Public Schools) district. Chicago magnet schools are also like pilot schools in that they offer special programs and enjoy a degree of autonomy while operating within the Chicago Public School district. Cullen, Jacob and Levitt find no evidence that winning a magnet lottery raises test scores or any other measure of academic performance, though magnet students are less likely to self-report being arrested or involved in disciplinary actions. Using administrative crime records, Deming (2009) similarly finds that adolescents lotteried into their first-choice public school in Charlotte-Mecklenburg are arrested less frequently and spend fewer days incarcerated, though they score no higher on standardized tests.
The question of whether innovations in school organization generate achievement gains is also part of a debate over whether schools alone can address large racial achievement gaps. Positions on this point sometimes translate into views about the social significance of charter schools in the Knowledge
9Data on hours of instruction at charter and pilot schools come from the individual schools’ web sites.
10Charter evaluations that don’t use lotteries have generally produced more mixed results. See, for example, Booker, Sass, Gill, and Zimmer (2008) for Chicago and Florida; Eberts and Hollenbeck (2002) for Michigan; Bifulco and Ladd (2006) for North Carolina; Booker, Gilpatric, Gronberg, and Jansen (2007) for Texas; Berends, Mendiburo, Nicotera (2008) for a Northwest Urban District; and CREDO (2009).
is Power Program (KIPP). The students at KIPP schools are mostly from poor families and 95 percent are Black and Hispanic. Although there are no KIPP schools in our sample, most of the schools for which we have lottery data embrace the No Excuses model and serve a similar low-income, minority population.
The sense in which KIPP constitutes a marker for the role schools can play is clear from influential accounts on either side. In a study of the racial achievement gap, titledNo Excuses, (Thernstrom and Thernstrom (2003, p. 43)) credit KIPP and similar No Excuses programs with impressive gains for low-income students:
Scattered across the American landscape are what some call “break-the-mold” schools high-poverty public schools with students who score well on statewide tests. There aren’t many of them, and all are atypical within their own districts. Nevertheless, their record of success suggests that truly radical education innovation can change the lives of inner-city students, whatever their race or ethnicity.
An alternative view sees schools as only one part–arguably not the most important–in a broad struggle that requires social reform at many levels. Here is Rothstein (2004, p. 83), former New York Times education correspondent and an articulate spokesman for the systemic view:
. . . there is nothing illogical about a belief that schools, if well-operated, can raise lower-class achievement without investing in health, social, early childhood, after-school, and summer programs. But while the belief is not illogical, it is implausible, and the many claims made about instructional heroes or methods that close that gap are, upon examination, unfounded.
Although our limited study cannot be definitive, we see the results as relevant for the evaluation of these opposing points of view.11
III Empirical Framework
We’re interested in the effects of charter or pilot school attendance on student achievement. Because the effects of attendance at different types of school seem likely to be an increasing function of the
11Researchers have also studied the effects of charter schools on traditional public schools. Examples include Bettinger (2005) and Booker, Gilpatric, Gronberg, and Jansen (2007). A related literature looks at the way parents make schooling choices (see, e.g., Hastings, Kane, and Staiger 2008; Hanushek, Kain, Rivkin, and Branch 2007; Jacob and Lefgren 2007).
A few studies investigate general equilibrium effects of school choice on achievement (Hoxby 2000, 2007; Rothstein 2006, 2007).
time spent in school, we model score effects as a function of years in pilot or years in charter. The causal relation of interest is captured using equations like this one for the scores, yigt, of student i testing in year tin grade g:
yigt=αt+βg+X
j
δjdij+γ0Xi+ρSigt+igt. (1) The variableSigtis the years spent in a charter or pilot school as of the test date, counting any repeated grades, and counting time in all charter and pilot schools, not just the ones in our lottery samples.
We also define a year to be a charter or pilot year if any portion of that year is spent in a charter or pilot school. The causal effect of Sigt isρ. The termsαt and βg are year-of-test and grade-of-test effects, while Xi is a vector of demographic controls with coefficient γ, andigt is an error term that reflects random fluctuation in test scores. The dummiesdij are indicators for lottery-specific risk sets (indexed by j), described below.
If Sigt were randomly assigned, ordinary least squares (OLS) estimates of (1) would capture an average causal effect of years spent at a charter or pilot school. Because students and parents selec- tively chose schools, however, OLS estimates may be biased by correlation between school choice and unobserved variables related to ability, motivation, or family background. We therefore use an instru- mental variables (IV) strategy that exploits the partial random assignment of Sigt in school-specific lotteries. Assuming the applicant lotteries are fair, students who win and lose a given lottery should have similar characteristics.
The first stage equations for IV estimation take the form:
Sigt =λt+κg+X
j
µjdij+ Γ0Xi+πZi+ηigt, (2)
where λt and κg are year-of-test and grade effects in the first stage. The first-stage effect is the coefficient, π, on the instrumental variable, Zi. The charter instrument is a dummy for having been offered a seat at one of the schools in the applicants’ charter risk set. The pilot instrument is a dummy for having a BPS lottery number below the highest number offered a spot in the pilot risk set.
For a given charter applicant, the charter risk set is the list of all lotteries to which the student applied in a given year and entry grade, among the lotteries included in our charter lottery sample.
Students who did not apply to any of the charter schools in the lottery sample are not in any charter risk set and are therefore omitted from the IV analysis. The relevant sample of pilot applicants includes only those students who listed a pilot school first on their BPS assignment form (few students who did not do so end up in a pilot school). The pilot risk set is defined by the identity of this first-choice
school and the applicant’s walk-zone status. Charter and pilot risk sets also vary by grade of entry and year of application (the entry cohort).12
IV Data and Descriptive Statistics
The Massachusetts Students Information Management System (SIMS) contains information on all Massachusetts public school students’ race, ethnicity, sex, reduced-price lunch status, special education status, English-language learner status, town of residence and current school. These data are collected in October and again at the end of the school year. We worked with SIMS files for the 2001-2002 through 2006-2007 school years. The SIMS data were used to determine how many years students spent in a charter, pilot or traditional BPS school. A student observed at any time during a school year in a charter or pilot school was classified as a charter or pilot student for that year. To construct an analysis file, we used student identifiers to merge SIMS demographic and school history data with test scores from the Massachusetts Comprehensive Assessment System (MCAS) database, again for the 2001-2002 through 2007-2008 school years. The MCAS database contains raw scores for math, English language arts (ELA), and writing. MCAS is administered each spring, typically in grades 3-8 and 10. For the purposes of our analysis, scores were standardized by subject, grade, and year to have mean zero and unit variance in the population of students attending Boston schools.
Lottery Procedures and Sample Coverage
Each charter school collects applications and holds its own lottery in years the school is over-subscribed.
Siblings of students already attending the school are guaranteed a seat, as are students continuing on from earlier grades. Students can apply to as many charter schools as they like; the lotteries are statistically and administratively independent. Students may therefore be accepted or wait-listed at more than one school. When admitted students decline, slots open up for additional offers farther down the lottery list. Thus, some students may be offered spots immediately, while others may be offered seats closer to the beginning of the school year. Charter school lottery records were matched to MCAS and SIMS data using applicants’ names and year and grade of application.13
12The relevant risk set for students in the pilot lottery is based on the BPS assignment mechanism. Among first-choice applicants to a given pilot school, admission priority is randomly assigned, with lotteries run separately for students who live inside and outside the school’s walk-zone. In the pilot analysis, the risk set is therefore specified as the interaction of the four variables indicating the student’s first-choice pilot school, walk-zone status for that school, and the year and grade of application.
13Gender, race, town of residence, and date of birth were used to resolve ambiguities. We matched 96.5 percent of charter applicants at the middle school level (97.3 percent of those admitted and 94.8 percent of those not admitted) and 92.2 percent of applicants at the high school level (92 percent of those admitted and 92.9 percent of those not admitted).
We asked all operating charter schools in Boston for current and past lottery records. The set of charter schools and applicant years included in the lottery sample is detailed in Table A1. Of the four charter schools with elementary grades, one had lottery records for a period that we could use, but these are for 6th grade entrants and hence contribute to the middle school sample (this school added elementary grades only in 2006). Of the 11 charter schools that enroll middle school students, five contribute to the lottery analysis. Two of the omitted middle schools closed before or while our study was under way (one was under-subscribed), so that charter middle school coverage consists of 5 out of 9 currently operating schools. Two omitted middle schools admit primarily from their own elementary grades. In such cases, we were unable to recover lottery records because the entry date precedes the outcome dates by at least seven years.
Of the eight charter schools that enroll regular (non-alternative) high school students, four con- tribute to the lottery analysis. Two of the omitted high schools closed before or during our study (one was under-subscribed) and two admit students at younger grades and are included in the mid- dle school sample. Our charter high school sample therefore includes all four of Boston’s currently operating regular 9-12 charter high schools.
Students apply to pilot schools as part of the regular BPS assignment mechanism. BPS parents submit a rank order list of at least three schools in January to obtain a seat at a new school in September. At each school, admission priority is determined in part by whether the applicant is a continuing student who is guaranteed admission, currently has a sibling at the school, or lives in the school’s walk zone. Within these priority groups, students are selected using an ordering determined by the BPS lottery number. The choice mechanism tries to assign as many students as possible to their top choice, using coarse priority rankings and lottery numbers when there are more applicants than capacity.14 This produces a system that induces random assignment (albeit with varying probabilities), conditional on priority groups such as sibling and walk-zone status.
Students were classified as pilot applicants if they listed a pilot school as their first choice. Because most pilot schools are oversubscribed, students who rank a pilot school as a second or lower choice are unlikely to be assigned to a pilot. The BPS assignment mechanism runs in multiple rounds but we use information only from the first round. Data on parents’ choices and BPS lottery numbers came from the BPS applications data base. These data were matched to our merged MCAS-SIMS analysis file using state identifiers.
All elementary and middle school pilots use the BPS assignment mechanism and lottery, but only two pilot high schools do. Four others use school-specific admissions criteria, such as musical auditions, to select their students. One is a 6-12 school that was not over-subscribed. Of the seven pilot schools
Additional information related to the construction of analysis files appears in the data appendix.
14For details, see Abdulkadiro˘glu and S¨onmez (2003) and Abdulkadiro˘glu, Pathak, Roth and S¨onmez (2006).
that enroll elementary school students, five were over-subscribed and contribute to the lottery sample.
Of seven pilot middle schools admitting 6th graders, six were over-subscribed and contribute to the lottery sample. Of the four K-8 pilot schools, our lottery middle school sample includes kindergarten applicants from three (the kindergarten entry grade is known as K2, the year after preschool, K1).
One K-8 pilot school opened too late to contribute middle school test scores by K2 applicants.
One of the high schools in our charter lottery sample (Health Careers Academy or HCA) is what is known as a Horace Mann charter school. HCA is the only Horace Mann charter that serves the regular 9-12 population in Boston.15 HCA is unusual in that it began as a pilot school in 1995, but converted to a Horace Mann charter school in 1997.
Like pilot schools, a Horace Mann charter school’s employees are members of the BTU bargaining unit and Horace Mann charters are established with the approval of BPS and the BTU. Otherwise, however, they operate like other charter schools (called Commonwealth charters). In particular, HCA is subject to state (as opposed to district) supervision, and must submit to the same type of five-year review for charter renewal. HCA operates in rented space on the Northeastern University campus, does not use BPS facilities, and is funded like other charter schools.16 The elect-to-work agreements at HCA also appear to allow for more unpaid overtime than those at pilot schools. Because HCA has features in common with pilot schools, however, we look briefly at the implications of a reclassification of HCA as a pilot school in our sensitivity analysis.
Student Characteristics and Covariate Balance
Table 2 reports descriptive statistics for students at Boston’s traditional schools, charter schools, and pilot schools, as well as a separate breakout for those included in the charter and pilot lottery samples.
The racial and ethnic composition of the student bodies attending pilot elementary and middle schools is similar to that at traditional BPS schools: around 45 percent Black and 30 percent Hispanic. In
15The other Boston-area Horace Mann charter school, called Boston Day and Evening Academy, is an alternative school; it serves students aged 16-22 who are overage for grade level or have dropped out.
16The Massachusetts Department of Elementary and Secondary Education describes the two charter models as follows:
A charter school is a public school that is governed by a board of trustees and operates independently of any school committee under a five year charter granted by the Board of Elementary and Secondary Education (Board). It has the freedom to organize around a core mission, curriculum, theme, and/or teaching method and to control its own budget and hire (and fire) teachers and staff. In return for this freedom, a charter school must attract students and produce positive results within five years or its charter will not be renewed. There are two types of charter schools, Commonwealth charter schools and Horace Mann charter schools. They operate under the same set of rules as described above, with the following exceptions. First, a Horace Mann charter school must have its charter approved by the local school committee and the local teacher’s union in addition to the Board. Second, to the extent provided by their charters, Horace Mann charter schools may be exempt from certain provisions in local collective bargaining agreements. Third, employees of a Horace Mann charter school remain members of the local collective bargaining unit; continue to accrue seniority; and receive, at a minimum, the salary and benefits established by the local collective bargaining agreement.
See also http://www.doemass.org/charter/qanda.doc.
contrast, charter schools have a higher proportion of Black students (about 70 percent) and a lower proportion of Hispanic students (about 20 percent). Differences in racial make-up across school types are similar at the high school level.
Roughly 85 percent of students at traditional Boston schools are eligible for free or reduced-price lunch, a measure of poverty status. Charter students are not as poor; about 70 percent fall into this category. The pilot school student body occupies a middle ground, with more poor students than the charter schools but fewer than the traditional schools. Relatively few English learners (also known as limited English proficiency or LEP students) attend charter schools. For example, only seven percent of charter middle schools students are LEP, while the traditional Boston population is 22 percent LEP (pilot schools are close at 21 percent). Charter schools also enroll fewer special education students than traditional schools and pilot schools. Girls are over-represented at charter schools and, to a lesser extent, at pilot schools; this is particularly striking at the high school level, where nearly 60 percent of charter school students are female, compared to 52 percent at the pilot schools and 50 percent at traditional schools. Importantly, however, the demographic make-up of the charter and pilot lottery samples, described in columns 6 and 7 of Table 2, is similar to that of the total charter and pilot samples.
Table 2 also reports pre-treatment test scores - measured in elementary school for the middle school sample and in middle school for the high school sample. We think of these lagged score variables as baseline ability measures. For middle school students, baseline scores come from tests taken in fourth grade while for high school students baseline scores come from tests taken in eighth grade. There are no baseline scores for elementary school students, since MCAS testing starts in third grade. At the middle school level, pilot school students have somewhat lower baseline scores than students at traditional schools, while baseline scores of the charter students are closer to those for students in traditional BPS schools. At the high school level, charter school students have higher baseline scores, averaging about 0.4 standard deviations above those of students in traditional schools and a tenth of a standard deviation above those of students attending pilot schools. Among charter school students applying to lotteried middle schools, there is a baseline advantage of about 0.2 standard deviations.
As a measure of lottery quality, Table 3 reports covariate differences between winners and losers.
The numbers reported in the table are regression-adjusted differences by win/loss status, where a win means students were offered a spot in a charter or pilot school in the relevant risk set. The only covariates in the regression are dummies for risk sets (year of application and the set of schools applied to for charters; first-choice school, year of application, and walk zone status for pilots). Conditional on these covariates, lottery wins should be randomly assigned.
With a few exceptions, the differences in Table 3 are small and statistically insignificant. Among
middle school applicants, charter lottery winners have baseline math scores a tenth of a standard deviation above losers’ scores; at the high school level, winners are two percentage points more likely to be Asian and two percentage points more likely to be English learners. These differences are only marginally significant and could be due to chance. Among elementary pilot schools applicants, lottery winners are eight percentage points less likely to be eligible for a subsidized lunch, while at the high school level, they are six percentage points more likely to be eligible. Again, these and the other scattered marginally significant contrasts in the table seem likely to be chance findings.
This conclusion is reinforced by the F statistics at the bottom of each column, which test the joint hypothesis that all differences in baseline test scores and background characteristics in the column are zero. Only two of these are close to a 0.05 p-value.
V Lottery-Based Estimates
Charter School Effects
Charter middle school applicants who were offered a spot at one of the schools to which they applied spent about a year longer attending a charter school than applicants who were not offered a spot.
This difference, which is shown in column 1 of Table 4 (labeled “first stage”), is measured as of the MCAS test date. The first stage is smaller than the three-year span of middle school because about a fifth of lottery winners never attend a charter school, while some lottery losers end up in charter school later, either because they enter the admissions lottery in a future year, gain sibling preference when a sibling wins the lottery, or move off a wait list after the offers coded by our instrument. In addition, some tests were taken as earlier as one year into middle school (the MCAS tests math and ELA proficiency in every middle school grade).
Middle-school students who win the charter lottery score almost 0.2σ higher on ELA and 0.4σ higher in math, as shown in column 2 of Table 4 (labeled “reduced form”). The 2SLS estimate of the effect of an additional year in a charter school is the ratio of the reduced-form estimates to the first-stage coefficients. Since the first stage coefficients are close to one, the 2SLS estimates (reported in column 3) are similar to the reduced form estimates, though their interpretation differs. When estimated without demographic controls, the 2SLS estimates imply that ELA scores increase by about 0.2σ for each year in a charter, while the per-year math effect is 0.4σ. These estimates are reasonably precise, with standard errors around 0.06−0.08, showing that our research design has the power to detect more modest effects as well. The addition of demographic controls changes this result little, as can be seen in column 4.
Although the reduced form effects on high school ELA and math scores are smaller than the
corresponding reduced form effects in middle school, the high school first stage is also smaller. As a consequence, the ELA and math score gains generated by time spent in charter high schools are estimated to be similar to the corresponding 2SLS estimates for middle school. High school students also take a writing test; here the 2SLS estimates show gains of 0.17σ−0.28σ. As with the results for middle school, the addition of demographic controls leaves the estimates largely unchanged.
Pilot School Effects
Our lottery-based analysis of pilot effects looks at elementary-grade outcomes as well as test scores from middle and high school. The impact of a pilot school offer on time spent in elementary school is almost three years, as can be seen at the top of column 5 in Table 4. The relatively large elementary-level pilot first stage is driven by the fact that elementary school applicants apply to enter in kindergarten, while they are not tested until third or fourth grade. The reduced form effect of a pilot school offer on elementary school applicants is a little under 0.2σ, but this translates into a much smaller per-year effect of 0.06σ−0.07σ, reported in column 7 for models without demographic controls.
The estimated effect of a pilot offer on time spent in high school is similar to the corresponding first stage for charter applicants, while the pilot middle school first stage is somewhat larger. On the other hand, the estimated effects on ELA and math scores–both reduced form and 2SLS–are much smaller (one is negative) and not significantly different from zero. Here too, it’s worth pointing out that the standard errors are of a size that modest effects, say on the order of 0.1σ, would be detectable in middle school, though the high school design has less power. The only significant post-elementary pilot school estimate is for one of the writing scores (This is 0.18σ, a marginally significant result).
Finally, as with the charter lottery results, the estimates using pilot school lotteries are similar with and without demographic controls. The pilot school estimates with demographic controls appear in column 8.
Robustness and Magnitudes
The strong charter school effects on middle school scores reported in Table 4 are readily apparent in a visual representation of IV estimates based on a version of equations (1) and (2). Averaging equation (1) conditional on treatment status and risk set (and dropping covariates), we have
E[yigt|dij = 1, Zi] =αt+βg+δj+ρE[Sigt|dij, Zi] (3)
Differencing (3) by offer status within risk sets, this becomes
E[yigt|dij = 1, Zi= 1]−E[yigt|dij, Zi = 0] =ρ(E[Sigt|dij, Zi= 1]−E[Sigt|dij, Zi= 0]). (4) In other words, the slope of the line linking offer-status differences in test scores within risk sets to the corresponding offer-status differences in average years at a charter or pilot school should be the causal effect of interest, ρ.
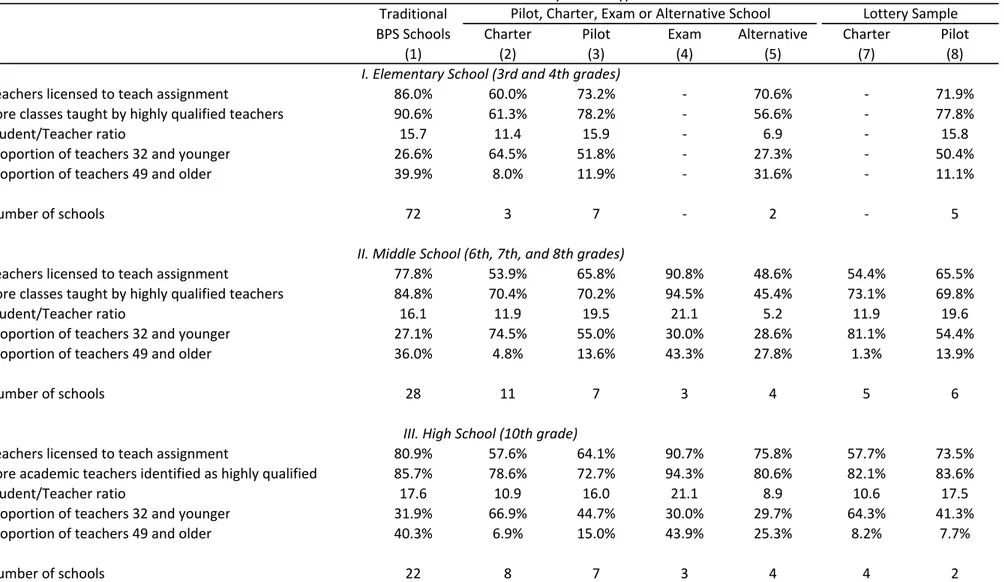
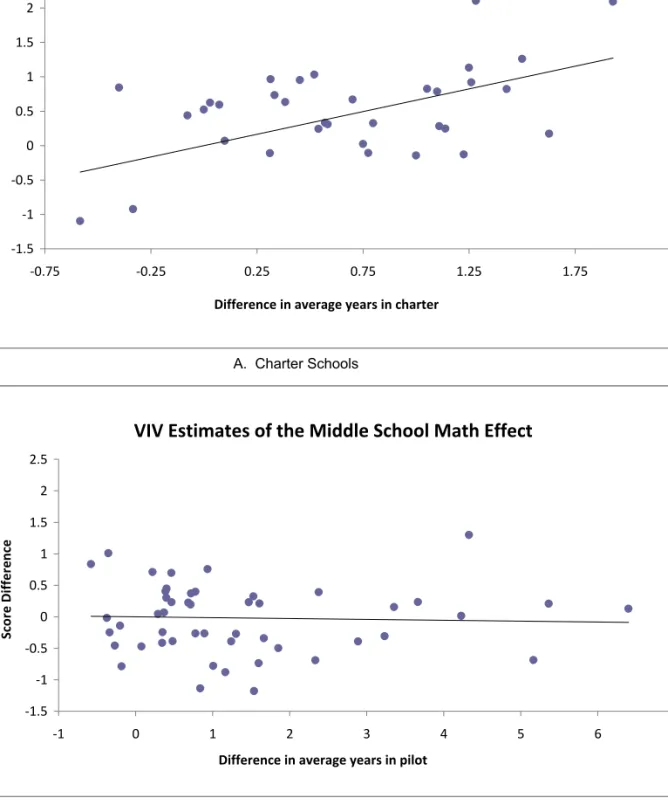
The empirical counterpart of equation (4) for charter applicants’ middle school math scores appears in Panel A of Figure 1. The unit of observation here is a charter risk set. The regression line fits the scatterplot well, with no highly influential or outlying risk sets. The slope of the line in the figure is 0.44 when weighted by the size of risk sets. The corresponding 2SLS estimate ofρ using a full set of offer ×risk set dummies as instruments in a model without out covariates is identical.17 In contrast, the analogous plot for pilot schools, plotted in Panel B, shows a flatter line, with a slope of −0.045.
The pilot x-axis has a wider range than that for charters because some of the pilot risk sets are small, and because applicants to pilot K-8 schools may spend a longer time in a pilot school than applicants to grade 6-8 schools. But omitting the small risk sets and outlying first stage values leaves the weak negative relation captured in the figure essentially unchanged.
Most of the lottery results shown in Table 4 are insensitive to the inclusion of controls for applicants’
baseline test scores. This is documented in Table 5, which reports results with additional controls and alternative samples. For reference, Table 5 also repeats the 2SLS estimates with demographic controls from Table 4 (these regressions also include dummies for year of test, year of birth, and risk sets). Baseline test scores are available for students who have taken the MCAS before applying to the lottery; the sample used to construct pilot lottery estimates with baseline score controls therefore omits elementary school students and K2 applicants to pilot K-8 middle schools.
The addition of baseline score controls has almost no effect on the charter lottery estimates, a result documented in column 2 of Table 5. On the other hand, the pilot lottery estimates for middle school math scores turn negative and at least marginally significant with baseline score controls, as can be seen in column 6. There is little relation between the pilot lottery instruments and baseline scores, so this change in middle school math estimates cannot be attributed to omitted variables bias.
Rather, it stems from the loss of K-8 pilot schools in the lagged-score sample. We confirmed this by estimating middle school pilot effects with demographic controls in a sample that includes grade
17The sample analog of equation (4) can be thought of as a strategy that combines Wald estimates based onZiacross risk sets. Generalized Least Squares (GLS) estimation of the sample analog of equation (3) can be show to be the same as 2SLS using a full set of offer×risk set dummies as instruments (Angrist, 1991). Size-weighted least squares estimation of (4) is not algebraically the same as this 2SLS estimator, but should be close (and is indistinguishable from 2SLS in Panel A of the figure).
6-to-8 middle schools only. These results, reported in column 7 of Table 5, show estimates similar to those with lagged score controls. The complementary sample that includes only K-8 schools generates small positive effects (not reported in the table. Thus, there is considerable heterogeneity in the pilot middle school math effects: grade 6-to-8 schools appear to be weaker than K-8 schools, at least as measured by their impact on MCAS math scores. It should also be noted, however, that the omission of K2 applicants to K-8 schools leads to a large drop in precision.
The results of adding an additional instrument to the charter lottery analysis are reported in column 3. The maintained instrument is a dummy for having been offered a charter seat any time after the relevant lottery, including off the waiting list (“eventual offer”), while the additional instrument is a dummy for having received an “initial offer” – that is, an offer of a seat in a charter school made immediately after the lottery was held.18 The multi-instrument models are over-identified so we can expect the resulting IV estimates to be more precise. In addition, the comparison of one- and two- instrument estimates provides an over-identification test for the underlying exclusion restrictions. In practice, the two-instrument results are close to those using a single instrument, while precision gains are modest at best.
The final alternative specification reported in Table 5 is motivated by the unusual history of Health Careers Academy (HCA), a Horace Mann charter high school. As noted in the background section, HCA was born as a pilot school in 1995 but converted to a Horace Mann charter school in 1997. Horace Mann charter schools are like other charter schools in most respects, but their employees remain part of the BTU bargaining unit. For the reasons detailed in our earlier discussion, we believe HCA should be a seen as a charter school, albeit with union staff. Nevertheless, as a robustness check, we explored the implications of moving HCA from the charter to the pilot ledger.19
Reclassification of HCA as a pilot school has a modest effect on the charter lottery estimates: The estimated impact on high school math increases from 0.23σ to 0.3σ while the ELA effect falls from 0.19σ to 0.11σ, as shown in column 4 of Table 5. The latter estimate is no longer significantly different from zero, but this is due more to a drop in precision than to the changed estimate (reclassification of HCA shifts 300 observations). The charter writing impacts also change little. Addition of HCA to the sample of pilot high schools produces a marginally significant ELA effect of about 0.11σ and an insignificant math effect of 0.09σ (HCA becomes the third pilot high school in this case). The effects of pilot high school attendance on writing increase and are more precisely estimated with HCA included. The increase in ELA and math estimates when HCA is treated as a pilot school suggests
18The initial offer instrument can be constructed only for some schools; see appendix Table A1 for details.
19Like other charter schools, HCA uses a stand-alone lottery while pilot schools are part of the Boston assignment mechanism. When HCA is introduced into the sample of pilot high schools, we define risk sets according to whether applicants picked one of the other two pilot high schools as a first choice, picked HCA as a first choice, or applied to HCA with one or the other of the other two schools as a first choice in the BPS mechanism.
that HCA may be stronger than the two pilot high schools that are otherwise in our lottery sample.
On the other hand, the changes observed in this context are modest enough to be chance fluctuations.
A natural benchmark for the size of estimates reported here is the black-white test score gap.
Among students attending regular BPS middle schools, blacks score about 0.7σ below whites on ELA and 0.8σ below whites in math. The charter middle school effects of 0.15σ on middle school ELA scores is therefore enough to essentially close two-thirds of the black-white reading gap for students who remain enrolled in a charter middle school in grades 6-8. The even larger math gains of about 0.4σ are more than enough to eliminate the racial gap in mathematics achievement while students are in middle school. The effects of roughly 0.2σ estimated for high school ELA and math are also large enough to close the black-white high school gap of about 0.8σ in both subjects (assuming four years of charter high school enrollment). Of course, these are extrapolations based on our per-year average effects and not direct estimates. In practice, we should expect some reduction in the returns to charter attendance over a long enough period. Moreover, these calculations assume that the effects reported in Table 4 apply equally to blacks and whites. On the other hand, separate estimation by race (not reported here in detail) suggests that this is indeed the case.
Selective Attrition
Tables 4 and 5 were constructed from samples of students who participate in charter school and pilot school lotteries and for whom we have post-lottery test scores. Lottery winners and losers should be similar at the time the lotteries are held, since a coin flip is all that distinguishes them. Subsequent attrition may lead to differences in the follow-up sample, however, unless the attrition process itself is also random. In other words, we worry about differential and selective attrition by win/loss status. For example, losers may be less likely to be found than winners, since students who lose the opportunity to attend a charter or pilot school may be more likely to leave the public schools altogether. Differential attrition generates selection bias (although those who leave Boston for another Massachusetts public school district should turn up in our sample). A simple test for selection bias looks at the impact of lottery offers on the probability lottery participants contribute MCAS scores to our analysis sample.
If differences in follow-up rates are small, selection bias from differential attrition is also likely to be modest.20
Table 6 reports the mean follow-up rate for lottery participants in columns 1 and 4, and win-loss differentials in columns 2-3 and 5-6. Roughly 80 percent of charter lottery losers and about 70 percent of pilot lottery losers contribute a post-randomization test score. These high follow-up rates are due to
20More formally, if attrition can be described by a latent-index model of the sort commonly used to model discrete choice in econometrics, then selection bias in lottery comparisons arises only if winning the lottery affects the probability of MCAS participation. See, e.g., Angrist (1997).
the fact that our extract is limited to those enrolled in BPS at baseline and to our use of a statewide MCAS data set. Follow-up differentials by win/loss status were estimated using regression models that parallel the reduced forms reported in Table 4. Positive coefficients indicate that lottery winners are more likely to contribute an MCAS score.
The estimated follow-up differentials for charter high school applicants are small and not signifi- cantly different from zero. For example, high school charter lottery winners are about 3 percentage points more likely to contribute an ELA score than losers (when the differential is estimated with de- mographic controls; see column 2). The follow-up differentials for charter middle school outcomes are a little larger, on the order of 4-5 percentage points. Although these small differences are marginally significant, they seem unlikely to impart substantial selection bias.
There are virtually no attrition differentials for pilot middle schools. The largest differentials turn up for participants in pilot high school lotteries, as can be seen in columns 5 and 6 of Table 6. For example, controlling for demographic characteristics, high school winners are roughly 5 percentage points more likely to have taken the ELA test than losers, a significant effect with an estimated standard error of 2.6. But this too seems unlikely to explain our results, which show no effect on pilot lottery winners in high school. First, the most likely scenario for selective attrition has relatively high achieving losers dropping out. Second, the attrition differentials in this case are still fairly small.
Nevertheless, as a check on the main findings, we discarded a few of the most imbalanced cohorts to construct a sample of charter middle school and pilot high school applicants with close-to-balanced attrition. We then re-estimated treatment effects using this balanced sample. Attrition differentials for balanced cohorts are reported in Appendix Table A3, while the corresponding lottery-based estimates of treatment effects are reported in A4. These results are similar to those reported in Table 4.
VI The Anatomy of Charter and Pilot Treatment Effects
Charter and Pilot Compliers
Our lottery-based research design uses random assignment to construct causal effects for the subpop- ulation that spends time in a charter or pilot school as a consequence of winning a lottery. What sort of schools do these students go to? Do the losers in this group remain in schools that look like the BPS average? Or, are the schools they come from unusual in some way? We’re also interested in whether winning lottery participants end up in schools with a different socioeconomic and ability mix or go to schools with smaller classes. We address this set of questions using a causal IV framework to describe the school characteristics experienced by lottery applicants in alternative states of the world.
We begin by defining the causal relationship of interest to be the link between characteristics of
schools and classmates and charter or pilot attendance. Let the attendance variable beDifor applicant i, where this is recorded in the year immediately after application to schools in the relevant risk set.
LetXi be a characteristic of these schools, such as the fraction nonwhite or class size. To capture the fact thatDi affects school choice and therefore changes the characteristics of the school that applicant iattends, we write
Xi=X0i(1−Di) +X1iDi,
where X0i and X1i are the potential school characteristics that applicant i would be exposed to if he or she attends a regular school or a charter or pilot school. The causal effect of charter or pilot attendance on iis the difference in potential characteristics by school type,X1i−X0i.
Charter and pilot lottery compliers are applicants who would attend a charter or pilot school in the year after application if they win the lottery, but not otherwise. To describe this group formally, we write
Di =D0i(1−Zi) +D1iZi,
whereD0i andD1iarepotential assignments that tell us the type of school applicantiwould attend if he or she wins or loses (as before, the instrument isZi, a dummy indicating lottery winners). Following Imbens and Angrist (1994), we impose monotonicity:
D1i≥D0i.
In other words, winning the lottery can only make charter or pilot attendance more likely. Given this restriction, D1i−D0i is equal to zero or one.
In the causal IV framework developed by Angrist, Imbens, and Rubin (1996), the set of charter or lottery compliers consists of applicants with D1i −D0i = 1. This happens when D0i = 0 and D1i = 1. Compliers are those who do not attend a charter or pilot school if they lose the lottery but do attend if they win. The rest of the population has D1i−D0i = 0, because either D1i =D0i = 1 (indicating applicants who attend whether they win or not, the always-takers) or D1i = D0i = 0 (indicating applicants who do not attend whether they win or not, the never-takers). Always-takers’
and never-takers’ are unaffected by the lottery, so IV estimates using lottery instruments do not reflect the impact of charter or pilot attendance on these two groups. Replacing years-in-charter or pilot with a dummy for charter or pilot attendance, and usingY1i andY0ito denote potential test score outcomes, IV identifies the average causal effect on compliers,
E[Y1i−Y0i|D1i ≥D0i].
This is the local average treatment effect (LATE) captured by lottery instruments.21
Here we are interested in the school environment or school characteristics rather than test scores.
Moreover, we focus on the average type of schools attended by compliers in alternative states if the world rather than the treatment effect on school type. In other words, the parameters of interest are
α1c≡E[X1i|D1i ≥D0i] α0c≡E[X0i|D1i ≥D0i].
We think of α0c as the fallback position for compliers unable to attend the type of school to which they applied (because they lost the lottery); α1c describes the schools attended by compliers whose lottery applications were successful. Abadie (2002) shows that these marginal means can be estimated by using Zi as instrument for the following second-stage equations (ignoring covariates):
DiXi =λ1c+α1cDi+ξ1i (5) (1−Di)Xi =λ0c+α0c(1−Di) +ξ0i, (6) where λ1cand λ0c are terms that incorporate controls – in this case dummies for risk sets.22
Compliers who lose the lottery end up in schools with a demographic mix similar to the system- wide BPS average. This can be seen in columns 1 and 5 of Table 7 for charter applicants and columns 3 and 7 for pilot applicants. For example, the average proportion black in BPS middle schools is 47 percent (a statistic from Table 2). Non-treated charter compliers attend middle schools that are also 47 percent Black while non-treated pilot compliers attend middle schools that are 46 percent Black.
Likewise, the average proportion Black in BPS high schools is 0.51, while non-treated compliers attend high schools that are 55 percent Black.
In some respects, the complier fallback position is somewhat better than the BPS average. This suggests that charter treatment effects cannot be explained by arguing that the regular BPS schools they would otherwise attend have unusually low-achieving peers. At losers’ middle schools, for ex- ample, the mean baseline scores of peers are positive while the overall BPS average is negative. In high school, peer means for losers are higher than the BPS average for math though about the same for ELA scores. Socioeconomic status as measured by the proportion getting a free or reduced price
21LATE can be generalized to covered ordered treatments such as years in charter or pilot, and models with covariates;
see Angrist and Pischke (2009) for details.
22Abadie (2002) uses equations like (5) and (6) to estimate the marginal distribution of potential outcomes for com- pliers, but his approach works for characteristics as well. Because we use a saturated model for controls (risk sets), 2SLS estimates ofα1candα0c are the same as those that would be generated using Abadie’s (2003) kappa-weighting scheme to estimate compliers’ marginal means.