Schriften aus der Fakultät Wirtschaftsinformatik und
Angewandte Informatik der Otto-Friedrich-Universität Bamberg
38
Stefan Kufer
Effective and Efficient Summarization of Two-Dimensional Point Data
Approaches for Resource Description and Selection in
Spatial Application Scenarios
Schriften aus der Fakultät Wirtschaftsinformatik und Angewandte Informatik der Otto-Friedrich- Universität Bamberg
38
Contributions of the Faculty Information Systems and Applied Computer Sciences of the
Otto-Friedrich-University Bamberg
Schriften aus der Fakultät Wirtschaftsinformatik und Angewandte Informatik der Otto-Friedrich- Universität Bamberg
Band 38
2019
Contributions of the Faculty Information Systems and Applied Computer Sciences of the
Otto-Friedrich-University Bamberg
Stefan Kufer
2019
Effective and Efficient Summarization of Two-Dimensional Point Data
Approaches for Resource Description and Selection in
Spatial Application Scenarios
Dieses Werk ist als freie Onlineversion über den Publikationsserver (OPUS; http://www.
opus-bayern.de/uni-bamberg/) der Universität Bamberg erreichbar. Das Werk – ausge- nommen Cover, Zitate und Abbildungen – steht unter der CC-Lizenz CC-BY.
Lizenzvertrag: Creative Commons Namensnennung 4.0 http://creativecommons.org/licenses/by/4.0
Herstellung und Druck: docupoint, Magdeburg Umschlaggestaltung: University of Bamberg Press
© University of Bamberg Press, Bamberg 2019 http://www.uni-bamberg.de/ubp/
ISSN: 1867-7401
ISBN: 978-3-86309-672-4 (Druckausgabe) eISBN: 978-3-86309-673-1 (Online-Ausgabe) URN: urn:nbn:de:bvb:473-opus4-551376 DOI: http://dx.doi.org/10.20378/irbo-55137
Bibliographische Information der Deutschen Nationalbibliothek
Die Deutsche Nationalbibliothek verzeichnet diese Publikation in der Deutschen Nationalbibliographie; detaillierte bibliographische Informationen sind im Internet über http://dnb.d-nb.de/ abrufbar.
Diese Arbeit hat der Fakultät Wirtschaftsinformatik und Angewandte Informatik der Otto-Fried- rich-Universität Bamberg unter dem Titel „Effective and Efficient Summarization of Two-Dimensi- onal Point Data for Resource Description and Selection in Spatial Application Scenarios“ als Disser- tation vorgelegen.
1. Gutachter: Prof. Dr. Andreas Henrich 2. Gutachter: Prof. Dr. Christoph Schlieder Tag der mündlichen Prüfung: 20.05.2019
Acknowledgements
First and foremost, I particularly thank my supervisor Prof. Dr. Andreas Henrich for giving me the chance to pursue my doctoral adventure. His support, inspiration, and the always open door have contributed a great deal to the success of this undertaking as well as helped me to find the way whenever I needed guidance. I additionally want to thank Prof. Dr. Daniela Nicklas and the second assessor of my thesis, Prof. Dr. Christoph Schlieder, for being part of the thesis committee. The cooperation has always been very pleasant.
Further thanks go to all my colleagues I have worked with at Media In- formatics Group—Sebastian Boosz, Martin Bullin, Tobias Fries, Andrea Garzarella, Tobias Gradl, Adrian Hub, Jasmin Mikolay, Hans-Christian Sperker, and Michael S ¨unkel—as well as the administrative staff Siegfried Hofmann and Daniela Pielenhofer: Thank you so much for creating the very enjoyable atmosphere at the chair and the countless hours of laugh- ter and mischief.
Another big thank you to all the student tutors who greatly supported me in my teaching activities, some of them for several years: Han- nah Deininger, Matthias Delfs, Florian Fehrenbacher, Tobias Heckel, Michael Herold, Christos Ioannidis, Leon Martin, Johannes Rabold, Sascha Riechel, Madeleine Rosenhagen, Stefan Schedel, and Oliver Siegl.
I owe special gratitude to Peter Garzarella and Dr. Stefan Kolb for proof- reading the thesis and their multitude of helpful comments and sugges- tions, and in particular to my third proofreader Dr. Daniel Blank who in addition provided support and great advice on so many occasions during our time together at the chair. Many thanks also to Felix Engl for his imple- mentation of the R-tree and the excellent cooperation during our mutual research on that topic. Furthermore, I am very grateful to Florence Rat, Dr. Martin Sticht, and Petr Vasilyev for their time and feedback on the trial sessions for the disputation presentation.
Last but not least, I thank my friends and my family for the never-ending support during this long journey.
Kurzfassung
Raum ist ¨uberall, und das gilt auch f ¨ur r ¨aumliche Daten. Die digitale Rev- olution hat zu einem enormen Bestand an r ¨aumlichen Daten gef ¨uhrt, und die Menge der neu erzeugten r ¨aumlichen Daten nimmt von Tag zu Tag zu. H ¨aufig handelt es sich bei diesen r ¨aumlichen Daten um zweidimen- sionale Punktdaten, die zus ¨atzlich mit Datenobjekten wie z.B. Medienob- jekten (etwa Bildern oder Texten) verkn ¨upft sind. Aufgrund der großen Menge an Datenobjekten, die erzeugt werden und anschließend zu verwal- ten sind, besteht ein Bedarf an effektiven und effizienten Suchsystemen, die in der Lage sind, die r ¨aumlichen Eigenschaften dieser Datenobjekte zu adressieren. In diesem Zusammenhang sind verschiedene Suchszenar- ien vorstellbar: Die Datenobjekte k ¨onnen in einem verteilten System (d.h.
auf einer Reihe von verschiedenen Maschinen) oder in einem zentral- isierten System (d.h. auf einer einzelnen Maschine) verwaltet werden, was in beiden F ¨allen zu unterschiedlichen Anforderungen an die entsprechen- den Suchsysteme f ¨uhrt. Jedoch ist in beiden Szenarien das Konzept der Ressourcenbeschreibung und -auswahl ein anwendbares Paradigma f ¨ur Ahnlichkeitssuchen, die in Bezug auf die r ¨¨ aumlichen Eigenschaften der Datenobjekte durchgef ¨uhrt werden. Wenn man sich auf den r ¨aumlichen Aspekt konzentriert, ist eine Ressource dabei eine abstrakte Entit ¨at, die eine Menge r ¨aumlicher Punktdaten verwaltet. Zur Beschreibung des r ¨aumlichen Fußabdrucks einer Ressource k ¨onnen die von ihr verwalteten Punktdaten mittels geometrisch abgegrenzter Fl ¨achen, die die Punkt- menge der Ressource r ¨aumlich ¨uberdecken,
”zusammengefasst“ werden.
Diese Ressourcenbeschreibungen k ¨onnen dann f ¨ur eine gezielte Auswahl der Ressourcen, welche die in Hinblick auf r ¨aumliche Eigenschaften rele- vanten Datenobjekte verwalten, verwendet werden.
Die vorliegende Arbeit besch ¨aftigt sich mit der effektiven und effizien- ten Zusammenfassung von Mengen zweidimensionaler, r ¨aumlicher Punk- tdaten zum Zwecke der Ressourcenbeschreibung und -auswahl in ver- schiedenen
”r ¨aumlichen“ Anwendungsszenarien. Der Begriff
”effektiv“
bezieht sich auf eine r ¨aumlich sehr genaue geometrische Abgrenzung der zu beschreibenden Datenpunktmengen, wohingegen der Begriff
”ef- fizient“ sich auf ihre speicherplatzsparende Repr ¨asentation bezieht. In der vorliegenden Arbeit werden zwei suchbasierte
”r ¨aumliche“ Anwen- dungsszenarien untersucht, und in beiden kann die Suchaufgabe ¨uber das Konzept der Ressourcenbeschreibung und -auswahl modelliert werden.
Das erste Szenario ist ein verteiltes Anwendungsszenario, bei dem Men- gen r ¨aumlicher Punktdaten von einer Reihe unabh ¨angiger Ressourcen wie Peers in einem Peer-to-Peer-Netzwerk verwaltet werden. Die Ressourcenbeschreibungen sollen eine gezielte Auswahl der Peers, die die f ¨ur eine konkrete Anfrage relevanten Datenpunkte verwalten, erm ¨oglichen. Gleichzeitig sollen
”irrelevante“ Ressourcen bei der Anfrage-
IV
bearbeitung m ¨oglichst nicht kontaktiert werden. Das verteilte Anwen- dungsszenario ist der Hauptteil dieser Arbeit, und unsere Zusammenfas- sungsans ¨atze sind speziell f ¨ur diesen Zweck entwickelt worden. F ¨ur diese Ans ¨atze wird eine Vielzahl von Konzepten betrachtet, die die Kompres- sion der Datenpunkte, die Verwendung beliebig komplexer H ¨ullk ¨orper, die Repr ¨asentation komplexer Objekte (z.B. komplexer H ¨ullk ¨orper) ¨uber eine Menge einfacherer Objekte sowie eine Aufteilung der zu beschreibenden Datenpunktmenge in Gruppen und die anschließende pr ¨azise Abgrenzung jeder einzelnen Gruppe beinhalten. Insgesamt werden in dieser Arbeit 14 Zusammenfassungsans ¨atze vorgestellt, die in die Kategorien Daten- partitionierungsans ¨atze (data partitioning approaches), Raumpartition- ierungsans ¨atze (space partitioning approaches) und hybride Ans ¨atze (hy- brid approaches) unterteilt werden k ¨onnen. Im Anschluss an die Spezi- fikation geeigneter Ressourcenauswahltechniken, die auf den verschiede- nen Zusammenfassungen aufbauen, wird eine umfassende Evaluation der Zusammenfassungsans ¨atze auf Basis von
k
-N ¨achste-Nachbarn-Anfragen (k
NN-Anfragen) durchgef ¨uhrt. Die Evaluation ber ¨ucksichtigt dabei ver- schiedene Datenkollektionen und unterschiedliche Rahmenbedingungen, um die Robustheit der verschiedenen Ans ¨atze zu untersuchen.Im zweiten Anwendungsszenario wird eine Nutzung unserer Zusam- menfassungsans ¨atze in einer multidimensionalen Datenstruktur unter- sucht, was ein zentralisiertes Anwendungsszenario darstellt. Konkret wer- den die beiden f ¨ur diesen Zweck am besten geeigneten Zusammenfas- sungsans ¨atze aus dem verteilten Anwendungsszenario in einen R-Baum integriert, welcher Mengen zweidimensionaler Punktdaten verwaltet. Der R-Baum ist eine baumbasierte, zentralisierte multidimensionale Daten- struktur, die von 1984 an ¨uber viele Jahre intensiv erforscht wurde. Die
”Ressourcen“ innerhalb eines R-Baums sind die Knoten der hierarchis- chen Baumstruktur. Die Ressourcenbeschreibungen sollen das gezielte Traversieren von Pfaden der Baumstruktur bei der Suche nach den f ¨ur eine gegebene Anfrage relevanten Datenpunkten erm ¨oglichen. Tradi- tionell werden diese Knoten durch Minimum Bounding Rectangles (MBRs) beschrieben, die sehr speicherplatzeffizient sind, aber eher grobe Beschrei- bungen des r ¨aumlichen Fußabdrucks darstellen. Nach einer Pr ¨asentation des klassischen R-Baums werden in der Arbeit die notwendigen Modi- fikationen am R-Baum, welche zur Integration unserer Zusammenfas- sungsans ¨atze notwendig sind, diskutiert. Außerdem werden geeignete Al- gorithmen zur Berechnung von Zusammenfassungen f ¨ur eine gegebene Menge von Rechtecken entwickelt, da dies eine Voraussetzung f ¨ur den effizienten Einsatz unserer komplexen Zusammenfassungsans ¨atze in R- B ¨aumen ist. Im Anschluss an die Spezifikation geeigneter Algorithmen f ¨ur Bereichs- und
k
NN-Anfragen wird eine umfangreiche Evaluation durchgef ¨uhrt, die sowohl das Verbesserungspotenzial gegen ¨uber dem”tra- ditionellen“ R-Baum (der MBR-Zusammenfassungen verwendet) als auch den Zielerreichungsgrad unter Verwendung des geradlinigen Integra-
tionsansatzes, den wir verfolgen, bewertet. Auch in dieser Evaluation wer- den verschiedene Datenkollektionen und unterschiedliche Rahmenbedin- gungen ber ¨ucksichtigt.
Insgesamt pr ¨asentiert die Arbeit eine Vielzahl von Zusammenfas- sungsans ¨atzen f ¨ur die Beschreibung von Mengen zweidimensionaler Punktdaten. Diese Zusammenfassungsans ¨atze eignen sich hervorragend f ¨ur den Einsatz innerhalb des untersuchten verteilten Anwendungsszenar- ios. Dar ¨uber hinaus untersuchen wir einen Einsatz der beiden am besten daf ¨ur geeigneten Zusammenfassungsans ¨atze in einem sehr inten- siv erforschten zentralisierten Anwendungsszenario. Hierbei legen wir Verbesserungspotenziale dar und identifizieren wichtige Hindernisse, die es f ¨ur unsere Zusammenfassungsans ¨atze innerhalb eines solchen Um- feldes zu ¨uberwinden gilt.
Abstract
Space is everywhere, and so is spatial data. The digital revolution has led to an enormous pool of available spatial data, and the amount of newly generated spatial data is increasing day by day. Often, this spatial data is two-dimensional point data that in addition is associated with data objects such as media objects (e.g. pictures or texts). As a consequence of the huge amount of data objects which is generated and then has to be maintained, there is a need for effective and efficient search systems which are capa- ble of addressing the spatial properties of the data objects. In this context, different search scenarios exist: The data objects might be maintained in a distributed system (i.e. on a set of different machines) or in a central- ized system (i.e. on a single machine) which, in each case, leads to varying requirements for appropriate search systems. However, in both scenarios, the concept of resource description and selection is an applicable paradigm for conducting similarity searches with regard to the spatial properties of the data objects. Hereby, when focusing on the spatial aspects, a resource is an abstract entity that administers spatial point data. For describing the spatial footprint of a resource, its spatial data point set can be ‘sum- marized’ by means of geometrically delineated areas which cover this data point set. These resource descriptions are then usable for a targeted selec- tion of the resources which administer the relevant data objects based on spatial properties.
This thesis is concerned with the effective and efficient summarization of two-dimensional spatial point data as a means for resource description and selection in spatial application scenarios. The term ‘effective’ refers to a spatially very accurate geometric delineation of the data point set to de- scribe whereas the term ‘efficient’ relates to its storage-space-efficient rep- resentation. Two search-based spatial application scenarios are assessed in this thesis, and in both, the search task can be modelled by adhering to the concept of resource description and selection.
The first scenario is a distributed application scenario in which spatial point data is maintained by a set of independent resources such as peers in a peer-to-peer network. Given a concrete query, the resource descrip- tions shall enable the targeted selection of the peers administering the relevant data points while ignoring ‘irrelevant’ resources. The distributed application scenario is the main part of this thesis, and our summariza- tion approaches are specifically developed for this purpose. Hereby, a va- riety of concepts is considered which include the compression of the data points, the use of arbitrarily complex bounding volumes to delineate them, the representation of complex objects (such as complex bounding volumes) with a set of simple objects, and a division of the data point set to describe into groups and the subsequent concise delineation of each group. Over- all, 14 summarization approaches are presented in this thesis which can
VIII
be categorized into data partitioning approaches, space partitioning ap- proaches, and hybrid approaches. Following the specification of suitable resource selection schemes which are based on the various summaries, an extensive evaluation is conducted by means of assessing the approaches’
performances for
k
nearest neighbor (k
NN) queries. The evaluation con- siders different data collections and varying environmental conditions in order to assess the robustness of the approaches.In the second application scenario, a utilization of our summarization ap- proaches in a multidimensional data structure is assessed—which consti- tutes a centralized application scenario. More specifically, the two sum- marization approaches of the distributed application scenario which are most suitable for this purpose are integrated into an R-tree which admin- isters sets of two-dimensional point data. The R-tree is a tree-based, cen- tralized multidimensional data structure which has been the subject of in- tensive research over many years, starting in 1984. Within an R-tree, the
‘resources’ are the nodes of the hierarchical tree structure. The resource descriptions shall enable the targeted traversal of paths in the tree struc- ture when searching for the relevant data points given a specific query.
Traditionally, these nodes are described by Minimum Bounding Rectan- gles (MBRs) which are very storage-space-efficient but rather coarse de- scriptions of a spatial footprint. After presenting the classical R-tree, the modifications to the R-tree that are necessary to integrate our summariza- tion approaches are discussed. Also, appropriate algorithms for calculating summaries from a set of rectangles are outlined as this is a prerequisite for the efficient use of our sophisticated summarization approaches in R-trees.
Following the specification of appropriate range query and
k
NN query al- gorithms, an extensive evaluation is conducted which assesses both the improvement potential over the traditional R-tree using MBR summaries as well as the degree of achievement by means of the straightforward ap- proach to the integration that we pursue. Also in this evaluation, different data collections and varying environmental conditions are considered.Overall, the thesis presents a wide variety of summarization approaches for describing sets of two-dimensional point data. These summarization approaches are excellently suited for usage in the investigated distributed application scenario. Furthermore, we assess the utilization of the two summarization approaches which are most appropriate for this purpose in an already very intensively researched centralized application scenario.
Here, we examine further improvement potentials and identify important obstacles which are to overcome for our summarization approaches in such an environment.
Glossary XIII
Part I: Background and Problem Description 1
1 Introduction 3
1.1 Motivation . . . 3
1.2 Investigated Application Scenarios . . . 7
1.2.1 Distributed Application Scenario . . . 8
1.2.2 Centralized Application Scenario . . . 9
1.3 Problem Description . . . 11
1.4 Thesis Objectives . . . 13
1.5 Thesis Outline . . . 14
2 Related Work 19 2.1 Compressing Data . . . 21
2.1.1 Bit Vector Compression Schemes . . . 21
2.1.2 Floating-Point Data Compression Schemes . . . 23
2.2 Approximating a Point Set with Bounding Volumes . . . 24
2.3 Representing a Complex Object with a Set of Simpler Objects 26 2.3.1 Polygon Decomposition Problem . . . 27
2.3.2 Polygon Cover Problem . . . 28
2.3.3 Binary Image Compression . . . 29
2.4 Dividing a Set of Points into Groups and Representing Each Group by a Separate Area . . . 30
2.4.1 Clustering . . . 33
2.4.2 Computational Geometry . . . 34
2.4.3 Multidimensional Data Structures . . . 35
2.5 Querying for Spatial Data . . . 49
2.6 Further Related Work . . . 52
2.6.1 Linear Quadtree Encodings . . . 53
2.6.2 P2P Multidimensional Indexing Methods and P2P Overlay Networks . . . 54
2.6.3 Metric Access Methods . . . 55
2.6.4 Ptolemaic Access Methods . . . 58
Part II: Distributed Application Scenario 59 3 Preliminaries for the Distributed Application Scenario 61 3.1 General Preliminaries . . . 61
3.2 Quadtree-Related Preliminaries . . . 62
3.3 Excursus: Dealing with Spatial Errors . . . 66
X Contents
4 Summarization Approaches for Spatial Data Point Sets 71
4.1 Data Partitioning Approaches . . . 72
4.2 Space Partitioning Approaches . . . 75
4.3 Hybrid Approaches . . . 82
5 Resource Selection 99 5.1 Conceptual Resource Ranking Algorithms . . . 100
5.2 A Conceptual
k
NN Algorithm . . . 1046 General Evaluation Environment 109 6.1 Assessment of the Results . . . 109
6.2 Data Collections . . . 111
6.3 Experimental Setup . . . 114
6.4 Adjustments for Simulating a ‘Real-World-System’ . . . 117
6.4.1 Adjustments Concerning the Resource Description Data (and their Consequences) . . . 118
6.4.2 Reducing the Initial Query Radius . . . 123
6.4.3 Selection of the Sites and the Training Data . . . 124
7 Experimental Results—Analysis of the
T1
Collection 127 7.1 General Overview of the Results . . . 1277.1.1 Analysis of the Skylines . . . 128
7.1.2 Analysis of the Key Figures for the Skyline Parame- terizations . . . 131
7.1.3 Comparison of the Approaches at ‘MBRsize’ . . . 144
7.2 Results for the MBR-based Approaches . . . 148
7.3 Results for the k-d-based Approaches . . . 151
7.4 Results for the Quadtree-based Approaches . . . 156
7.5 Results for the Voronoi-based Approaches . . . 162
7.6 Comparison of the Pure Space Partitioning Approaches and the Improvements Achievable by their Simplest Hybrid Ex- tensions . . . 169
8 In-Depth Evaluation of the Selected Approaches 177 8.1 Further Evaluation of the
T1
Collection . . . 1818.1.1 Results at ‘MBRsize’ . . . 182
8.1.2 Results at ‘MBRsize-’ . . . 186
8.1.3 Results at ‘MBRsize+’ . . . 198
8.2 Evaluation of the
F
Collection . . . 2148.3 Evaluation of the
T1
Collection (Disallowing a Direct Repre- sentation) . . . 2248.4 Evaluation of the
F
Collection (Disallowing a Direct Repre- sentation) . . . 2308.5 Evaluation of the
F
Collection With an Altered Selection of the Query Points . . . 2338.6 Evaluation of the
T2
Collection . . . 2378.7 Evaluation of the Selected Approaches for Approximate Sim-
ilarity Search . . . 243
8.8 Excursus: Evaluation of Additional Properties . . . 249
8.8.1 Evaluation of the Query Radius Reduction . . . 249
8.8.2 Evaluation of the Duration of the Initial Resource Ranking . . . 257
8.9 Summarization of the Results for the Distributed Applica- tion Scenario . . . 262
8.9.1 Key Results of the Evaluation . . . 262
8.9.2 Degree of Thesis Objective Achievement and Contri- butions . . . 265
8.9.3 Starting Points for Future Work . . . 268
Part III: Centralized Application Scenario 273 9 Preliminaries and Motivation for the Centralized Applica- tion Scenario 275 10 Integrating Summaries into an R-tree 279 10.1 The Classical R-tree . . . 279
10.2 Modifications to the Traditional R-tree . . . 284
10.2.1 SELECTBEST-Modifications . . . 285
10.2.2 Backtracking Optimization . . . 285
10.2.3 SPLIT-Modifications . . . 286
10.3 Requirements for Summaries in an R-tree . . . 286
10.4 Summary-from-Summaries Calculation and Storage Struc- tures . . . 288
10.4.1 MBRQTc,a . . . 289
10.4.2 QTMBRbc,a . . . 291
10.5 Effects and Trade-Offs of the Integration of Sophisticated Summarization Approaches . . . 293
11 Query Algorithms 295 11.1 Range Query Algorithm . . . 295
11.2
k
NN Query Algorithm . . . 29512 Evaluation Environment 299 12.1 Assessment of the Results . . . 299
12.2 Data Collections . . . 299
12.3 Experimental Setup . . . 300
13 Evaluation 307 13.1 Assessment of the R-tree Construction Times . . . 307
13.2 Assessment of the Structural Differences . . . 318
13.2.1 MBR-like R-trees . . . 318
XII Contents
13.2.2 Summary-like R-trees . . . 345
13.3 Assessment of the Query Results . . . 370
13.3.1 Results for the T 5 scenario . . . 370
13.3.2 Results for the T 25 scenario . . . 400
13.3.3 Results for the R 5 scenario . . . 408
13.3.4 Results for the R 25 scenario . . . 422
13.4 Summarization of the Results for the Centralized Applica- tion Scenario . . . 428
13.4.1 Key Results of the Evaluation . . . 428
13.4.2 Degree of Thesis Objective Achievement and Contri- butions . . . 438
13.4.3 Starting Points for Future Work . . . 439
Part IV: Conclusion 449
14 Overall Conclusion 451
A. Appendix 453
List of Figures 457
List of Tables 471
References 479
In this work, specific terms are used to describe certain facts conveniently and concisely. This glossary serves as a reference to quickly look up these terms. Of course, all terms are also explained at the appropriate place dur- ing their introduction within the work.
accuracy-determining parameter: A parameter of a
resource description approach
which has a direct influence on the spatial accuracy of the approach’sresource summaries
. An approach can have one to severalaccuracy-determining parameters
(the only ex- ception is the parameter-free MBR approach). In general, all approach parameters except thecc
parameter of UFSn,cc respectively DFSbn,cc areaccuracy-determining
.approach: See
resource description approach
.Approachx,ya,b: For a hybrid
approach
, the subscript parameters are the parameters of the description base while the superscript parameters are the parameters of the refinement. For example, for KDMBRbn, param- etern
is for the basic k-d space partition while parameterb
is for the quantization accuracy of the refining MBRs.approximate
k
NN query: Ak
NN query for which the returned set ofk
data points is not guaranteed to be comprised of the truek
nearest neigh- bors but only of data points which are not too far away from the truek
nearest neighbors. In comparison toexact kNN queries
, they can of- ten be processed much faster.area: A geometrically delineated region of the data space which usually contains data points. For example, a Minimum Bounding Rectangle (MBR) of a data point set delineates an
area
.area-related key figures: A triplet of quantitative key figures relating to the
indexed areas
of a set ofsummary-represented resources
. In particular, the three key figures are the ‘overlap between summaries’, the ‘data space coverage’, and the ‘surface area per summary’. These key figures are always calculatedtechnique
-specifically for an entire data collection.baseline: Theoretical optimum of the resource fraction contacted (
rfc
) to solve a query. It is therfc
value that results if onlyrelevant
resources
would be contacted while processing a query whereas allirrelevant resources
arepruned
. In the evaluation, thebaseline
is averaged over the conducted set of queries.XIV Glossary
basic R-tree: The respective R-trees constructed with the use of MBR summaries which serve as a base for the evaluations of the
MBR-like R-trees
in the diverse scenarios (T 5 scenario
,T 25 scenario
,R 5 scenario
, andR 25 scenario
). Since within an assessment, allMBR-like R-trees
originate from the samebasic R-tree
, all their structures (i.e. the assignment of child nodes to parent nodes and of data points to leaf nodes) are identical.bend of a Skyline: Sharp and sudden flattening of the
Skyline
(which has the shape of a curve).big resource: A resource which administers many data points.
bit vector clipping: Generally, all
resource descriptions
are bit vec- tors. These bit vectors are physically clipped in a byte-aligned fashion after the rightmost bit of the logical bit vector which is set to ‘1’. For ex- ample, a bit vector of length 16 for which the highest index of a bit set to‘1’ is 5 (i.e. it is the rightmost bit is set to ‘1’, assuming the bit vector goes from left to right) is clipped after the first byte such that the bit vector has a physical length of only 8.
classical R-tree: An R-tree as specified in the original paper of Antonin Guttman ([Guttman 1984]).
complete quadtree: A
quadtree
which is structurally concluded and sound, i.e. the internal nodes and the leaf nodes of the quadtree struc- ture are arranged in a proper way, and all the required nodes exist.data-point-size: Amount of storage space required for (the coordinates of) a data point. In this thesis, it always accounts for 8 B of payload data.
data space unit (dsu): Base unit of the length of this work’s spatial data space which is embedded into a two-dimensional Cartesian coordinate system. The data space ranges from -180 to 180 in the x-dimension and from -90 to 90 in the y-dimension. For example, the distance between the data points
p
1 (0,0) andp
2 (1,0) is 1 data space unit (dsu) by use of the Euclidean distance.degenerated MBR: An MBR which has a very large extent in one dimen- sion and very small extents in all the other dimensions. Therefore, it is a very thin, elongated rectangle.
descriptive statistic: “A
descriptive statistic
(in the count noun sense) is a summary statistic that quantitatively describes or summa- rizes features of a collection of information. In contrast, descriptive1See https://en.wikipedia.org/wiki/Descriptive statistics, last visit: 05.08.2018.
statistics in the mass noun sense is the process of using and analyzing those statistics.”1 In this work, we use
descriptive statistic
values to summarize certain results like therfc
values for atechnique
over a set of queries.direct representation: See
directly represented resource
. Thedirect representation
is the instance depiciting the information on thedirectly represented resource
’s spatial footprint.directly represented resource: The spatial footprint of a resource is ‘di- rectly’ represented by the coordinates of the data point(s) it administers.
The
direct representation
is one of the two subtypes of aresource description
.disk access: See
page access
.duplicates: Two or more data points which feature the exactly same x/y- coordinates respectively lat/long-coordinates.
effectivity: The quality of how well it can be distinguished between rel- evant and irrelevant resources on basis of a
resource description approach
(respectively one of its parameterizations, i.e. atechnique
).It is measured by the average resource fraction contacted (
rfc
) for processing a query. The less resources are contacted, the better theeffectivity
of the approach.efficiency: The quality of how storage-space-efficient the
resource descriptions
are. It is measured in the average resource description size (rds
) required to describe the set of resources by use of a cer- taintechnique
. The lower the average size (in byte), the better theefficiency
of the approach.exact
k
NN query: Ak
NN query where the truek
nearest neighbors with respect to a given query point are returned as the query result.fanout: In a hierarchical tree structure, the
fanout
of a node is the node’s number of child nodes. Thefanout
of a tree is its internal nodes’ average number of child nodes.fixed grid: Grid that spans the entire data space. It is used to decompose the data space into grid cells. The grid cells can be of equal or non-equal size.
full quadtree: A
quadtree
for which at each level up to the leaf level, each formerquadtree cell
has been further partitioned, i.e. each internal node has four child nodes. Consequently, the leaf nodes of the quadtreeXVI Glossary
structure are all on the same level and the corresponding space partition is equivalent to a regular grid (assuming a
trie-based quadtree
).full-precision MBR: The MBR of a set of data points whose bounds are captured in a 32-bit single precision floating-point number format. A quantization to depict (approximated) bounds in a storage-space-saving way isnot applied.
global point density: The density of data points in a specific region of the data space with respect to a data collection’s entire data point set. In regions with a high (low)
global point density
, there are a lot (only few) of the data collection’s data points.global space partitioning: The process of decomposing space into sub- spaces based on the spatial distribution of the entire data collection’s data points. Therefore, the resulting space partition is the same for all re- sources. With regard to space partitioning, it is the counterpart to
local space partitioning
.high parameterization: Parameterization of an
approach
which results in spatially (very) accurateresource summaries
(if theapproach
’s other parameterizations serve as a basis for comparison). Also seehighest parameterization
.highest parameterization of an approach: The one parameterization of the tested set of parameterizations of an
approach
which results in the spatially most accurate resource summaries (and therefore most likely offers the bestrfc
values for thisapproach
).indexed area: An
area
which is described by thesummary
of a resource.It contains at least one data point of this resource. It is neither known how many data points are contained within the
indexed area
nor where their exact locations within thisarea
are. For example, when using the MBR approach for a resource’ssummary
, the MBR of a resource’s data point set is theindexed area
of this resource.initial quadtree: When MBRQTc,aand QTMBRbc,asummaries are not cal- culated from a set of data points but from a set of input rectangles, the respective
summary
calculation procedures are adapted: For bothapproaches
, aninitial quadtree
is imposed onto the data space to partition. Thisinitial quadtree
is afull quadtree
of a target depth td. This means that each internal node of thequadtree
structure has four children with the leaf nodes being at level td of the structure. In principle, theinitial quadtree
corresponds to a uniform grid of4
td cells for which each dimension has the same number of cells.inter-approach comparison: A comparison involving several different
approaches
. This means the concretetechniques
which are com- pared are based on differentapproaches
. For example, when comparing QTMBR332,1.0and MBRQT16,1.0, it is aninter-approach comparison
in- volving twotechniques
which are based on two differentapproaches
(the QTMBRbc,aapproach
and the MBRQTc,aapproach
).intra-approach comparison: A comparison involving several different
techniques
which are based on the sameapproach
. For example, when comparing QTMBR332,1.0and QTMBR664,0.1, it is anintra-approach comparison
involving twotechniques
of the QTMBRbc,aapproach
. irrelevant resource: Resource which does not administer any data pointof a specific query’s result.
k-d cell: Subspace of a k-d space partition. Logically, it represents a sub- region of the data space. A
k-d cell
corresponds to a leaf node in the correspondingk-d-tree
structure.k-d-based approaches: Approaches which rely on a
k-d-tree
as de- scription base. They can be approaches which rely solely onk-d-trees
(KDn) or hybrid approaches which utilizek-d-trees
as their description base (KDMBRbn, KDMARb,kn , KDQTc,an ).k-d-tree: A means to decompose space into subspaces based on recursion.
In each step, the (sub)space to decompose is split into two parts. It con- sists of the k-d space partition which is the logical decomposition of the space into subspaces (the
k-d cells
), and the k-d-tree structure which is a corresponding tree structure representing the split hierarchy.local space partitioning: The process of decomposing space into sub- spaces based only on the data points administered by the resource to summarize. Therefore, it is a resource-individual space partition. With regard to space partitioning, it is the counterpart to
global space partitioning
.low parameterization: Parameterization of an
approach
which results in spatially (very) coarseresource summaries
(if theapproach
’s other parameterizations serve as a basis for comparison). Also seelowest parameterization
.lower-level node: R-tree node which is at a lower level of the R-tree’s logical, hierarchical structure (i.e. closer to the leaf node level). The level indices are reverse to the logical structure, i.e. the leaf nodes (which are at the lowest level of the R-tree) have the greatest level index while the
XVIII Glossary
root node (which is at the uppermost level of the R-tree) has the level index 0.
lowest parameterization: The one parameterization of the tested set of parameterizations of an
approach
which results in the spatially least ac- curateresource summaries
(and therefore most likely offers the worstrfc
values for thisapproach
).MBR-based approaches: Approaches which rely on full-precision (i.e.
non-quantized) rectangles as description base. They can be ap- proaches which rely solely on full-precision rectangles (MBR approach, RecMARk,sl) or hybrid approaches which utilize full-precision rect- angles as their description base (MBRQTc,a, MARQTc,ak,sl). Also see
full-precison MBR
.MBR-like R-tree: R-tree that has been built by utilizing MBR summaries during the construction phase and in which the MBR summaries have eventually been replaced with more sophisticated
summaries
(either MBRQTc,a or QTMBRbc,a summaries), afterwards. Hereby, storage space limitations are not considered, i.e. the R-tree structure stays the same (i.e. the assignment of child nodes to parent nodes and of data points to leaf nodes).MBR-like MBR/MBRQTc,a/QTMBRbc,a R-tree:
MBR-like R-tree
in which MBR/MBRQTc,a/QTMBRbc,a summaries describe the spatial foot- prints of nodes.MBRselectivity: The
Skyline parameterization
of an approach whoserfc
value is closest to therfc
value of the MBR approach is enti- tled to be theSkyline parameterization
at ‘MBRselectivity
’ of this approach. Hence, ‘MBRselectivity
’ means as close to the selectivity of the MBR approach as the recorded data enables it.MBRQT8,a parameterizations: The MBRQTc,a parameterizations for which parameter
c = 8
. In the evaluation of the centralized application scenario, these are MBRQT 1, MBRQT 2, and MBRQT 3.MBRQT16,a parameterizations: The MBRQTc,a parameterizations for which parameter
c = 16
. In the evaluation of the centralized applica- tion scenario, these are MBRQT 4, MBRQT 5, and MBRQT 6.MBRsize: The
Skyline parameterization
of anapproach
whoserds
value is closest to therds
value resulting for the MBR approach is entitled to be theSkyline parameterization
at ‘MBRsize
’ of thisapproach
. Hence, ‘MBRsize
’ means as close to the storage space con- sumption of the MBR approach as the recorded data enables it.MBRsize-: It is defined analogously to ‘
MBRsize
’ but aims for significantly lower target-rds
-values (i.e.rds
values significantly below therds
value resulting for the MBR approach). In this work, we refrain from set- ting ‘MBRsize
-’ to a predefined target-rds
-value such as ‘8 B payload data’ since that way, possibly no anchor points at nearbyrds
values are present on all the approaches’ respectiveSkylines
. Instead, suitable target-rds
-values are selected in the given situations.MBRsize+: It is defined analogously to ‘
MBRsize
’ but aims for significantly greater target-rds
-values (i.e.rds
values significantly greater than therds
value resulting for the MBR approach). In this work, we refrain from setting ‘MBRsize
+’ to a predefined target-rds
-value such as ‘24 B payload data’ since that way, possibly no anchor points at nearbyrds
values are present on all the approaches’ respectiveSkylines
. Instead, suitable target-rds
-values are selected in the given situations.non-occupied cell: Cell of a space partition which does not contain any data point.
non-occupied subspace: See
non-occupied cell
.non-quadtree-utilizing approach:
Approach
which does not make use ofquadtrees
(neither as description base nor as refinement): MBR, RecMARk,sl, UFSn,cc, KDn, KDMBRbn, KDMARb,kn , and DFSbn,cc.occupied cell: Cell of a space partition which contains at least one data point.
occupied subspace: See
occupied cell
.outward appearance: A
summary
’s appearance towards the query pro- cessor. In the query processing of the centralized application scenario, only the MINDIST between asummary
and the query point is calcu- lated. Hence, the only thing a query processor ‘knows’ of asummary
is thesummary
’s closest point to the query point. This closest point corresponds to thesummary
’soutward appearance
towards the query processor.page access: An R-tree takes secondary memory into account, i.e. it stores its data on a hard drive disk. Therefore, its nodes are mapped to pages on this hard drive disk. Whenever a node is accessed, the cor- responding page on the hard drive disk has to be accessed, i.e. a
page access
has to be conducted.precise
k
NN query: Seeexact kNN query
.XX Glossary
pruning:
Pruning
refers to excluding the entire data point set of a re- source from further consideration on the basis of the lower bound dis- tance between the query point and the resource’s spatial footprint.quadtree: A means to decompose space into subspaces based on recur- sion. In each step, the (sub)space is split into four parts. It consists of the quadtree space partition which is the logical decomposition of the space into subspaces (the
quadtree cells
), and the quadtree structure which is a corresponding tree structure representing the split hierarchy.quadtree cell: Subspace of a quadtree space decomposition. Logically, it represents a subregion of the data space. A
quadtree cell
corresponds to a leaf node in the corresponding quadtree structure.quadtree condensation: Four equal-colored sibling leaf nodes of the quadtree structure are condensed into their father node which then be- comes a leaf node of the same color itself.
quadtree region: See
quadtree cell
. quadtree subspace: Seequadtree cell
.quadtree-based approaches: Approaches which rely on a
quadtree
as description base. They can be approaches which rely solely onquadtrees
(QTc,a), or hybrid approaches which utilizequadtrees
as their descrip- tion base (QTMBRbc,a, QTMARb,kc,a).quadtree-utilizing approaches: Approaches which utilize
quadtrees
in any form(be it as description base or as refinement): QTc,a, GridQTc,ar , KDQTc,an , QTMBRbc,a, QTMARb,kc,a, MBRQTc,a, and MARQTc,ak,sl.query cell: The cell of a space partition in which the query point is lo- cated.
R 5 scenario: Evaluation scenario in which the
R
collection’s data points are inserted into R-trees which have a leaf node capacity of 5 data points.R 25 scenario: Evaluation scenario in which the
R
collection’s data points are inserted into R-trees which have a leaf node capacity of 25 data points.rds: Resource description size. Usually, it refers to the average resource description size required to describe the given set of resources by a spe- cific
technique
. In corresponding contexts, it can also be used to denote thedescriptive statistic
values (i.e. meanrds
, minrds
, maxrds
, medianrds
, and so on) required for describing the given set of resourcesby a specific
technique
, or the resource description size for a single re- source and a specifictechnique
.relevant resource: Resource administering at least one data point that is part of the query result.
relative error: The
relative error
is assessed with respect tokNN queries
. It is the resource fraction contacted (rfc
) for whichm
of the finalk
closest data points have been found (withm ≤ k
).resource description: Description of a resource’s spatial footprint. It can be either a
summary
or adirect representation
.resource description approach: Specific
approach
to describe the spa- tial footprint of a resource. First, the resource’ssummary
is calcu- lated by the specificsummarization approach
. If the correspond- ingsummary
requires more storage space than the coordinates of the resource’s data points, the resource isdirectly represented
instead ofsummary-represented
. The termresource description approach
includes the calculation of asummary
using asummarization approach
and the possible replacement of thesummary
by thedirect representation
of the resource. In the centralized application scenario, there isnodirect representation
option.resource description transmission method shares: Share informa- tion about how the
resource descriptions
are transmitted, i.e.how many percent of the total amount of
resource descriptions
are of whichresource description type
. Mostly, theresource description transmission method shares
refer to a specifictechnique
. For example, for KD32, it could bew
% sum-z,x
% sum- nz,y
% dr-z, andz
% dr-nz (w + x + y + z = 100
).resource description type: In the very end, the
resource description
instances are all bit vectors. To save storage space, the bit vectors can be of differentresource description types
. Fornon-quadtree-utilizing approaches
, the possible types are a zippedsummary
(sum-z), a non-zippedsummary
(sum-nz), a zippeddirect representation
(dr-z), or a non-zippeddirect representation
(dr- nz). Forquadtree-utilizing approaches
, the options are a zipped and LQ-encodedsummary
(lq-z), a non-zipped and LQ-encodedsummary
(lq-nz), a zipped and CLBQ-encodedsummary
(cblq-z), a non-zipped and CBLQ-encodedsummary
(cblq-nz),dr-z, ordr-nz.resource size: The number of data points a resource administers. The more (less) data points, the bigger (smaller) the resource. Also see
big
resource
andsmall resource
.XXII Glossary
rfc: Resource fraction contacted to process a query completely. Usually, it refers to the average resource fraction contacted over a set of queries. In corresponding contexts, it can also be used to denote the
descriptive statistic
values (i.e. meanrfc
, minrfc
, maxrfc
, medianrfc
, and so on) over a set of queries, or the resource fraction contacted for a single query and a specifictechnique
.selectivity: See
effectivity
.Skyline: The
Skyline
of anapproach
is forged of anapproach
’s set of non-dominated parameterizations. The dominance criterion is assessed with respect to the two ‘dimensions’rds
value andrfc
value which re- sult for the specific parameterizations of anapproach
. Thus, a pointp
x representing a parameterizationx
dominates a pointp
y represent- ing a parameterizationy
if (p
x.rf c ≤ p
y.rf c
andp
x.rds < p
y.rds
), or (p
x.rf c < p
y.rf c
andp
x.rds ≤ p
y.rds
).Skyline parameterization: A specific parameterization of an
approach
which is part of theapproach
’sSkyline
(i.e. it is not dominated by any other parameterization of thisapproach
).small resource: A resource which administers only few data points.
smallest indexable spatial unit: The smallest spatial
area
asummarization approach
can describe. For some approaches, it is an ‘infinitely’ smallarea
(corresponding to a point, such as for the ap- proaches utilizingfull-precision
rectangles) while other approaches are only able to indexareas
with asurface area
greater than 0 (such as quantization-based approaches or pure space partitioning approaches).spatial scattering of a leaf node: Maximum distance between any pair of data points stored in the leaf node of an R-tree. The greater the max- imum distance, the greater the
spatial scattering
.spatially narrow resource: Resource whose data points are all located in a very closely confined region of the data space.
spatially spread resource: Resource whose data points are scattered far across the data space.
summarization approach: Specific
approach
to describe a set of spatial data points by one or severalindexing areas
.summary: See
summary-represented resource
. Thesummary
is the instance depicting the information on thesummary-represented
resource
’s spatial footprint.summary-like R-tree: R-tree that has been built by utilizing the respec- tive
technique
’ssummaries
. Storage space limitations are considered insummary-like R-trees
, i.e. the internal nodes’ storage space capacity is restricted to 4,096 B. Consequently, the R-tree structures of differentsummary-like R-trees
(i.e. the assignment of child nodes to parent nodes and of data points to leaf nodes) vary.summary-like MBR/MBRQTc,a/QTMBRbc,a R-tree:
Summary-like R-tree
in which MBR/MBRQTc,a/QTMBRbc,a summaries describe the spatial footprints of nodes.summary-represented resource: The spatial content of a resource is represented in an ‘aggregated’ form by one or several geometrically de- lineated
areas
containing all of a resource’s data points. It is not known where the data points are exactly located but only that they are some- where within theseindexed areas
. This allows for the calculation of upper and lower bound distances with respect to the distance between the spatial footprint of a resource and specific data points. Thesummary
representation is one of the two subtypes of aresource description
. summary description type: The set ofresource description types
without thedirect representation
options. Hence, forquadtree-utilizing approaches
, the availablesummary description types
are lq-z, lq-nz, cblq-z, and cblq-nz. Fornon-quadtree-utilizing approaches
, it is sum-z and sum-nz (also seeresource description type
).summary size: Amount of storage space required for a concrete instance of a
summary
.surface area: The amount of
area
covered by the surface of a geometri- cally delineated form. For example, an MBR of 10dsu
width and 10dsu
height has asurface area
of10 dsu · 10 dsu = 100 dsu
2.T 5 scenario: Evaluation scenario in which the
T
collection’s data points are inserted into R-trees which have a leaf node capacity of 5 data points.T 25 scenario: Evaluation scenario in which the
T
collection’s data points are inserted into R-trees which have a leaf node capacity of 25 data points.technique: A specific approach/parameter-combination. For example, KDMBRbn is the general
approach
while KDMBR332 is atechnique
with its parametersn
set to 32 andb
set to 3.XXIV Glossary
traditional R-tree: An R-tree which uses MBR summaries to describe the spatial footprints of its nodes. It does not necessarily have to use the algorithms of Guttman’s
classical R-tree
but might use algorithms introduced with diverse R-tree variants such as the R*-tree.tree-based quadtree/k-d-tree: Space partition based on a tree structure (either a quadtree structure or a k-d-tree structure) for which the split- ting hyperplanes are obtained from the data points located in the sub- space to split. Consequently, the resulting cells of the quadtree/k-d space decomposition might be arbitrarily-sized. It is the counterpart of the
trie-based quadtree/k-d-tree
.trie-based quadtree/k-d-tree: Space decomposition based on a tree structure (either a quadtree structure or a k-d-tree structure) for which the subspace to split is always divided into regular parts (four for the
quadtree
, two for thek-d-tree
). Consequently, the resulting cells of the quadtree/k-d space decomposition are equal-sized. It is the counter- part of thetree-based quadtree/k-d-tree
.upper-level node: R-tree node which is at an upper level of the R-tree’s logical, hierarchical structure (i.e. closer towards the root node level).
The level indices are reverse to the logical structure, i.e. the root node (which is at the uppermost level of the R-tree) has the level index 0 while the leaf nodes (which are at the lowest level of the R-tree) have the great- est level index.
Voronoi-based approaches: Approaches which rely on a Voronoi dia- gram as description base. They can be approaches which rely solely on Voronoi diagrams (UFSn,cc), or hybrid approaches which utilize Voronoi diagrams as their description base (DFSbn,cc).
zero volume node: A node in an R-tree whose
summary
indexes (an)area
(s) with a totalsurface area
of 0 dsu2.Part I:
Background and Problem
Description
This thesis is concerned with the effective and efficient summarization of sets of two-dimensional spatial point data as a means of describing ‘re- sources’, and its utilization for the targeted selection of resources in dif- ferent application scenarios. The termefficientrefers to the storage-space- efficient summarization of these data point sets while the term effective relates to the spatial accuracy of the summarizations. Obviously, both as- pects are conflicting, and the diverse application scenarios also require additional tasks complementing the summarization. In this section, the fundamentals of the thesis are outlined. Therefore, section 1.1 starts with a general motivation of this work. In section 1.2, the two application sce- narios for which our resource description approaches are examined in this thesis are presented. Afterwards, the general problem description is show- cased in section 1.3. In section 1.4, the thesis objectives are depicted. Fi- nally, section 1.5 presents the thesis outline.
1.1. Motivation
“Space is everywhere”. This well-worn phrase is a truism. As a subject of the real world, every human being naturally moves in space. Space is his or her environment, and this environment is populated with objects. Each of these objects has properties that include spatial characteristics: Position, dimension, spatial orientation, and so on [van der Zee and Scholten 2014, p.
6]. These spatial characteristics are integral aspects of every object. Space is everywhere, indeed, and so are spatial problems [Singh 2018, p. xvii].
Spatial problems are most often associated with spatial data, obviously.
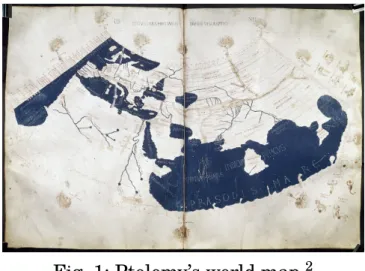
Both are not new. In second-century Egypt, Claudius Ptolemy experi- mented with spatial data when he was attempting to depict the world on his map (see Figure 1). Similarly, early astronomers used spatial data when they tried to create a celestial map [Fotheringham et al. 2000, p. 15]. The computational facilities at their disposal were rather rudimentary, though.
Today, the digital revolution enables to process data of several orders of magnitude more. At the same time, technical progress leads to an ever faster generation of ever larger quantities of spatial data which are used in a wide variety of applications.
Oftentimes, these applications are visualizations of spatial data as they naturally lend themselves for this purpose. For example, the “Sunrise around the World” visualization3 is a time-lapsed dot density map which shows geotagged Twitter tweets containing the word ‘sunrise’ (in different languages) around the world. The tweets have been captured on April 6,
2Source: https://upload.wikimedia.org/wikipedia/commons/2/23/PtolemyWorldMap.
jpg, last visit: 13.07.2018.
3See http://cartodb.s3.amazonaws.com/static vizz/sunrise.html, last visit:
12.07.2018.
4 1.1. Motivation
Fig. 1: Ptolemy’s world map.2
2014. The application shows the ‘tidal wave’ of tweets moving across the world map in synchronization with the sunrise (see Figure 2).
There are also more serious use cases. For example, there have been two massive accidents on the Dubai Highway (E10) in Abu Dhabi involving over 200 (March 2008) respectively 130 vehicles (April 2011). These accidents were caused by dense fog banks which severely restricted vision. Abu Dhabi is a smart city with a well integrated transport infrastructure in which a large number of sensors generate huge amounts of spatial data. To solve the collision problem, a system has been developed that collects and an- alyzes the data, and sends real-time warnings (via various channels) to drivers which are about to enter areas with poor visibility [GW 2016].
The omnipresence of spatial data also applies to areas from which one does not suspect it at first. In 2008, the Nobel Prize in Economics was awarded to Paul Krugman for his work which explains why some countries dominate the international trade. Now, what does this have to do with spatial data?
The prize was given to Krugman on the basis of three papers. The first two dealt with international trade, in particular intra-industrial trade. The last paper extends the analysis to the spatial allocation of economic activi- ties, making it the central model of the new economic geography literature [Brakman and Garretsen 2009, p. 2]. Without being able to judge whether this heavily discussed decision of the Nobel Prize Committee was appro-
Fig. 2: ‘Sunrise around the World’ visualization of geotagged Twitter tweets containing the word ‘sunrise’. The visualization is time-lapsed and depicts the tweets’ locations at different points in time.
priate or not, once more, this shows the enormous importance of spatially related phenomena and processes.
Hence, not only space but also spatial data is (almost) everywhere. But what exactly is spatial data, and how do the terms geographic data and geospatial data relate? In this thesis, we follow the terminology introduced by Bhatta (see [Bhatta 2011]):4Geographicdata is data for which the frame is the surface of the Earth.Spatialdata has a broader meaning as ‘spatial’
is ‘pertaining to space’ (any space, not only the Earth’s surface) and thus encompasses the term geographic. Accordingly, geographic data is a subset of spatial data. The often-used term geospatial typically refers to spatial data which is related to Earth and therefore conforms to the term geo- graphic, although spatial and geospatial are oftentimes used interchange- ably.
A relative of “space is everywhere” is the phrase “spatial is special”. The justifications for this claim often refer to processing-relevant properties (e.g. the possibly complex structure of spatial data, or the more expensive spatial operations in comparison to standard relational operations [Gaede and G ¨unther 1998, ch. 2.1]) or analysis-relevant properties (e.g. spatial de- pendence or spatial error [Anselin 1989]) of the spatial data. In any case, special properties of spatial data are the diversity of data sources and the enormous amounts of data. A small selection of spatial data sources in- cludes the following [Wilson and Fotheringham 2008, p. 3]:
— censuses of population (recording information on each individual in each household and on the household itself),
— customer databases of retail-related companies,
— traffic flow monitoring (along streets, intersections, and so on),
— LiDAR (Light Detection And Ranging, low pass fly-overs by plane),
— digital elevation models captured via satellites, and
— data generated from consumer devices equipped with GPS sensors such as smartphones or cameras.
The amounts of spatial data generated both professionally as well as pri- vately are massively increasing. As early as 2009, the McKinsey Global Institute reported that the pool of personal location data is in the range of 1 petabyte (PB) and growing at a rate of 20% per year. In this estimation, the data from RFID sensors and data stored in private archives was not even included [Dasgupta 2013]. In 2012, Google generated about 25 PB of data every day of which a significant portion falls into the spatiotemporal domain [Vatsavai et al. 2012, p. 2]—which includes the spatial property of the data, obviously. For the year 2015, Eldawy and Mokbel reported that for example space telescopes generated up to 150 gigabyte (GB) of weekly spatial data or 10 million geotagged tweets were issued from Twitter every- day (by assuming that about 2% of the daily tweets are geotagged) [Eldawy
4Also see http://basudebbhatta.blogspot.de/2010/02/spatial-and-geospatial.html, last visit: 13.07.2018.
6 1.1. Motivation
and Mokbel 2016, p. 1]. Lesczynski and Crampton note it is estimated that up to 80% of ‘big data’ is “spatial” insofar as it is characterized by some lo- cational component—be it spatial coordinates, geographical metadata, an associated street address, or the content of the data itself making a refer- ence to a place in the physical space [Leszczynski and Crampton 2016, p.
1]. Regardless of the concrete amounts of spatial data produced nowadays, one thing is certain: The pool of available spatial data is very large, and the amount of spatial data generated per day is constantly increasing.
Generally, there are two broad categories of spatial data: raster data and vector data. For raster data, the space is partitioned at a fixed resolution, i.e. a fixed cell size is defined. In contrast, vector data is basically comprised of coordinates. Examples for vector data are polygons, lines, or points. In this work, we are specifically interested in spatial vector point data.
The typical processing chain of spatial data is extensive. First, the data has to be collected, for example from the sources listed above. Then, the data must be stored and transferred. This can be challenging given the poten- tially enormous amounts of data. Usually, the data must then be converted into useful information for which a data visualization and/or a data anal- ysis have to be conducted. A depiction of the usual spatial data processing chain can be found in [Wilson and Fotheringham 2008, p. 2].
When processing sets of point data, searching for data points that fulfill certain properties is a recurring process. Despite the computing power available today, an efficient search in a large point data collection cannot take place if each point has to be considered individually in a sequential scan. The data has to be organized in an appropriate way so that only (opti- mally small) subsets of the total point data set must be considered for such- like searches. In this context, the concept ofresource description and selec- tion is a useful paradigm to cope with the arising challenges. Similar to spatial data problems, this concept reaches back to days long before the in- vention of computers. As an example, consider the Library of Alexandria: It was founded by Ptolemy I Soter (not to be confused with Claudius Ptolemy) in the 3rd century B.C. For the number of papyrus scrolls maintained in the library, the estimates range from 40,000 to 400,000.5Irrespective of the concrete number, at the time, it was a huge amount of scrolls to be main- tained. The scrolls were grouped together by subject and stored in bins.
Each bin was bearing a label with painted tablets hanging over the stored papyri. These Pinakes (Greek for tables) gave bibliographical information for each roll. A typical entry provided—among other things—information on the author (name, birthplace, educational background, and so on), the first line of the work, and a summary of its contents [Phillips 2010].
The organization of spatial point data into ‘resources’ (similar to the bins in the Alexandria Library) and the concise, yet meaningful description of these resources’ contents (similar to the Pinakes) is a generic, abstract ap-
5See https://en.wikipedia.org/wiki/Library of Alexandria, last visit: 13.07.2018.